Strategy vault / Trend following
Multi Period Phase Crossover with EMA Trend Following Strategy
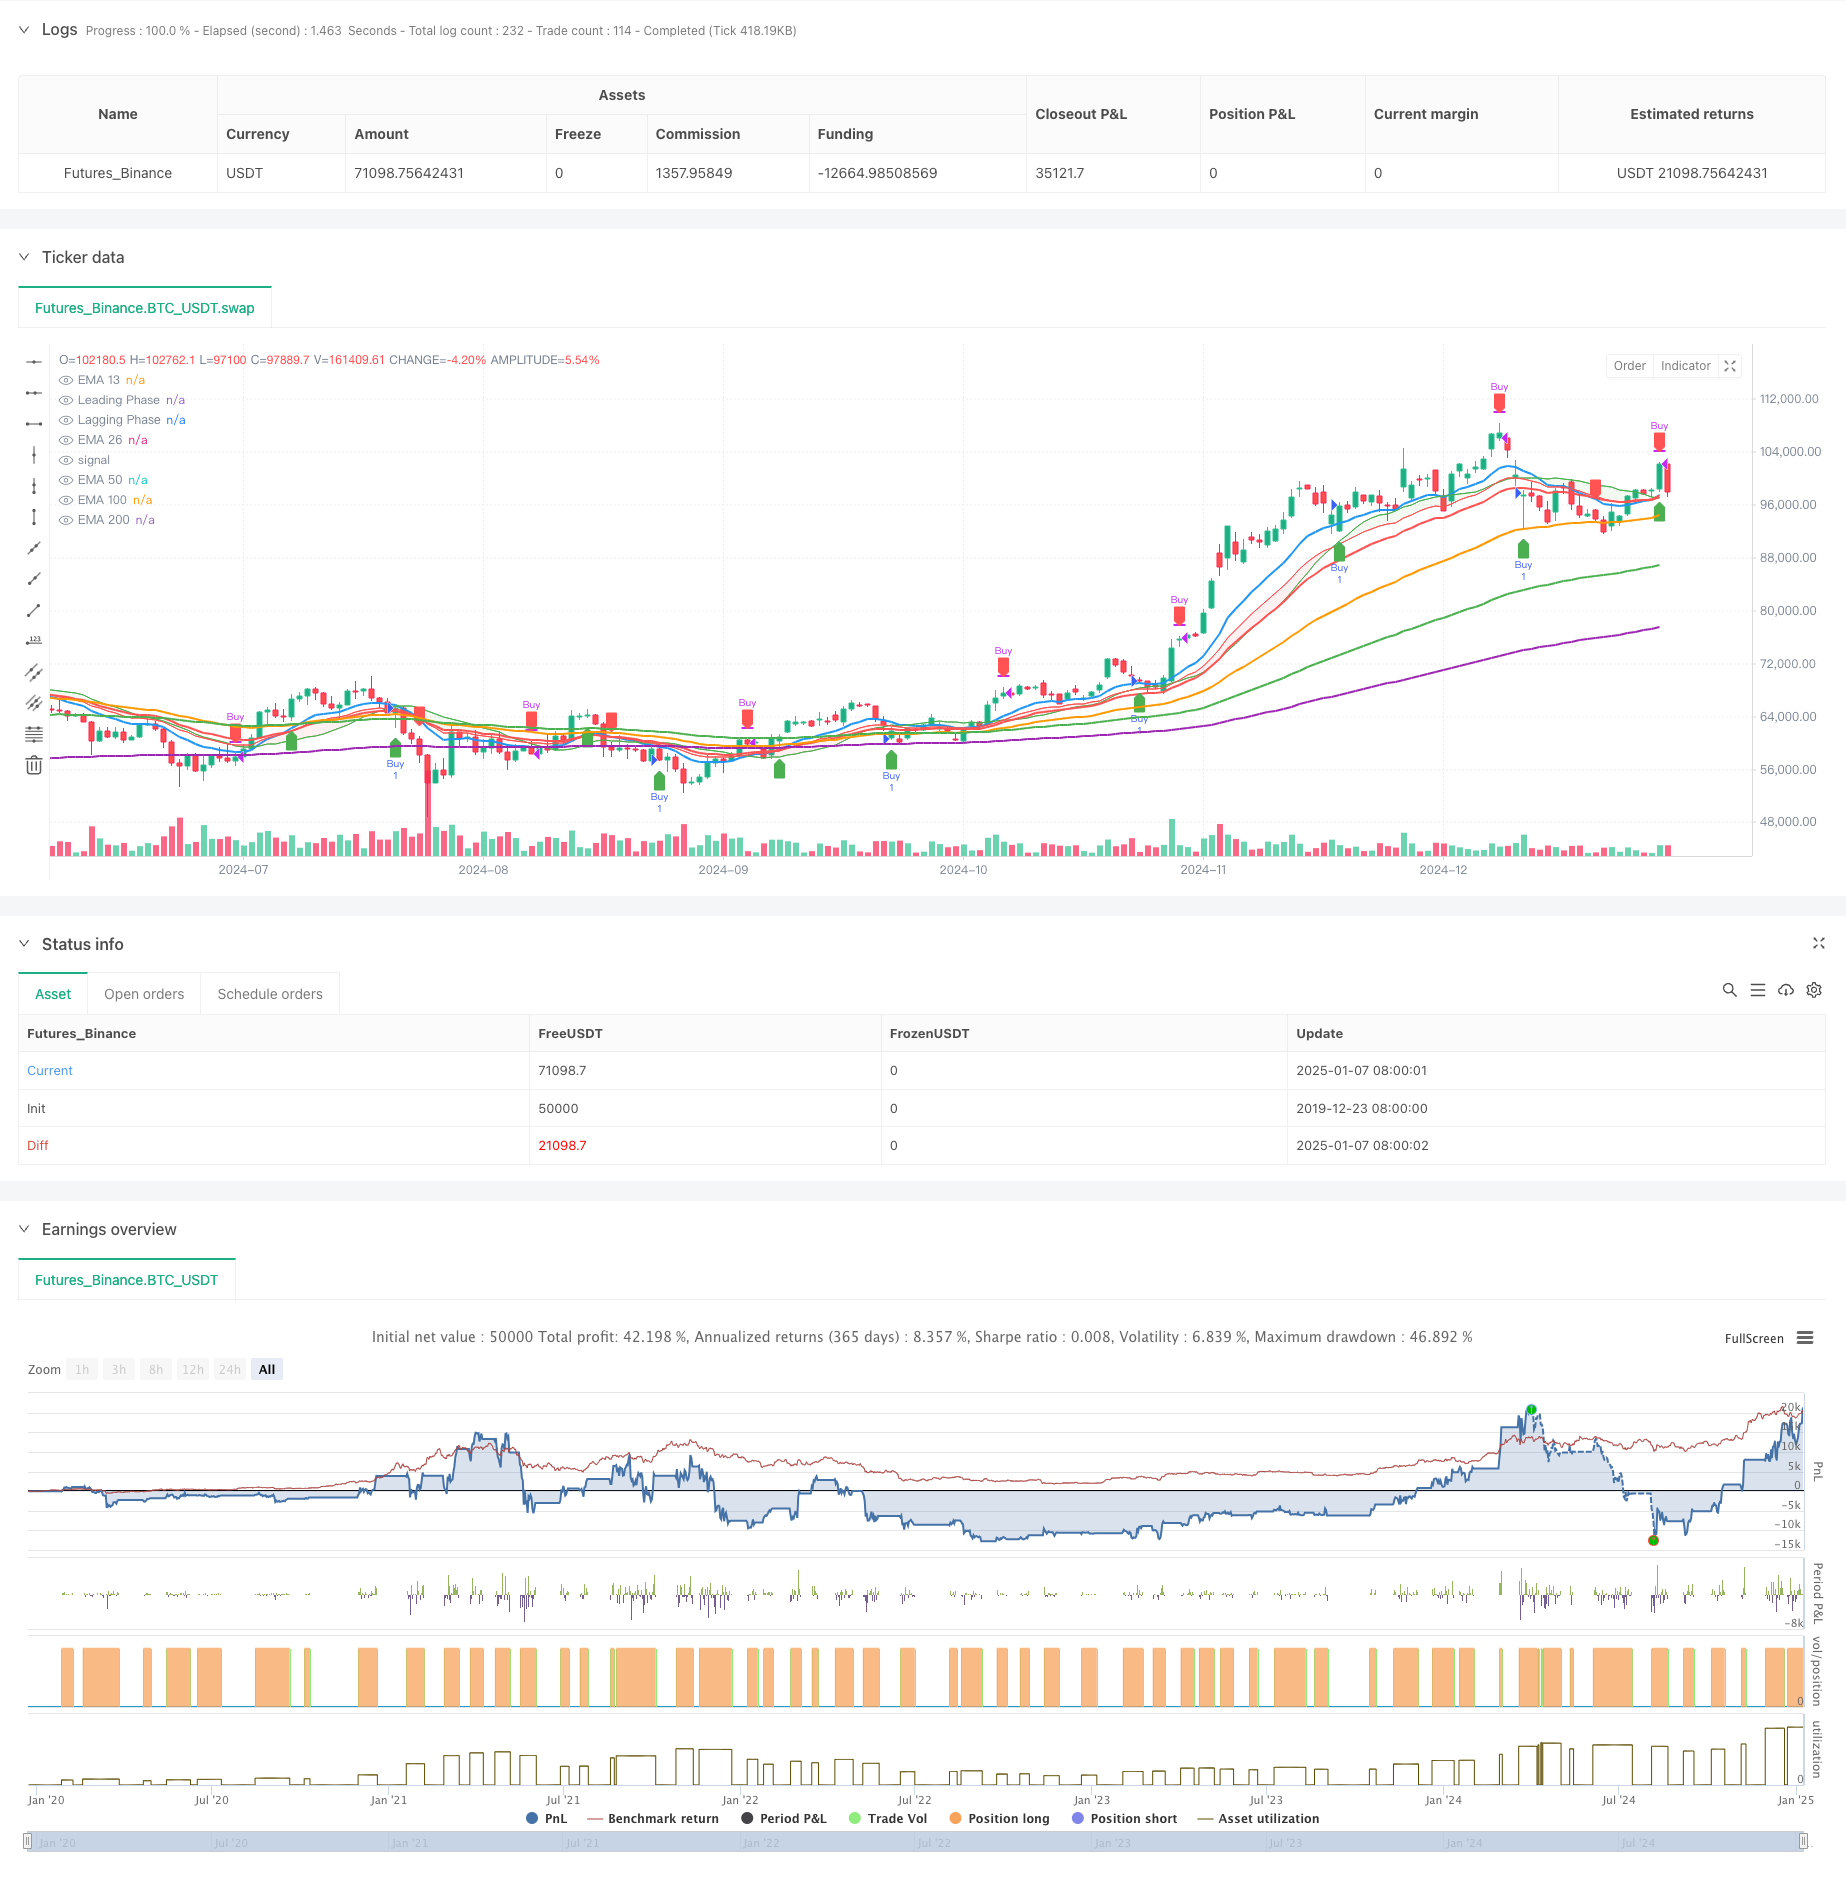
This strategy combines phase crossover signals with multi-period exponential moving averages to capture market buying and selling opportunities. It utilizes the crossover of Leading Phase and Lagging Phase to…
Overview
This strategy combines phase crossover signals with multi-period exponential moving averages to capture market buying and selling opportunities. It utilizes the crossover of Leading Phase and Lagging Phase to generate trading signals, while incorporating 13, 26, 50, 100, and 200-period EMAs for trend confirmation, providing a comprehensive solution for trend following and short-term trading.
Strategy Principles
The core logic consists of two main components: the Phase Crossover System and the EMA Trend Confirmation System. The Phase Crossover System uses a Simple Moving Average (SMA) with upward offset as the Leading Phase and an Exponential Moving Average (EMA) with downward offset as the Lagging Phase. Buy signals are generated when the Leading Phase crosses above the Lagging Phase, and sell signals when it crosses below. The EMA Trend Confirmation System uses multiple period (13/26/50/100/200) exponential moving averages to confirm overall market trends, with the 13 and 26-period EMA crossovers serving as secondary trading signals.
Strategy Advantages
- Complete Signal System: Combines short-term phase crossover signals with long-term trend confirmation to effectively filter false signals
- Strong Trend Following Capability: Accurately captures main trend directions through multi-period EMA system
- Good Visualization: Uses colored zones to identify bullish and bearish conditions with clear trading signals
- Strong Parameter Adaptability: Can be adjusted for different market characteristics and trading periods
- Reasonable Risk Control: Combines multiple indicators for confirmation to effectively control trading risks
Strategy Risks
- Oscillation Market Risk: May generate excessive trading signals during consolidation phases, increasing trading costs
- Lag Risk: Moving averages inherently have lag, potentially missing optimal entry points
- False Breakout Risk: May generate false breakout signals during high market volatility
- Parameter Sensitivity: Different parameter settings may lead to significant strategy performance variations
- Market Environment Dependency: Strategy performs better in trending markets but underperforms in oscillating markets
Strategy Optimization Directions
- Add volatility filters to reduce trading frequency during low volatility periods
- Include volume confirmation indicators to improve signal reliability
- Optimize stop-loss and take-profit mechanisms, establish dynamic stop-loss system
- Introduce market environment classification to adjust strategy parameters for different market states
- Develop adaptive parameter system for dynamic strategy optimization
Summary
This strategy builds a comprehensive trend following trading system by combining phase crossover and multi-period EMA systems. It features clear signals, accurate trend capture, and reasonable risk control, while also having certain lag and false signal risks. The strategy's stability and reliability can be further enhanced through optimizations such as adding volatility filters and volume confirmation. It is suitable for application in clearly trending markets, and traders need to adjust parameters based on specific market characteristics and individual risk preferences.
Source Pine Script
/*backtest
start: 2019-12-23 08:00:00
end: 2025-01-08 08:00:00
period: 1d
basePeriod: 1d
exchanges: [{"eid":"Futures_Binance","currency":"BTC_USDT"}]
*/

//@version=5
strategy("Phase Cross Strategy with Zone", overlay=true)

// Inputs
length = input.int(20, title="Smoothing Length")
source = input(close, title="Source")
offset = input.float(0.5, title="Offset Amount", minval=0.0)  // Offset for spacing

// Simulating "Phases" with Smoothed Oscillators
lead_phase = ta.sma(source, length) + offset  // Leading phase with offset
lag_phase = ta.ema(source, length) - offset  // Lagging phase with offset

// Signal Logic
buySignal = ta.crossover(lead_phase, lag_phase)
sellSignal = ta.crossunder(lead_phase, lag_phase)

// Plot Phases (as `plot` objects for `fill`)
lead_plot = plot(lead_phase, color=color.green, title="Leading Phase", linewidth=1)
lag_plot = plot(lag_phase, color=color.red, title="Lagging Phase", linewidth=1)

// Fill Zone Between Phases
fill_color = lead_phase > lag_phase ? color.new(color.green, 90) : color.new(color.red, 90)
fill(plot1=lead_plot, plot2=lag_plot, color=fill_color, title="Phase Zone")

// Plot Buy and Sell Signals
plotshape(buySignal, style=shape.labelup, location=location.belowbar, color=color.new(color.green, 0), title="Buy Signal", size=size.small)
plotshape(sellSignal, style=shape.labeldown, location=location.abovebar, color=color.new(color.red, 0), title="Sell Signal", size=size.small)

// Strategy Entry and Exit
if buySignal
    strategy.entry("Buy", strategy.long)

if sellSignal
    strategy.close("Buy")


//indicator("EMA 13, 26, 50, 100, and 200 with Crossover, Value Zone, and Special Candles", overlay=true)

// Define the EMAs
ema13 = ta.ema(close, 13)
ema26 = ta.ema(close, 26)
ema50 = ta.ema(close, 50)
ema100 = ta.ema(close, 100)
ema200 = ta.ema(close, 200)

// Plot the EMAs
plot(ema13, color=color.blue, linewidth=2, title="EMA 13")
plot(ema26, color=color.red, linewidth=2, title="EMA 26")
plot(ema50, color=color.orange, linewidth=2, title="EMA 50")
plot(ema100, color=color.green, linewidth=2, title="EMA 100")
plot(ema200, color=color.purple, linewidth=2, title="EMA 200")

// Crossover conditions
uptrend = ta.crossover(ema13, ema26)  // EMA 13 crosses above EMA 26 (buy)
downtrend = ta.crossunder(ema13, ema26)  // EMA 13 crosses below EMA 26 (sell)

// Plot buy/sell arrows
plotshape(series=uptrend, location=location.belowbar, color=color.green, style=shape.labelup, size=size.small, title="Buy Signal")
plotshape(series=downtrend, location=location.abovebar, color=color.red, style=shape.labeldown, size=size.small, title="Sell Signal")
Published by ChaoZhang on the FMZ strategy square · last modified 2025-01-10. Collected in the Quant Trading Vault. Unvalidated research: re-test with your own data and costs before trusting it.
Build this with AgenKit
A spec is not a trading system. Paste this into your coding agent and AgenKit runs a specialist team — architecture, test-first build, risk gates, review — with paper trading on by default.
/agenkit build a production-grade trading bot with a backtest engine, risk controls and paper trading by default from strategies/Multi-Period-Phase-Crossover-with-EMA-Trend-Following-Strategy.md- npx agenkit install engineering-kit in your project
- Paste the command into your agent and approve each phase
- Get tests, backtest, risk controls and a paper-trading switch
Understand it first
Before you run this, read the lesson behind the idea and how to backtest it honestly. Specs like this one are the survivors of an unknown number of trials; deflate their results accordingly.
Related specs
- EMA SMA Trend Following with Swing Trading Strategy Combined Volume Filter and Percentage Take Profit Stop Loss SystemPine Script · Trend following · 1d
- Fixed Range Volume Profile And Anchored VWAP Trend Identification Strategy With Dynamic Stop LossPine Script · Trend following · 1h
- Multi Factor Trend Price Action Strategy with Dynamic Risk Management SystemPine Script · Trend following · 2h
- Multi Period Moving Average Ribbon and MACD Crossover Strategy SystemPine Script · Trend following · 1h
- Trend Following Strategy Based on Moving Average 439858Pine Script · Trend following · 1d
- YinYang RSI Volume Trend Trading StrategyPine Script · Trend following · 1h