Multi Period Price Level Breakout Trend Trading System Based on Key Price Levels
This strategy is a breakout trading system based on multiple key price levels. It primarily tracks six critical price levels: High of Day (HOD), Low of Day (LOD), Premarket High (PMH), Premarket Low (PML), Previous…
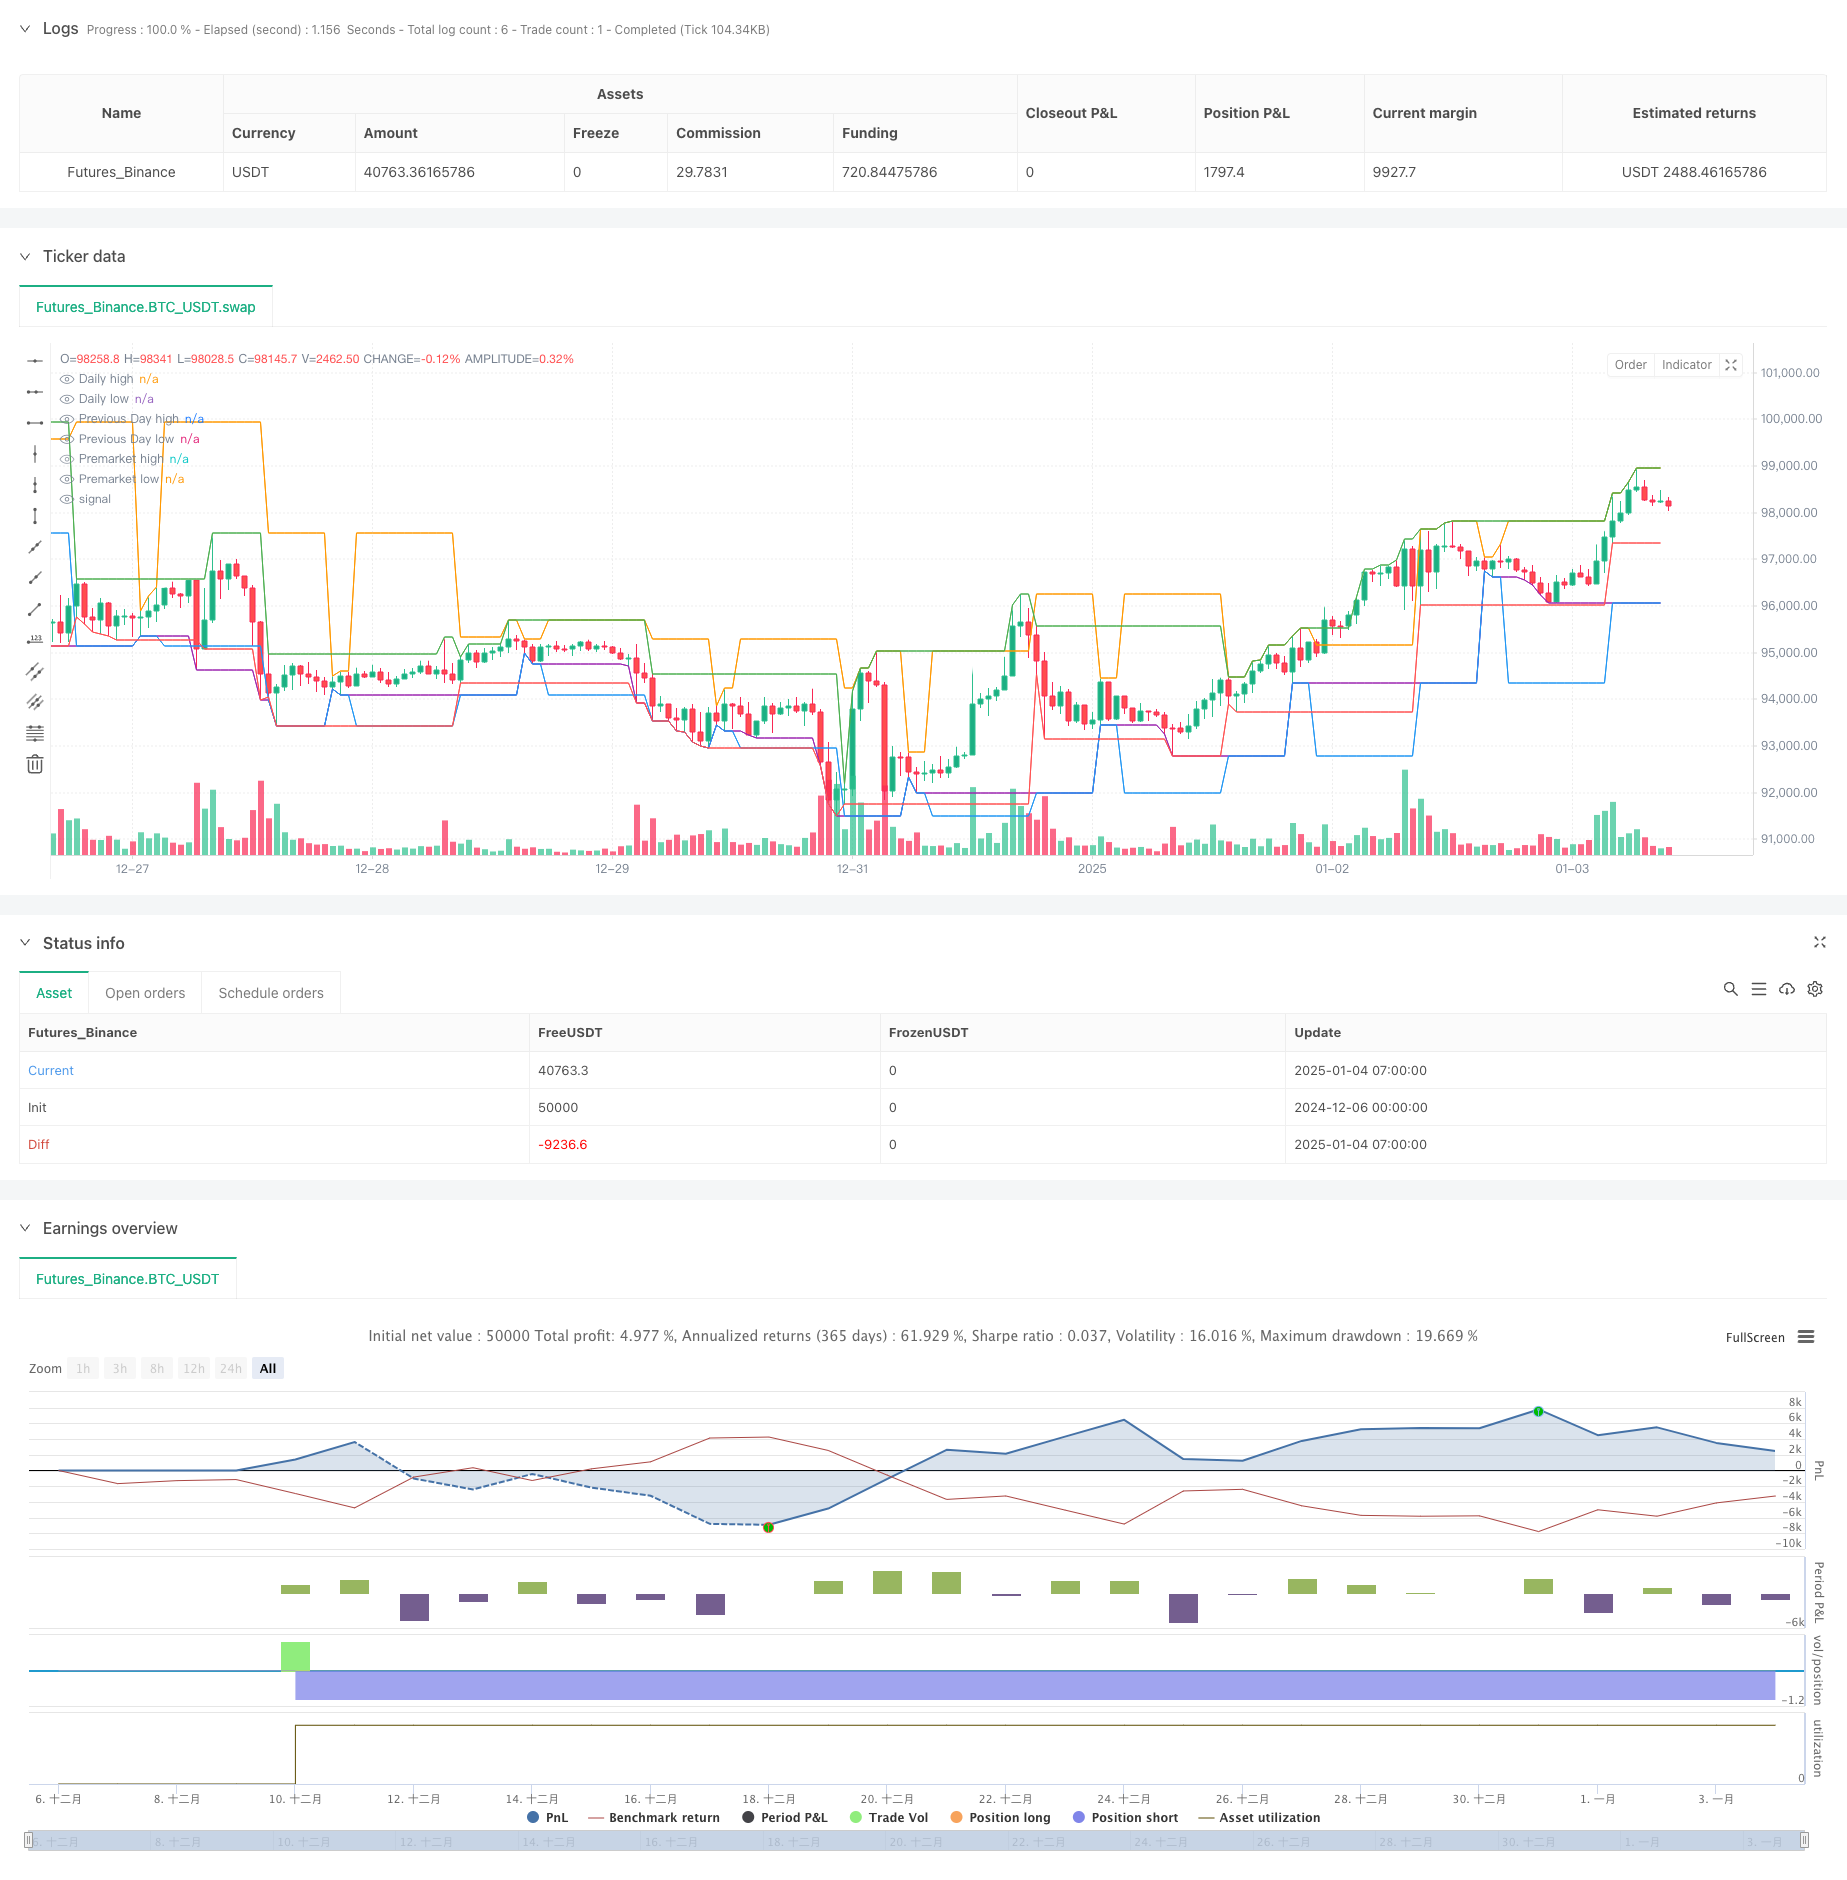
Overview
This strategy is a breakout trading system based on multiple key price levels. It primarily tracks six critical price levels: High of Day (HOD), Low of Day (LOD), Premarket High (PMH), Premarket Low (PML), Previous Day High (PDH), and Previous Day Low (PDL). The system generates trading signals through price breakouts of these levels and executes trades automatically based on price crossovers.
Strategy Principles
The core logic includes several key components:
- Key price level calculation: Uses request.security function to obtain price data from different time periods to calculate six key price levels.
- Entry conditions: Opens long positions when price breaks above PMH or PDH; opens short positions when price breaks below PML or PDL.
- Exit conditions: Closes long positions when price reaches HOD; closes short positions when price reaches LOD.
- Visual representation: Marks price levels with different colored horizontal lines - white for HOD, purple for LOD, orange for PDH, blue for PDL, green for PMH, and red for PML.
Strategy Advantages
- Multi-dimensional price reference: Monitors key price levels across multiple time periods for comprehensive market analysis.
- Clear breakout logic: Generates trading signals based on price breakouts with explicit trading rules.
- High automation: Automatically calculates price levels and executes trades, reducing manual intervention.
- Strong visualization: Displays price levels through different colored horizontal lines for intuitive analysis.
- High adaptability: Applicable to various trading instruments and time periods.
Strategy Risks
- False breakout risk: Market may generate false breakouts leading to incorrect signals.
- Volatility dependence: Strategy may underperform in low volatility environments.
- Insufficient risk control: Lacks dynamic stop-loss and profit-taking mechanisms.
- Market environment dependence: May generate frequent trades in ranging markets.
- Slippage impact: May face significant slippage in less liquid markets.
Strategy Optimization Directions
- Add technical indicator filters:
- Incorporate RSI for overbought/oversold filtering
- Use ATR for dynamic stop-loss placement
- Integrate ADX for trend strength confirmation
- Improve risk management:
- Implement dynamic stop-loss mechanisms
- Add trailing stop functionality
- Establish scaled profit-taking system
- Optimize signal confirmation:
- Add volume confirmation
- Include multi-timeframe trend confirmation
- Set up signal delay confirmation mechanism
Summary
This strategy captures market opportunities by monitoring and utilizing multiple key price levels, featuring clear logic and high automation. However, it also carries certain risks that need to be addressed through technical indicator filters and improved risk management mechanisms. The strategy's core advantage lies in its multi-dimensional price reference system, enabling better market trend capture, but practical application requires specific parameter adjustments based on different market conditions.
Source Pine Script
/*backtest
start: 2024-12-06 00:00:00
end: 2025-01-04 08:00:00
period: 1h
basePeriod: 1h
exchanges: [{"eid":"Futures_Binance","currency":"BTC_USDT"}]
*/

// This Pine Script™ code is subject to the terms of the Mozilla Public License 2.0 at https://mozilla.org/MPL/2.0/
// © tradingbauhaus

//@version=6
strategy("HOD/LOD/PMH/PML/PDH/PDL Strategy by tradingbauhaus ", shorttitle="HOD/LOD Strategy", overlay=true)

// Daily high and low
dailyhigh = request.security(syminfo.tickerid, 'D', high)
dailylow = request.security(syminfo.tickerid, 'D', low)

// Previous day high and low
var float previousdayhigh = na
var float previousdaylow = na
high1 = request.security(syminfo.tickerid, 'D', high[1])
low1 = request.security(syminfo.tickerid, 'D', low[1])
high0 = request.security(syminfo.tickerid, 'D', high[0])
low0 = request.security(syminfo.tickerid, 'D', low[0])

// Yesterday high and low
if (hour == 9 and minute > 30) or hour > 10
    previousdayhigh := high1
    previousdaylow := low1
else
    previousdayhigh := high0
    previousdaylow := low0

// Premarket high and low
t = time("1440", "0000-0930") // 1440 is the number of minutes in a whole day.
is_first = na(t[1]) and not na(t) or t[1] < t
ending_hour = 9
ending_minute = 30

var float pm_high = na
var float pm_low = na

if is_first and barstate.isnew and ((hour < ending_hour or hour >= 16) or (hour == ending_hour and minute < ending_minute))
    pm_high := high
    pm_low := low
else
    pm_high := pm_high[1]
    pm_low := pm_low[1]

if high > pm_high and ((hour < ending_hour or hour >= 16) or (hour == ending_hour and minute < ending_minute))
    pm_high := high

if low < pm_low and ((hour < ending_hour or hour >= 16) or (hour == ending_hour and minute < ending_minute))
    pm_low := low

// Plotting levels
plot(dailyhigh, style=plot.style_line, title="Daily high", color=color.white, linewidth=1, trackprice=true)
plot(dailylow, style=plot.style_line, title="Daily low", color=color.purple, linewidth=1, trackprice=true)
plot(previousdayhigh, style=plot.style_line, title="Previous Day high", color=color.orange, linewidth=1, trackprice=true)
plot(previousdaylow, style=plot.style_line, title="Previous Day low", color=color.blue, linewidth=1, trackprice=true)
plot(pm_high, style=plot.style_line, title="Premarket high", color=color.green, linewidth=1, trackprice=true)
plot(pm_low, style=plot.style_line, title="Premarket low", color=color.red, linewidth=1, trackprice=true)

// Strategy logic
// Long entry: Price crosses above PMH or PDH
if (ta.crossover(close, pm_high) or ta.crossover(close, previousdayhigh)) and strategy.opentrades == 0
    strategy.entry("Long", strategy.long)

// Short entry: Price crosses below PML or PDL
if (ta.crossunder(close, pm_low) or ta.crossunder(close, previousdaylow)) and strategy.opentrades == 0
    strategy.entry("Short", strategy.short)

// Exit long: Price reaches HOD
if strategy.position_size > 0 and ta.crossover(close, dailyhigh)
    strategy.close("Long")

// Exit short: Price reaches LOD
if strategy.position_size < 0 and ta.crossunder(close, dailylow)
strategy.close("Short")Published by ChaoZhang on the FMZ strategy square · last modified 2025-01-06. Collected in the Quant Trading Vault. Unvalidated research: re-test with your own data and costs before trusting it.
Build this with AgenKit
A spec is not a trading system. Paste this into your coding agent and AgenKit runs a specialist team — architecture, test-first build, risk gates, review — with paper trading on by default.
/agenkit build a production-grade trading bot with a backtest engine, risk controls and paper trading by default from strategies/Multi-Period-Price-Level-Breakout-Trend-Trading-System-Based-on-Key-Price-Levels.md- npx agenkit install engineering-kit in your project
- Paste the command into your agent and approve each phase
- Get tests, backtest, risk controls and a paper-trading switch
Understand it first
Before you run this, read the lesson behind the idea and how to backtest it honestly. Specs like this one are the survivors of an unknown number of trials; deflate their results accordingly.
Related specs
- Multi Filter Trend Breakthrough Smart Moving Average Trading StrategyPine Script · Breakout · 1h
- Multi Technical Indicator Dynamic Wave Trading StrategyPine Script · Breakout · 1h
- Multi Strategy Adaptive Trend Following and Breakout Trading SystemPine Script · Breakout · 1d
- Dynamic Range Breakout Trading Strategy Based on Bollinger Bands and RSIPine Script · Breakout · 1d
- Multi Dimensional Technical Indicator Fusion Trend Breakthrough StrategyPine Script · Breakout · 1h
- Multi Indicator Trend Following and Volatility Breakout StrategyPine Script · Breakout · 2h