Multi Period RSI Momentum and Triple EMA Trend Following Composite Strategy
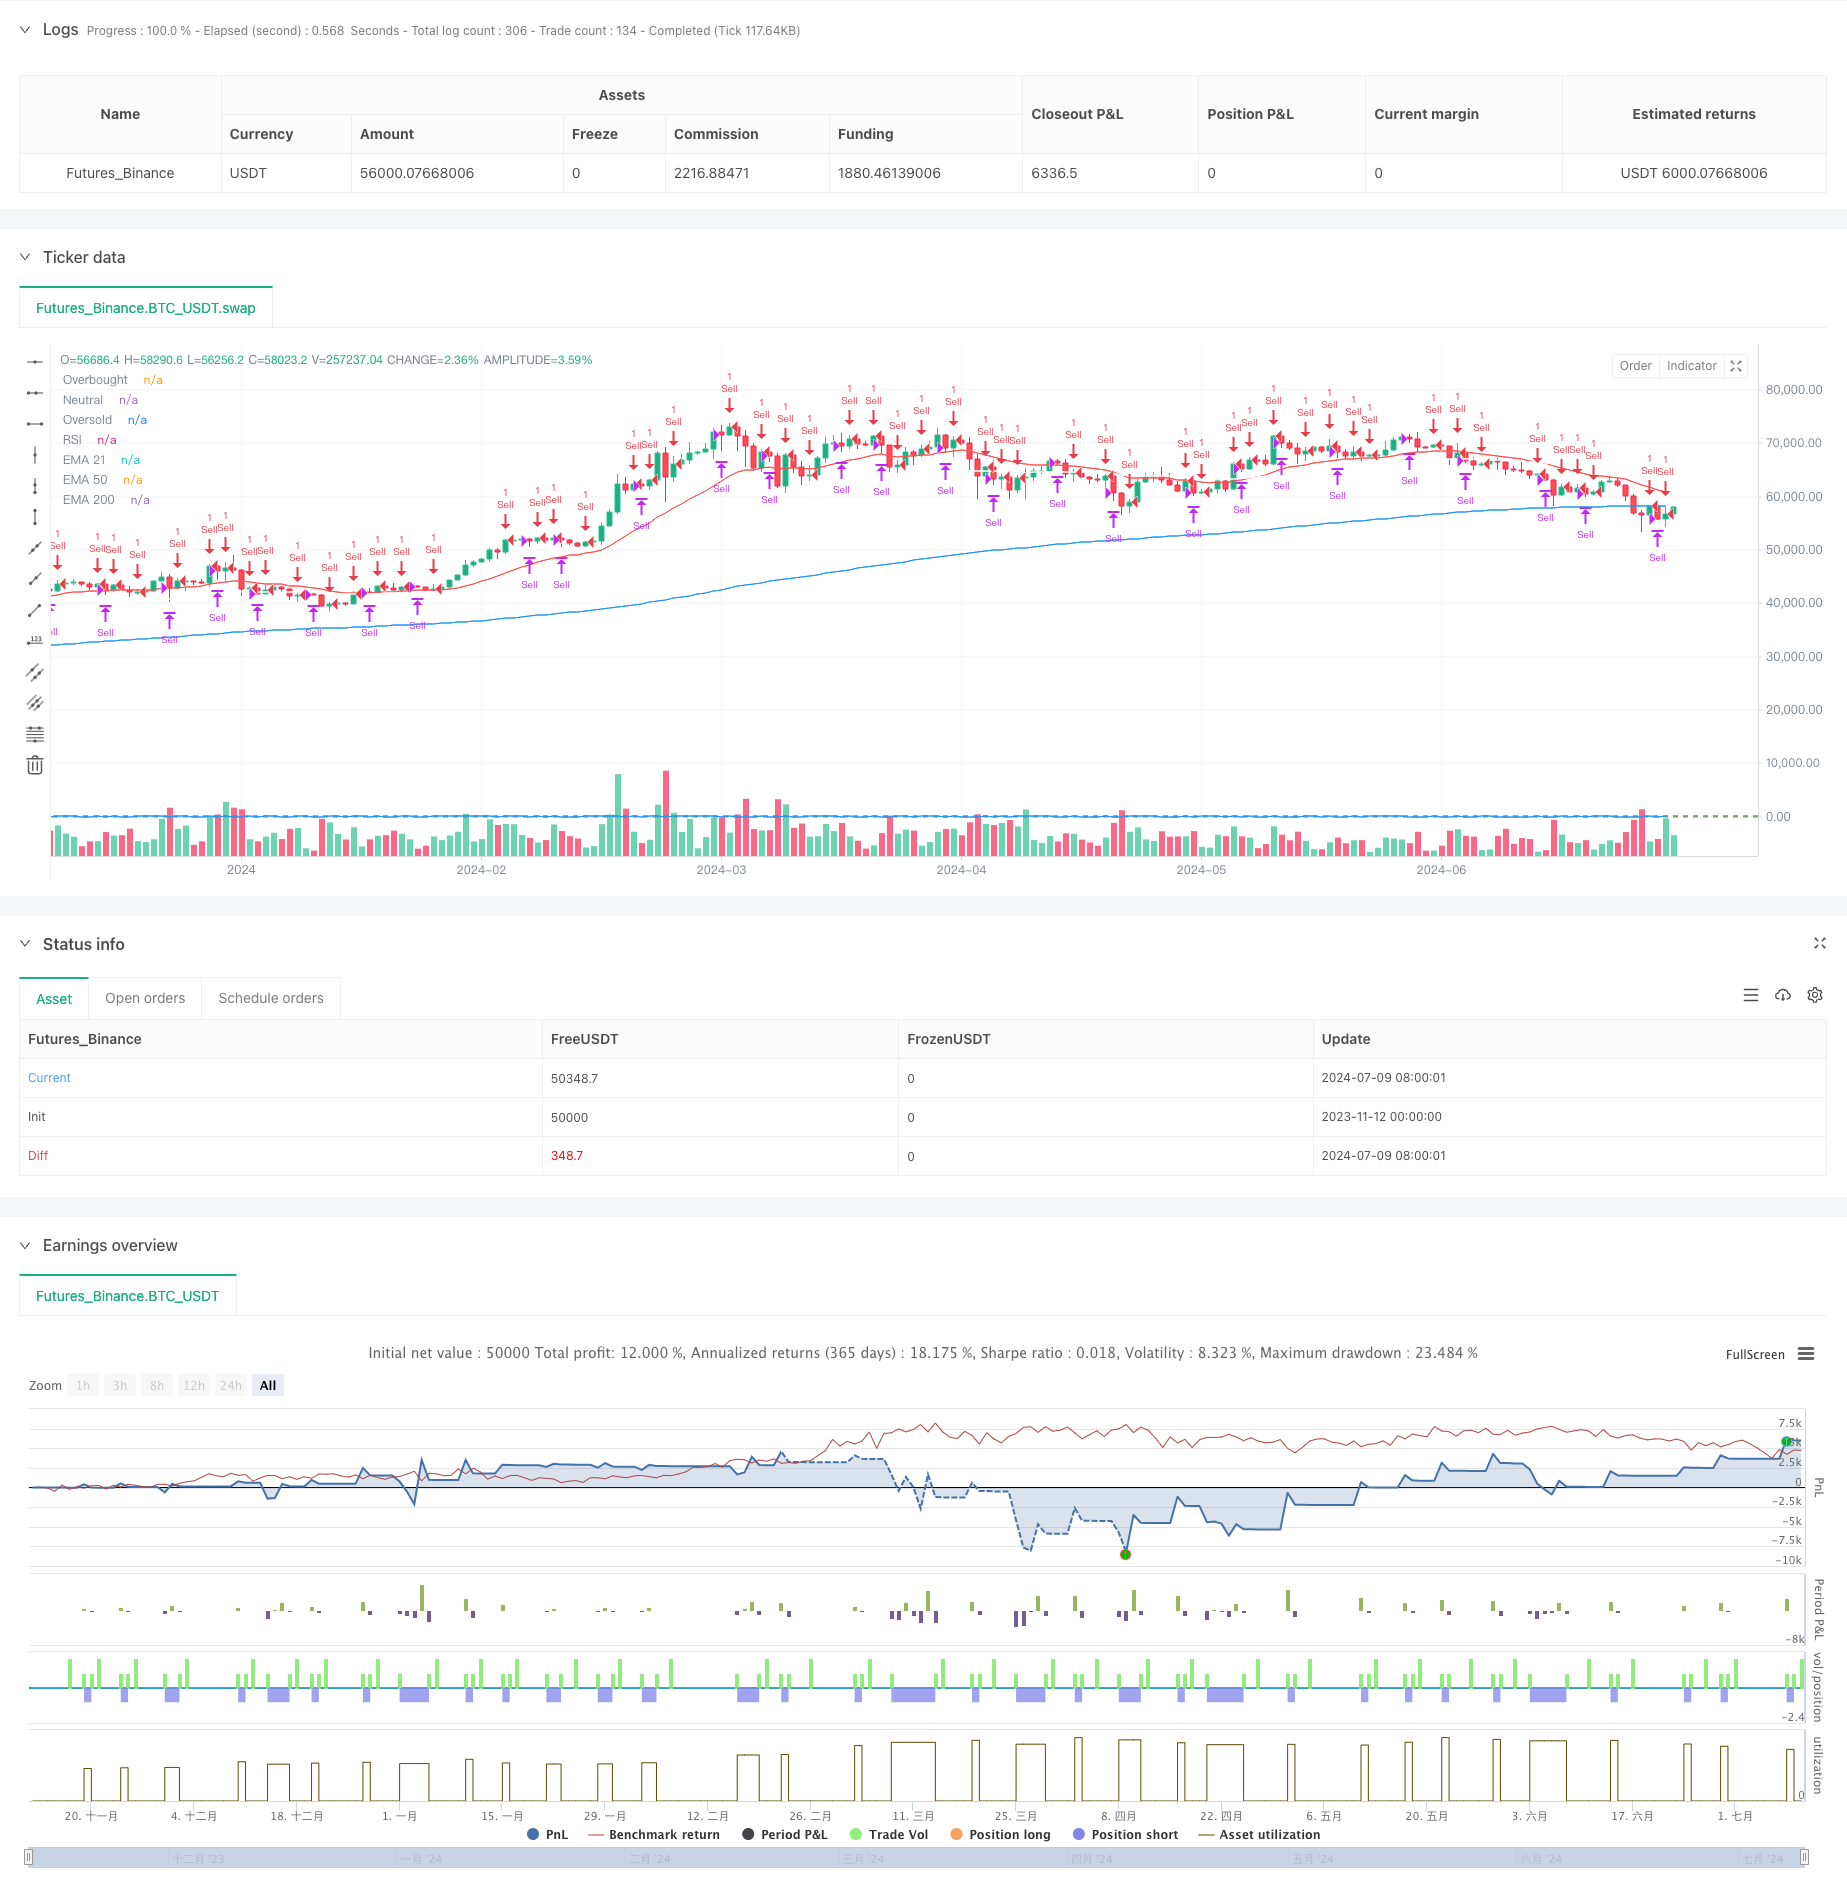
This strategy is a composite trading system that combines the momentum indicator RSI with the trend indicator EMA. Operating on both 1-minute and 5-minute timeframes, it makes trading decisions based on RSI…
Overview
This strategy is a composite trading system that combines the momentum indicator RSI with the trend indicator EMA. Operating on both 1-minute and 5-minute timeframes, it makes trading decisions based on RSI overbought/oversold signals and triple EMA trend determination. The strategy incorporates both trend following and mean reversion characteristics, enabling it to capture trading opportunities in different market environments.
Strategy Principles
The strategy uses 21/50/200-day triple EMA as trend judgment benchmark, combined with a modified RSI indicator (calculated using Chebyshev method) to identify market overbought/oversold conditions. On the 1-minute timeframe, it initiates short positions when RSI breaks above 94 and closes when it falls below 4, with breakeven stops set when RSI returns to 50. On the 5-minute timeframe, it initiates long positions when price rebounds after falling below the 200-day EMA, closing positions when RSI is overbought or breaks below the median. Position management variables inPositionLong and inPositionShort prevent repeated entries.
Strategy Advantages
- Multi-timeframe analysis enhances signal reliability
- Combines trend and momentum indicators for complementary benefits
- Implements breakeven stop-loss mechanism for risk control
- Uses improved RSI calculation method for more accurate signals
- Prevents duplicate trades through position management
- Adaptable to different market environments
Strategy Risks
- Frequent trading may incur high transaction costs
- May trigger frequent stops in volatile markets
- RSI indicator may generate false signals under certain market conditions
- Multi-period strategy may have lag in signal confirmation
- EMA crossover signals may be misleading in ranging markets
Optimization Directions
- Introduce volatility filters to adjust parameters during high volatility periods
- Add volume confirmation mechanism
- Optimize RSI thresholds with potential dynamic adjustment
- Include additional technical indicators for cross-validation
- Implement adaptive parameter mechanisms
- Develop more sophisticated stop-loss mechanisms
Summary
The strategy enhances trading stability and reliability through the combination of multiple technical indicators and multi-timeframe analysis. While certain risks exist, they can be effectively controlled through proper position management and stop-loss mechanisms. The strategy has significant optimization potential, and its performance can be further improved by introducing additional technical indicators and optimizing parameters.
Source Pine Script
/*backtest
start: 2023-11-12 00:00:00
end: 2024-07-10 00:00:00
period: 1d
basePeriod: 1d
exchanges: [{"eid":"Futures_Binance","currency":"BTC_USDT"}]
*/

//@version=5
strategy("Combined RSI Primed and 3 EMA Strategy", overlay=true)

// Input for EMA lengths
emaLength1 = input(21, title="EMA Length 1")
emaLength2 = input(50, title="EMA Length 2")
emaLength3 = input(200, title="EMA Length 3")

// Input for RSI settings
rsiLength = input(14, title="RSI Length")
rsiOverbought = input(94, title="RSI Overbought Level")
rsiNeutral = input(50, title="RSI Neutral Level")
rsiOversold = input(4, title="RSI Oversold Level")

// Calculate EMAs
ema1 = ta.ema(close, emaLength1)
ema2 = ta.ema(close, emaLength2)
ema3 = ta.ema(close, emaLength3)

// Calculate RSI using Chebyshev method from RSI Primed
rsi(source) =>
    up = math.max(ta.change(source), 0)
    down = -math.min(ta.change(source), 0)
    rs = up / down
    rsiValue = down == 0 ? 100 : 100 - (100 / (1 + rs))
    rsiValue

rsiValue = rsi(close)

// Plot EMAs
plot(ema1, color=color.red, title="EMA 21")
plot(ema2, color=color.white, title="EMA 50")
plot(ema3, color=color.blue, title="EMA 200")

// Plot RSI for visual reference
hline(rsiOverbought, "Overbought", color=color.red)
hline(rsiNeutral, "Neutral", color=color.gray)
hline(rsiOversold, "Oversold", color=color.green)
plot(rsiValue, color=color.blue, title="RSI")

// Trading logic with position management
var bool inPositionShort = false
var bool inPositionLong = false

// Trading logic for 1-minute timeframe
if (rsiValue > rsiOverbought and not inPositionShort)
    strategy.entry("Sell", strategy.short)
    inPositionShort := true

if (rsiValue < rsiOversold and inPositionShort)
    strategy.close("Sell")
    inPositionShort := false

if (ta.crossover(rsiValue, rsiNeutral) and inPositionShort)
    strategy.exit("Break Even", "Sell", stop=close)

// Trading logic for 5-minute timeframe
var float lastBearishClose = na

if (close < ema3 and close[1] >= ema3) // Check if the current close is below EMA200
    lastBearishClose := close

if (not na(lastBearishClose) and close > lastBearishClose and not inPositionLong)
    strategy.entry("Buy", strategy.long)
    inPositionLong := true

if (rsiValue > rsiOverbought and inPositionLong)
    strategy.close("Buy")
    inPositionLong := false

if (ta.crossunder(rsiValue, rsiNeutral) and inPositionLong)
    strategy.exit("Break Even", "Buy", stop=close)

lastBearishClose := na // Reset after trade executionPublished by ChaoZhang on the FMZ strategy square · last modified 2024-11-12. Collected in the Quant Trading Vault. Unvalidated research: re-test with your own data and costs before trusting it.
Build this with AgenKit
A spec is not a trading system. Paste this into your coding agent and AgenKit runs a specialist team — architecture, test-first build, risk gates, review — with paper trading on by default.
/agenkit build a production-grade trading bot with a backtest engine, risk controls and paper trading by default from strategies/Multi-Period-RSI-Momentum-and-Triple-EMA-Trend-Following-Composite-Strategy.md- npx agenkit install engineering-kit in your project
- Paste the command into your agent and approve each phase
- Get tests, backtest, risk controls and a paper-trading switch
Understand it first
Before you run this, read the lesson behind the idea and how to backtest it honestly. Specs like this one are the survivors of an unknown number of trials; deflate their results accordingly.
Related specs
- Cross Period Momentum EMA Strategy with RSI and Dynamic ATR Stop LossPine Script · Momentum · 1d
- KST EMA Momentum Trend Following StrategyPine Script · Momentum · 1d
- Multi EMA Trend Momentum Trading Strategy with Risk Management SystemPine Script · Momentum · 1h
- Multi Indicator Trend Momentum Trading Strategy with Dynamic Risk Management SystemPine Script · Momentum · 1h
- Multi Momentum Indicator Trend Tracking Quantitative Trading StrategyPine Script · Momentum · 1d
- Multi Technical Indicator Based Trend Following and Momentum StrategyPine Script · Momentum · 1d