Strategy vault / Mean reversion
Multi Period Technical Analysis and Market Sentiment Trading Strategy
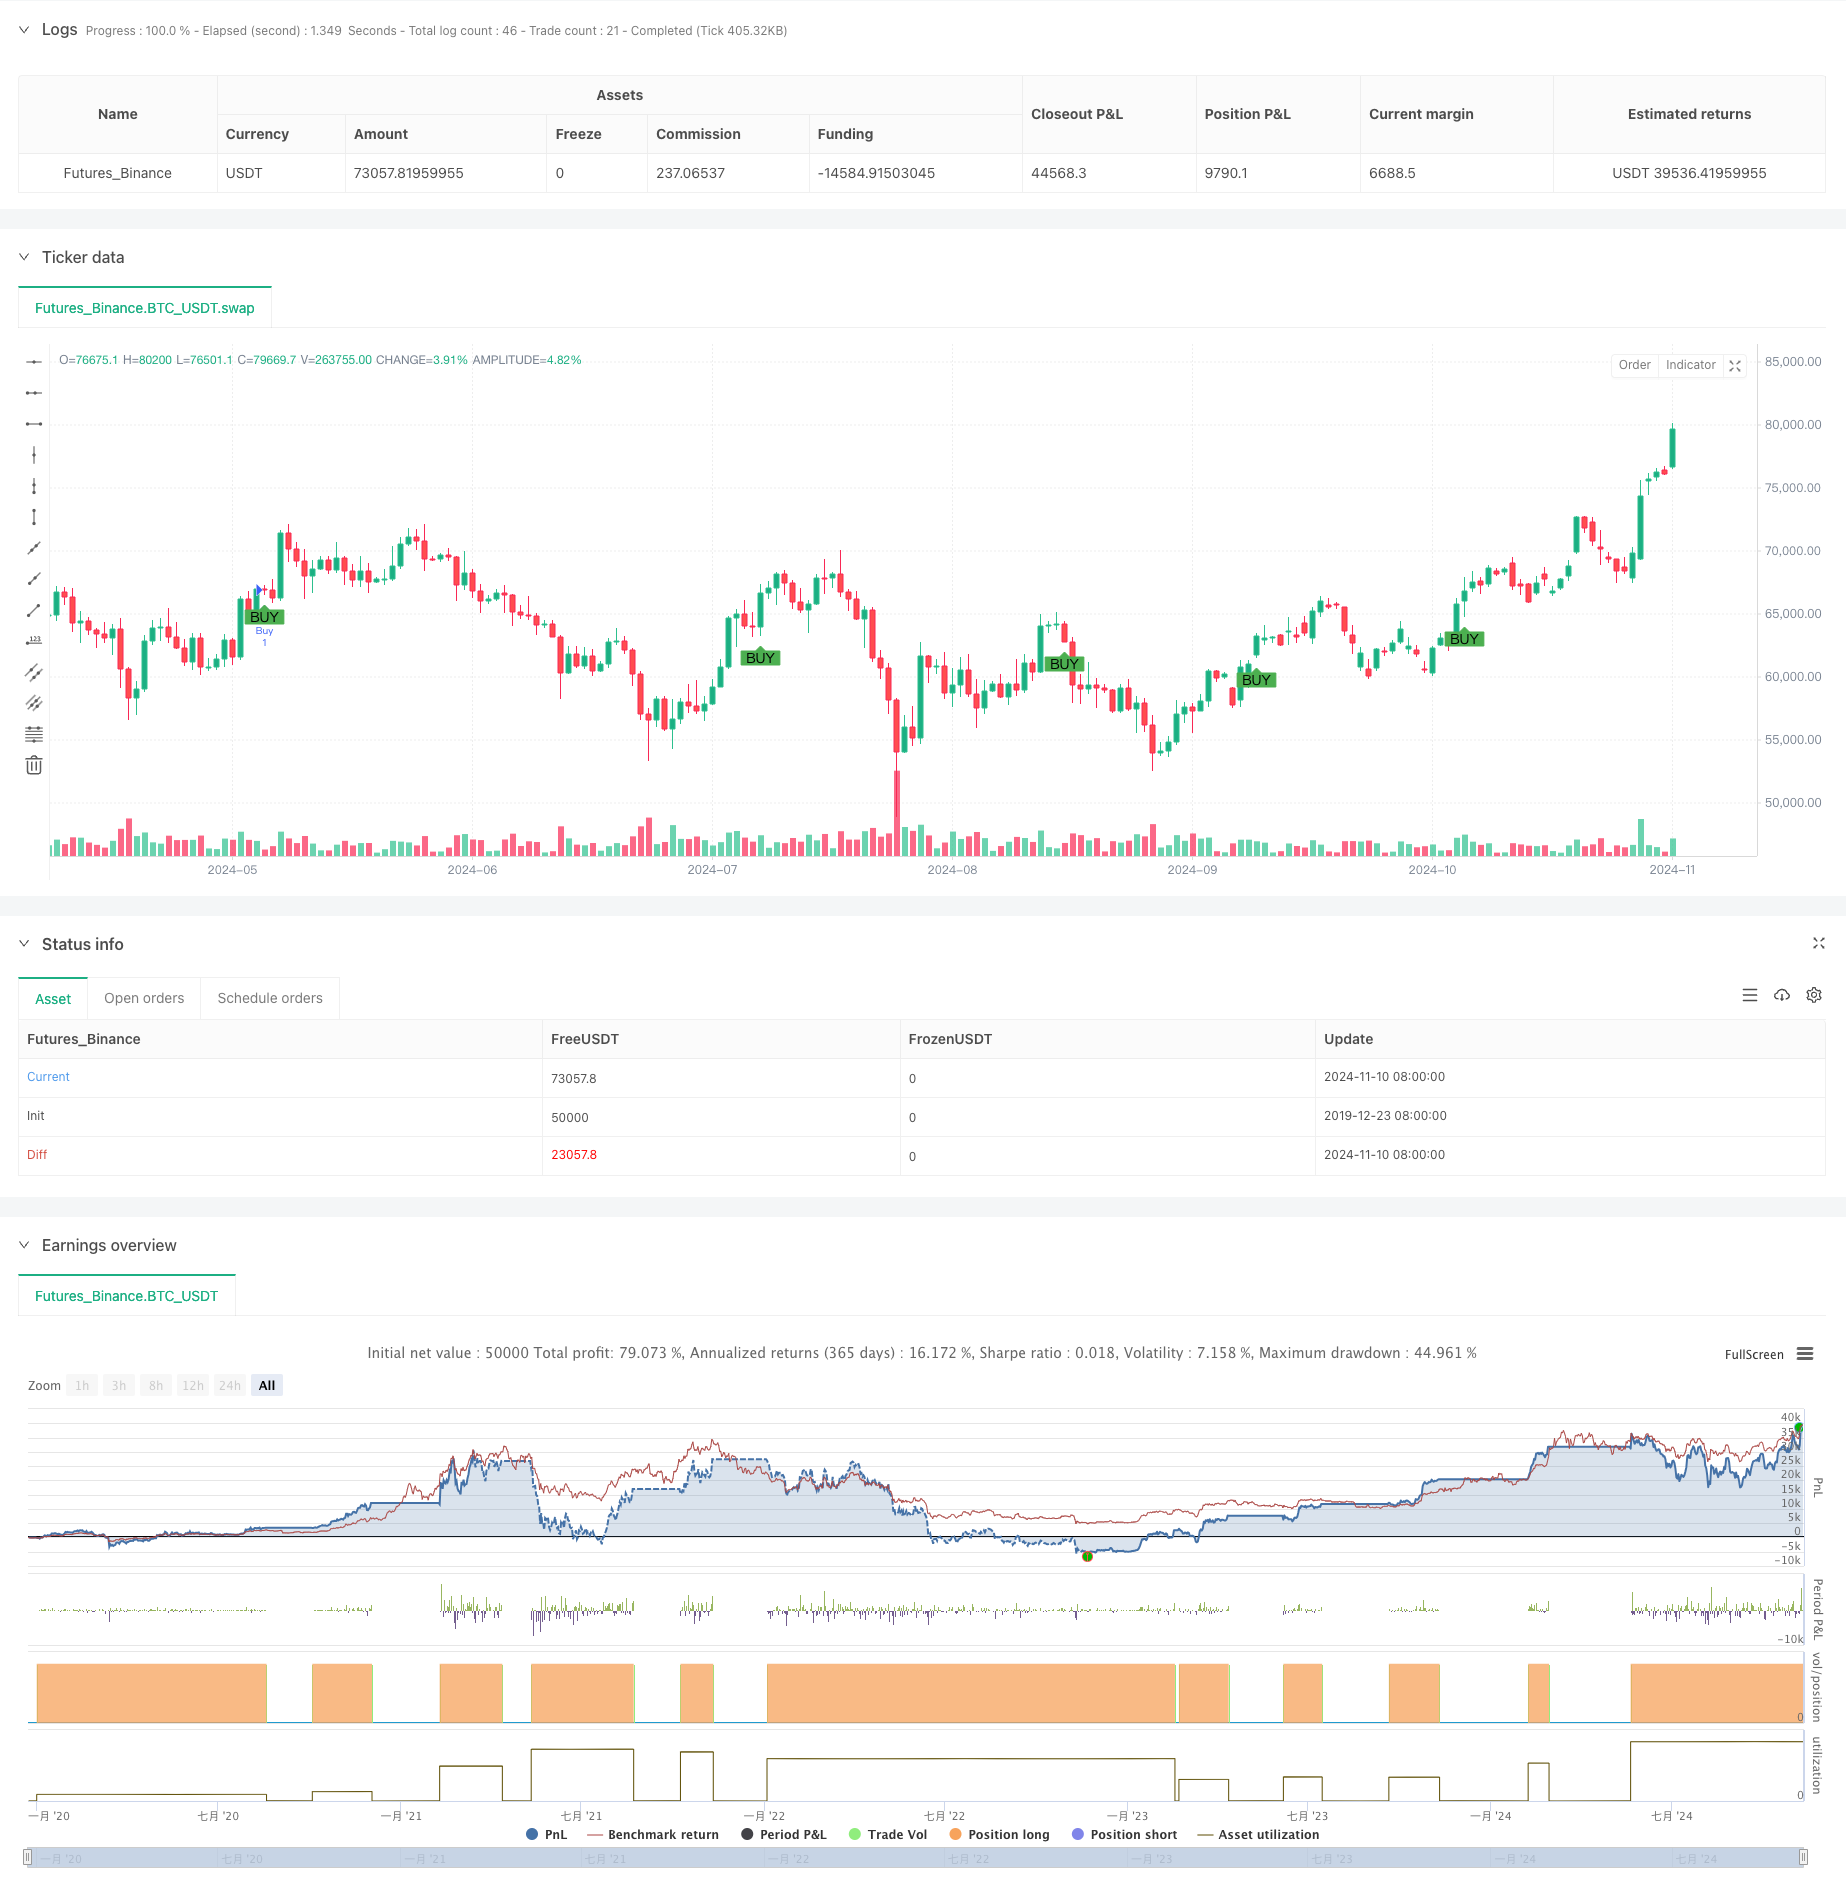
This strategy is a comprehensive trading system that combines multiple technical indicators and market sentiment. The core strategy utilizes the crossover signals of short-term and long-term Simple Moving Averages…
Overview
This strategy is a comprehensive trading system that combines multiple technical indicators and market sentiment. The core strategy utilizes the crossover signals of short-term and long-term Simple Moving Averages (SMA), combined with MACD indicator for trend confirmation. Additionally, the strategy integrates market sentiment indicators (RSI) and chart pattern recognition systems, including double top/bottom and head and shoulders patterns. The strategy is specifically designed to execute during certain trading sessions to improve efficiency and success rate.
Strategy Principles
The strategy operates based on the following core components:
- Multi-period moving average system: Using 10-period and 30-period SMAs for trend identification
- MACD indicator: Using standard parameters (12,26,9) for trend confirmation
- Market sentiment monitoring: Using RSI indicator for overbought/oversold conditions
- Chart pattern recognition: Including automatic identification of double top/bottom and head and shoulders patterns
- Time filtering: Focusing on specific trading sessions
- Resistance level identification: Using 20-period lookback to determine major resistance levels
Buy conditions require: Being within the target trading session, short-term SMA crossing above long-term SMA, and MACD showing bullish signals. Sell conditions require: Price reaching major resistance levels and MACD showing bearish signals.
Strategy Advantages
- Multi-dimensional signal confirmation: Combining technical indicators and chart patterns improves signal reliability
- Comprehensive risk management: Includes RSI-based early exit mechanisms
- Market sentiment integration: Uses RSI indicator for market sentiment judgment to avoid excessive trading
- Automated pattern recognition: Reduces bias from subjective judgment
- Time filtering: Focuses on high market activity periods for improved efficiency
Strategy Risks
- Parameter sensitivity: Multiple technical indicator parameters may affect strategy performance
- Lag risk: Moving averages and MACD have inherent lag
- Pattern recognition accuracy: Automated recognition systems may produce false signals
- Market environment dependency: May generate frequent false signals in ranging markets
- Time limitations: Trading only during specific sessions may miss opportunities in other periods
Optimization Directions
- Parameter adaptation: Introduce adaptive parameter adjustment mechanisms based on market volatility
- Signal weighting system: Establish a weighting system for various indicator signals to improve decision accuracy
- Stop-loss optimization: Add dynamic stop-loss mechanisms to enhance risk control
- Pattern recognition enhancement: Incorporate machine learning algorithms to improve chart pattern recognition accuracy
- Backtest period extension: Conduct testing across different market cycles to verify strategy stability
Summary
This is a comprehensive trading strategy that establishes a relatively complete trading system through the combination of multiple technical indicators and market sentiment. The strategy's strengths lie in its multi-dimensional signal confirmation and comprehensive risk management mechanisms, though it faces challenges in parameter sensitivity and pattern recognition accuracy. Through continuous optimization and improvement, particularly in parameter adaptation and machine learning applications, the strategy has the potential for enhanced performance.
Source Pine Script
/*backtest
start: 2019-12-23 08:00:00
end: 2024-11-11 00:00:00
period: 1d
basePeriod: 1d
exchanges: [{"eid":"Futures_Binance","currency":"BTC_USDT"}]
*/

//@version=5
strategy("XAUUSD SMA with MACD & Market Sentiment + Chart Patterns", overlay=true)

// Input parameters for moving averages
shortSMA_length = input.int(10, title="Short SMA Length", minval=1)
longSMA_length = input.int(30, title="Long SMA Length", minval=1)

// MACD settings
[macdLine, signalLine, _] = ta.macd(close, 12, 26, 9)

// Lookback period for identifying major resistance (swing highs)
resistance_lookback = input.int(20, title="Resistance Lookback Period", tooltip="Lookback period for identifying major resistance")

// Calculate significant resistance (local swing highs over the lookback period)
major_resistance = ta.highest(close, resistance_lookback)

// Calculate SMAs
shortSMA = ta.sma(close, shortSMA_length)
longSMA = ta.sma(close, longSMA_length)

// RSI for market sentiment
rsiLength = input.int(14, title="RSI Length", minval=1)
rsiOverbought = input.int(70, title="RSI Overbought Level", minval=50, maxval=100)
rsiOversold = input.int(30, title="RSI Oversold Level", minval=0, maxval=50)
rsi = ta.rsi(close, rsiLength)

// Time filtering: only trade during New York session (12:00 PM - 9:00 PM UTC)
isNewYorkSession = true

// Define buy condition based on SMA, MACD, and New York session
buyCondition = isNewYorkSession and ta.crossover(shortSMA, longSMA) and macdLine > signalLine

// Define sell condition: only sell if price is at or above the identified major resistance during New York session
sellCondition = isNewYorkSession and close >= major_resistance and macdLine < signalLine

// Define sentiment-based exit conditions
closeEarlyCondition = strategy.position_size < 0 and rsi > rsiOverbought  // Close losing trade early if RSI is overbought
holdWinningCondition = strategy.position_size > 0 and rsi < rsiOversold   // Hold winning trade if RSI is oversold

// ------ Chart Patterns ------ //

// Double Top/Bottom Pattern Detection
doubleTop = ta.highest(close, 50) == close[25] and ta.highest(close, 50) == close[0] // Approximate double top: two peaks
doubleBottom = ta.lowest(close, 50) == close[25] and ta.lowest(close, 50) == close[0] // Approximate double bottom: two troughs

// Head and Shoulders Pattern Detection
shoulder1 = ta.highest(close, 20)[40]
head = ta.highest(close, 20)[20]
shoulder2 = ta.highest(close, 20)[0]
isHeadAndShoulders = shoulder1 < head and shoulder2 < head and shoulder1 == shoulder2

// Pattern-based signals
patternBuyCondition = isNewYorkSession and doubleBottom and rsi < rsiOversold  // Buy at double bottom in oversold conditions
patternSellCondition = isNewYorkSession and (doubleTop or isHeadAndShoulders) and rsi > rsiOverbought // Sell at double top or head & shoulders in overbought conditions

// Execute strategy: Enter long position when buy conditions are met
if (buyCondition or patternBuyCondition)
    strategy.entry("Buy", strategy.long)

// Close the position when the sell condition is met (price at resistance or pattern sell)
if (sellCondition or patternSellCondition and not holdWinningCondition)
    strategy.close("Buy")

// Close losing trades early if sentiment is against us
if (closeEarlyCondition)
    strategy.close("Buy")

// Visual cues for buy and sell signals
plotshape(series=buyCondition or patternBuyCondition, title="Buy Signal", location=location.belowbar, color=color.green, style=shape.labelup, text="BUY")
plotshape(series=sellCondition or patternSellCondition, title="Sell Signal", location=location.abovebar, color=color.red, style=shape.labeldown, text="SELL")

// ------ Alerts for Patterns ------ //

// Add alert for pattern-based buy condition
alertcondition(patternBuyCondition, title="Pattern Buy Signal Activated", message="Double Bottom or Pattern Buy signal activated: Conditions met.")

// Add alert for pattern-based sell condition
alertcondition(patternSellCondition, title="Pattern Sell Signal Activated", message="Double Top or Head & Shoulders detected. Sell signal triggered.")

// Existing alerts for SMA/MACD-based conditions
alertcondition(buyCondition, title="Buy Signal Activated", message="Buy signal activated: Short SMA has crossed above Long SMA and MACD is bullish.")
alertcondition(sellCondition, title="Sell at Major Resistance", message="Sell triggered at major resistance level.")
alertcondition(closeEarlyCondition, title="Close Losing Trade Early", message="Sentiment is against your position, close trade.")
alertcondition(holdWinningCondition, title="Hold Winning Trade", message="RSI indicates oversold conditions, holding winning trade.")
Published by ChaoZhang on the FMZ strategy square · last modified 2024-11-12. Collected in the Quant Trading Vault. Unvalidated research: re-test with your own data and costs before trusting it.
Build this with AgenKit
A spec is not a trading system. Paste this into your coding agent and AgenKit runs a specialist team — architecture, test-first build, risk gates, review — with paper trading on by default.
/agenkit build a production-grade trading bot with a backtest engine, risk controls and paper trading by default from strategies/Multi-Period-Technical-Analysis-and-Market-Sentiment-Trading-Strategy.md- npx agenkit install engineering-kit in your project
- Paste the command into your agent and approve each phase
- Get tests, backtest, risk controls and a paper-trading switch
Understand it first
Before you run this, read the lesson behind the idea and how to backtest it honestly. Specs like this one are the survivors of an unknown number of trials; deflate their results accordingly.
Related specs
- Advanced 15 Minute Chart Trading Signal StrategyPine Script · Mean reversion · 3h
- BONK Multi Factor Trading StrategyPine Script · Mean reversion · 1d
- Customizable Non Repainting HTF MACD MFI Scalable Bot StrategyPine Script · Mean reversion · 1d
- Dynamic Adaptive Multi Timeframe Trend Following and Range Reversal Hybrid StrategyPine Script · Mean reversion · 2d
- MACD Cross Period Trading StrategyPine Script · Mean reversion · 1d
- MACD Long Reversal StrategyPine Script · Mean reversion · 1d