Multi Period Technical Indicator Dynamic Trading System Strategy
This strategy is a comprehensive trading system that combines multiple technical indicators, primarily utilizing Moving Average (MA), Relative Strength Index (RSI), and Average Directional Index (ADX) to identify…
Overview
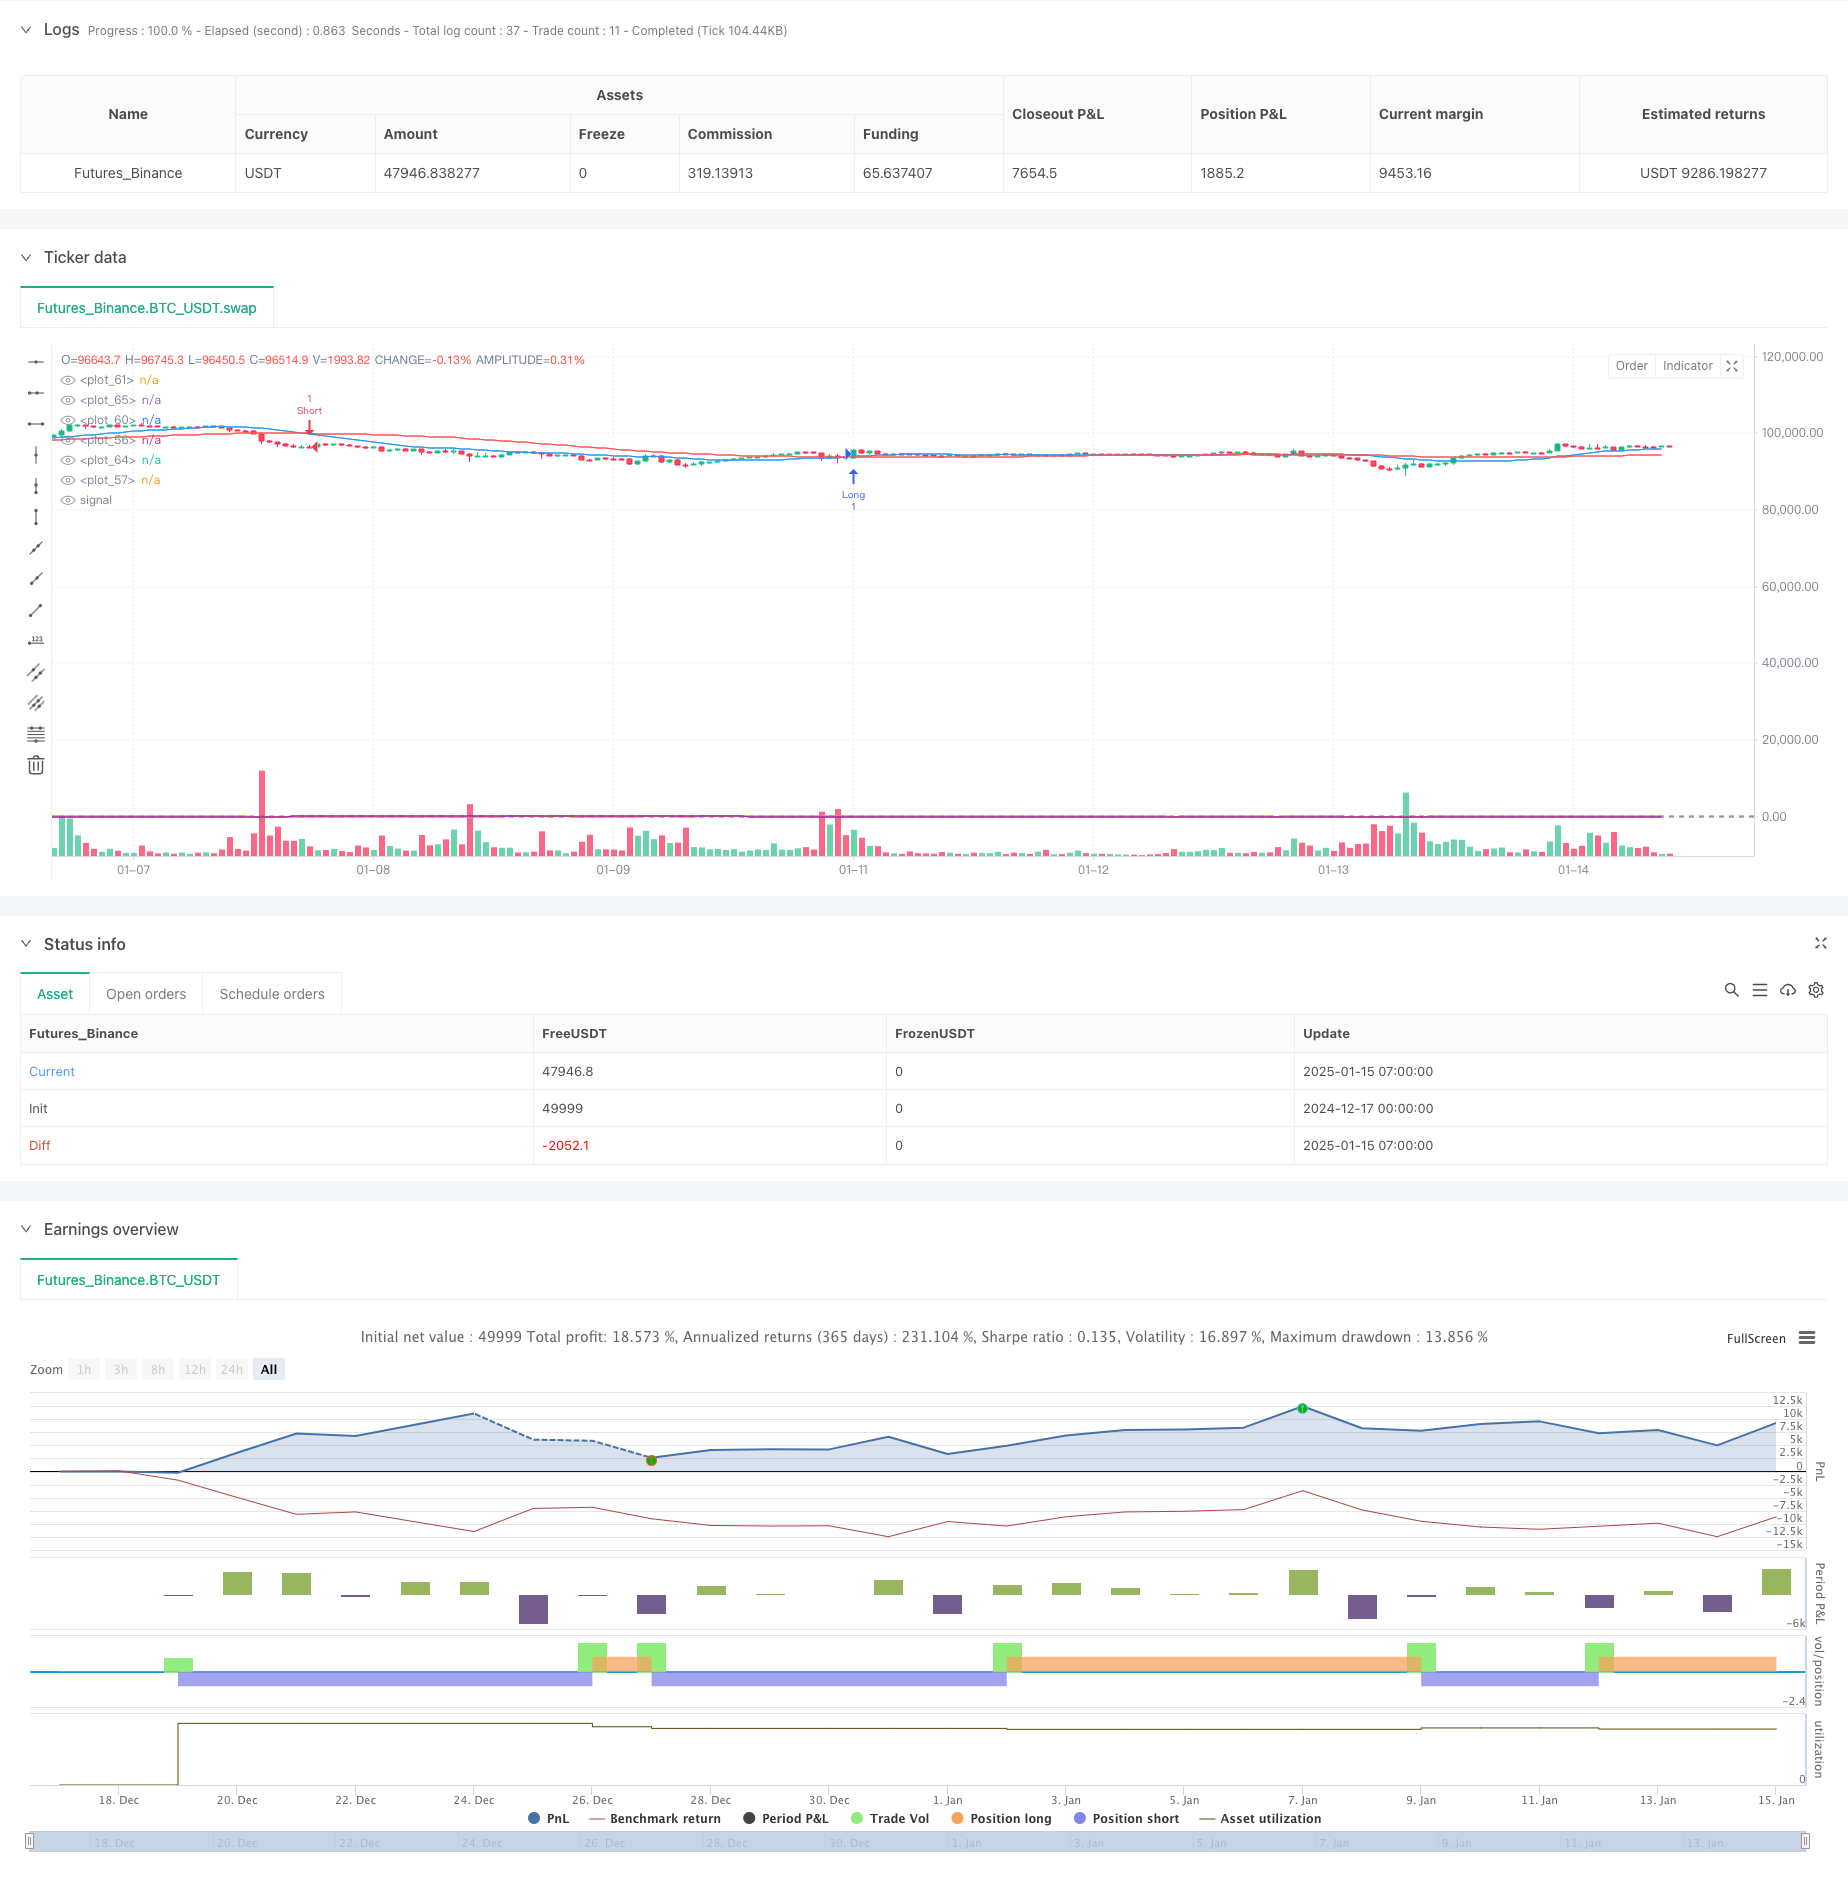
This strategy is a comprehensive trading system that combines multiple technical indicators, primarily utilizing Moving Average (MA), Relative Strength Index (RSI), and Average Directional Index (ADX) to identify market trends and momentum. It uses the Average True Range (ATR) to dynamically set stop-loss and take-profit levels. The system employs a multi-period analysis approach, confirming trading signals through indicator crossovers across different time periods, ensuring both trading accuracy and effective risk control.
Strategy Principles
The strategy employs a three-layer verification mechanism to confirm trading signals:
- Trend Identification Layer: Uses crossovers of 20-period and 50-period moving averages to determine trend direction, with fast MA crossing above slow MA indicating an uptrend and vice versa.
- Momentum Confirmation Layer: Uses 14-period RSI to confirm price momentum, with RSI above 50 indicating upward momentum and below 50 indicating downward momentum.
- Trend Strength Filter Layer: Uses 14-period ADX to measure trend strength, only confirming trades when ADX is above 25, indicating sufficient trend strength.
Additionally, the strategy implements an ATR-based dynamic stop-loss and take-profit system:
- Stop-loss is set at 2 times ATR
- Take-profit is set at 4 times ATR, maintaining a 1:2 risk-reward ratio
Strategy Advantages
- Multiple Confirmation Mechanism: Validates signals through three different technical indicators, significantly reducing the impact of false signals.
- Dynamic Risk Management: ATR-based dynamic stop-loss and take-profit settings adapt to market volatility, avoiding unreasonable risks from fixed levels.
- Strong Trend Following: Effectively captures major trend movements through MA system and ADX confirmation.
- Clear Operational Standards: Key points such as entry, stop-loss, and take-profit have clear quantitative standards, reducing interference from subjective judgment.
Strategy Risks
- Sideways Market Risk: Frequent MA crossovers in ranging markets may increase false signals.
- Lag Risk: Technical indicators have inherent lag, potentially missing optimal entry points during volatile movements.
- Parameter Sensitivity: Strategy performance is sensitive to parameter settings, requiring adjustment in different market environments.
- Systemic Risk: Technical indicators may fail under sudden major market events.
Strategy Optimization Directions
- Volume Indicator Integration: Consider adding volume indicators to help validate trend validity.
- Parameter Adaptation: Develop adaptive parameter systems that dynamically adjust indicator parameters based on market conditions.
- Market Sentiment Integration: Incorporate market sentiment indicators like VIX to adjust positions or pause trading during high volatility periods.
- Enhanced Stop-Loss Mechanism: Consider adding trailing stop-loss functionality for better profit protection.
Summary
This strategy constructs a relatively complete trading system through the synergy of multiple technical indicators. Its core strengths lie in its multi-layer verification mechanism and dynamic risk management system, though attention must be paid to its adaptability in different market environments. Through continuous optimization and improvement, this strategy shows promise for achieving stable returns in actual trading.
Source Pine Script
/*backtest
start: 2024-12-17 00:00:00
end: 2025-01-15 08:00:00
period: 1h
basePeriod: 1h
exchanges: [{"eid":"Futures_Binance","currency":"BTC_USDT","balance":49999}]
*/

//@version=6
strategy("Daily Trading Strategy", overlay=true)

// --- Indikator ---
// Kombinasi MA untuk trend
fastMA = ta.sma(close, 20)
slowMA = ta.sma(close, 50)

// RSI untuk momentum
rsi = ta.rsi(close, 14)

// --- Fungsi untuk menghitung ADX ---
adx(length) =>
    up = ta.change(high)
    down = -ta.change(low)
    plusDM = na(up) ? na : (up > down and up > 0 ? up : 0)
    minusDM = na(down) ? na : (down > up and down > 0 ? down : 0)
    trur = ta.rma(ta.tr, length)
    plus = fixnan(100 * ta.rma(plusDM, length) / trur)
    minus = fixnan(100 * ta.rma(minusDM, length) / trur)
    sum = plus + minus
    adx = 100 * ta.rma(math.abs(plus - minus) / (sum == 0 ? 1 : sum), length)

// ADX untuk kekuatan trend
adxValue = adx(14)

// --- Kondisi Entry Long ---
longEntry = ta.crossover(fastMA, slowMA) and rsi > 50 and adxValue > 25

// --- Kondisi Entry Short ---
shortEntry = ta.crossunder(fastMA, slowMA) and rsi < 50 and adxValue > 25

// --- Stop Loss dan Take Profit ---
// Fungsi untuk menghitung stop loss dan take profit
getSLTP(entryPrice, isLong) =>
    atr = ta.atr(14)
    sl = isLong ? entryPrice - atr * 2 : entryPrice + atr * 2
    tp = isLong ? entryPrice + atr * 4 : entryPrice - atr * 4
    [sl, tp]

// Hitung SL dan TP untuk posisi Long
[longSL, longTP] = getSLTP(close, true)

// Hitung SL dan TP untuk posisi Short
[shortSL, shortTP] = getSLTP(close, false)

// --- Eksekusi Order ---
if (longEntry)
    strategy.entry("Long", strategy.long, stop=longSL, limit=longTP)

if (shortEntry)
    strategy.entry("Short", strategy.short, stop=shortSL, limit=shortTP)

// --- Plot Indikator ---
// MA
plot(fastMA, color=color.blue)
plot(slowMA, color=color.red)

// RSI
plot(rsi, color=color.orange)
hline(50, color=color.gray)

// ADX
plot(adxValue, color=color.purple)
hline(25, color=color.gray)

// --- Alert ---
alertcondition(longEntry, title="Long Entry", message="Long Entry")
alertcondition(shortEntry, title="Short Entry", message="Short Entry")Published by ChaoZhang on the FMZ strategy square · last modified 2025-01-17. Collected in the Quant Trading Vault. Unvalidated research: re-test with your own data and costs before trusting it.
Build this with AgenKit
A spec is not a trading system. Paste this into your coding agent and AgenKit runs a specialist team — architecture, test-first build, risk gates, review — with paper trading on by default.
/agenkit build a production-grade trading bot with a backtest engine, risk controls and paper trading by default from strategies/Multi-Period-Technical-Indicator-Dynamic-Trading-System-Strategy.md- npx agenkit install engineering-kit in your project
- Paste the command into your agent and approve each phase
- Get tests, backtest, risk controls and a paper-trading switch
Understand it first
Before you run this, read the lesson behind the idea and how to backtest it honestly. Specs like this one are the survivors of an unknown number of trials; deflate their results accordingly.
Related specs
- Momentum Trading Strategy Based on Multi factor ModelPine Script · Momentum · 1d
- Multi Indicator Comprehensive Analysis Quantitative Trading Strategy Trend Momentum and Volatility Collaborative Prediction ModelPine Script · Momentum · 3m
- Multi Period Moving Average and RSI Momentum Cross StrategyPine Script · Momentum · 1d
- Multi Indicator Adaptive Momentum Crossover Trading SystemPine Script · Momentum · 1h
- Multi Indicator Dynamic Stop Loss Momentum Trend Trading StrategyPine Script · Momentum · 1h
- Multi Indicator Trend Momentum ATR Target Trading StrategyPine Script · Momentum · 1d