Strategy vault / Trend following
Multi Period Trend Confirmation Dynamic Risk Control Quantitative Trading Strategy
This strategy is a quantitative trading system based on multi-period trend confirmation and dynamic risk control. It integrates multiple technical indicators including VWAP, EMA, and RSI, using period resonance…
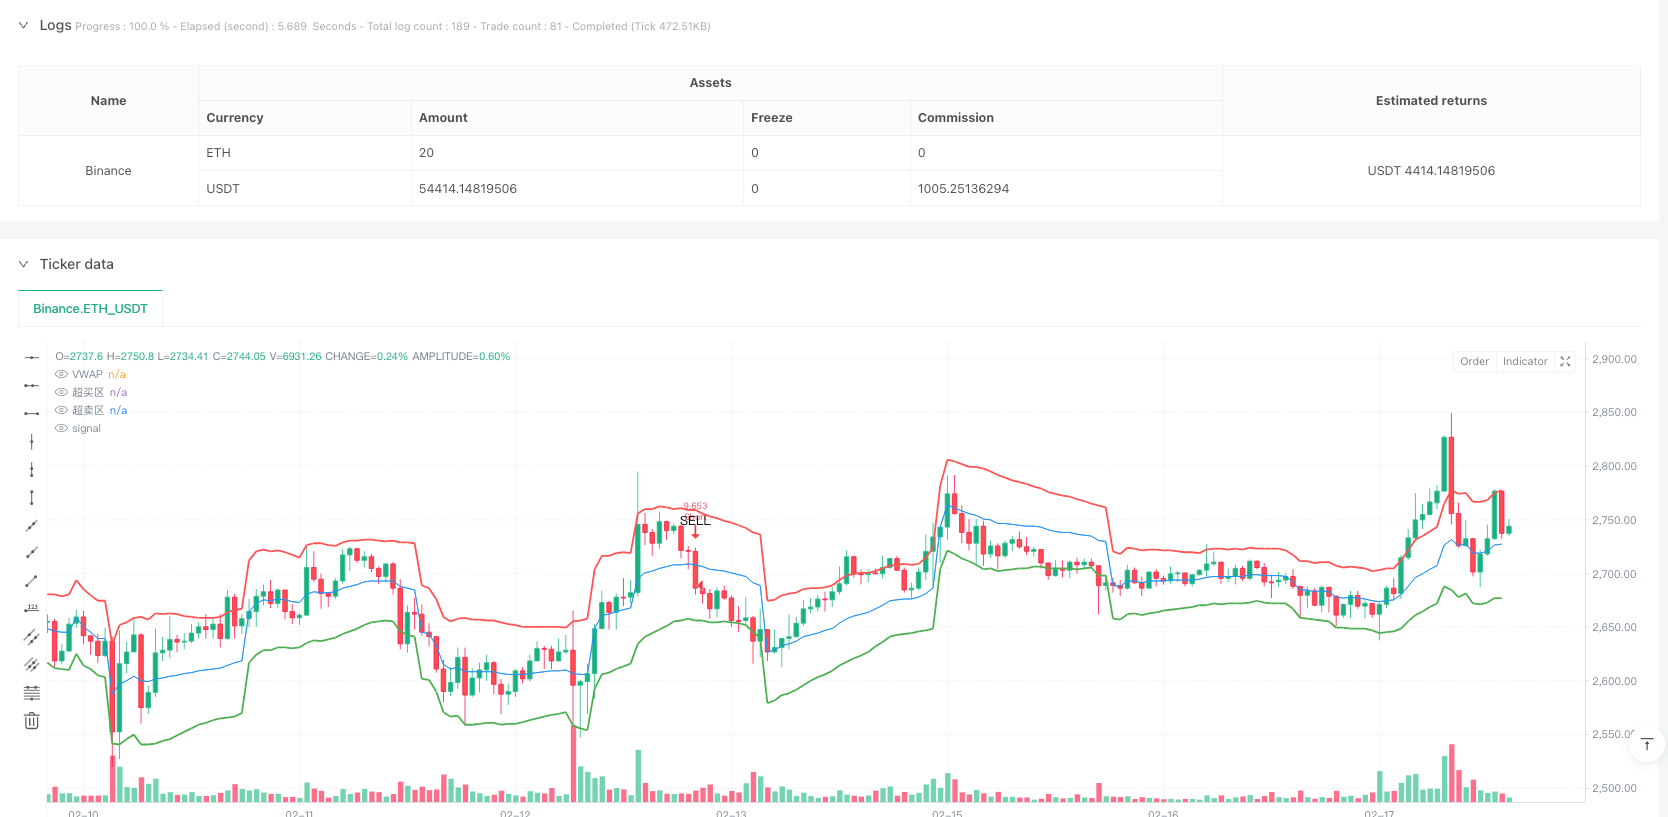
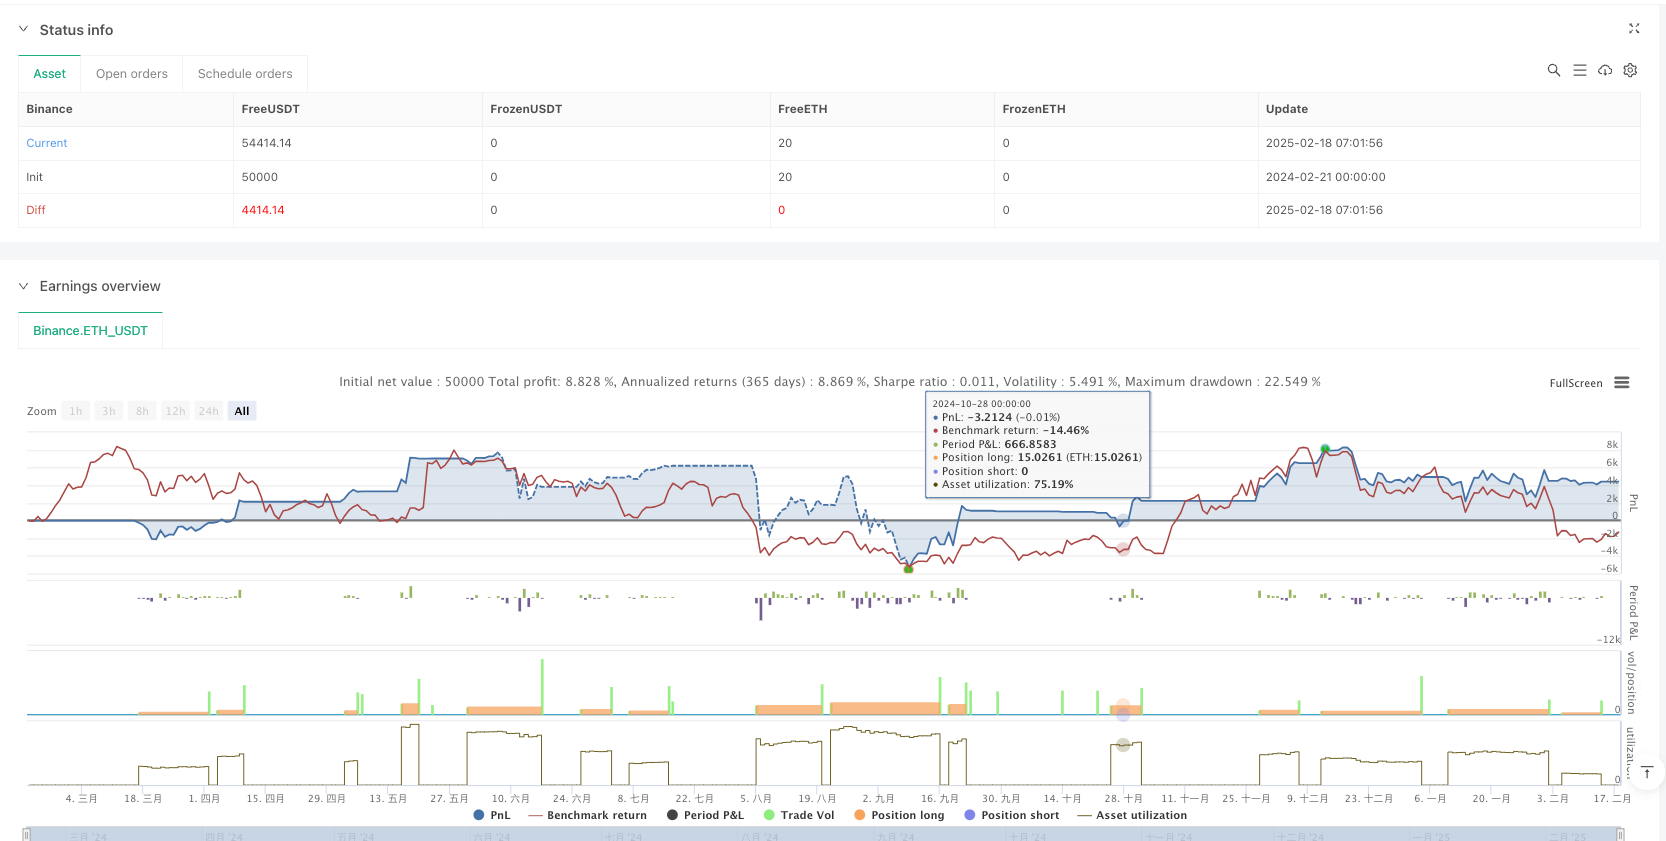
Overview
This strategy is a quantitative trading system based on multi-period trend confirmation and dynamic risk control. It integrates multiple technical indicators including VWAP, EMA, and RSI, using period resonance between daily and 4-hour timeframes to confirm trend direction, combined with volume analysis and dynamic risk management to create a complete trading decision framework.
Strategy Principle
The strategy adopts a top-down analytical framework, first determining the main trend direction at the daily level using EMA20 and ADX(14). A bullish trend is confirmed when ADX is above 25 and price is above EMA20; conversely for bearish trends. After establishing the main trend direction, the strategy shifts to the 4-hour timeframe to seek specific entry opportunities. Entry signals are comprehensively judged based on price relationship with VWAP, RSI movements, and volume changes. Additionally, the strategy incorporates a comprehensive risk management mechanism, including ATR-based dynamic stop-loss, Fibonacci-based staged profit-taking, and an account equity-based position control system.
Strategy Advantages
- Multi-period resonance analysis improves signal reliability and effectively reduces false signal interference
- Dynamic price channel constructed by combining VWAP and ATR provides more adaptive support and resistance judgment
- Innovative application of volume standard deviation enables more accurate trend strength judgment
- Comprehensive risk management system, including dynamic stop-loss, staged profit-taking, and precise position control
- Integration of LSTM model for volatility prediction enhances strategy predictive capabilities
Strategy Risks
- Multiple indicator overlay may lead to signal lag, potentially missing ideal entry points in rapid market movements
- Parameter optimization faces overfitting risk, requiring thorough testing across different market environments
- LSTM model predictions carry uncertainty, requiring continuous monitoring and adjustment
- High-frequency trading may incur significant transaction costs
- Market sudden events may cause stop-loss failure, requiring additional risk control measures
Strategy Optimization Directions
- Develop adaptive parameter system to dynamically adjust indicator parameters based on market environment
- Add market sentiment analysis module, incorporating social media data for auxiliary judgment
- Optimize LSTM model by introducing more feature variables to improve prediction accuracy
- Develop intelligent fund management system to dynamically adjust risk exposure based on historical performance
- Add multi-instrument correlation analysis to achieve better portfolio hedging effects
Summary
This strategy constructs a relatively complete quantitative trading system through the integration of multi-period trend analysis, dynamic risk control, and machine learning technology. The core advantages lie in its comprehensive risk management system and multi-dimensional signal confirmation mechanism, while attention needs to be paid to parameter optimization and market adaptability issues. Traders are advised to conduct thorough backtesting before live implementation and perform targeted optimization based on specific market characteristics.
Source Pine Script
/*backtest
start: 2024-02-21 00:00:00
end: 2025-02-18 08:00:00
period: 1h
basePeriod: 1h
exchanges: [{"eid":"Binance","currency":"ETH_USDT"}]
*/

//@version=6
strategy("Optimized strategy framework", overlay=true)

// Input Parameters
ema_length = input.int(20, title="EMAtimeframe")
adx_length = input.int(14, title="ADXtimeframe")
rsi_length = input.int(21, title="RSItimeframe")
atr_length = input.int(14, title="ATRtimeframe")
volume_length = input.int(20, title="Volume average period")
fibonacci_level = 1.618  // Fibonacci extension levels161.8%

// Calculate technical indicators
ema = ta.ema(close, ema_length)

// Useta.dmi()to obtain+DI, -DI and ADX
[dm_plus, dm_minus, adx] = ta.dmi(adx_length, adx_length)

// CalculationRSIandATR
rsi = ta.rsi(close, rsi_length)
atr = ta.atr(atr_length)
vwap = ta.vwap(close)
avg_volume = ta.sma(volume, volume_length)

// Define Trend
bull_trend = close > ema and adx > 25
bear_trend = close < ema and adx > 25
range_market = adx < 25

// VWAPLayered Positioning
upper_bound = vwap + 1.5 * atr
lower_bound = vwap - 1.5 * atr

// Calculation4Hourly chart signals
four_hour_ema = request.security(syminfo.tickerid, "240", ta.ema(close, ema_length))
four_hour_vwap = request.security(syminfo.tickerid, "240", ta.vwap(close))
four_hour_rsi = request.security(syminfo.tickerid, "240", ta.rsi(close, rsi_length))
four_hour_volume = request.security(syminfo.tickerid, "240", ta.sma(volume, volume_length))

// Long position entry condition
long_condition = bull_trend and (close[1] < four_hour_ema or close[1] < four_hour_vwap) and rsi[1] < 45 and rsi[0] > 40 and volume < avg_volume * 0.7

// Short position entry condition
short_condition = bear_trend and (close[1] > four_hour_ema or close[1] > four_hour_vwap) and rsi[1] > 55 and rsi[0] < 60 and volume < avg_volume * 0.8

// Calculate stop loss and take profit
long_stop = close - 1.5 * atr
short_stop = close + 1.5 * atr
long_target = vwap + atr  // First goal,VWAP+1×ATR
short_target = vwap - atr // First goal,VWAP-1×ATR
fibonacci_target = close + (fibonacci_level * (high - low))  // Fibonacci 161.8% target

// Calculate position size (position control))
risk_per_trade = 0.01  // single trade risk is the account net value of1%
account_balance = strategy.equity
position_size = (account_balance * risk_per_trade) / (1.5 * atr)

// Plot buy and sell signals
plotshape(series=long_condition, title="Long Entry", location=location.belowbar, color=color.green, style=shape.triangleup, text="BUY")
plotshape(series=short_condition, title="Short Entry", location=location.abovebar, color=color.red, style=shape.triangledown, text="SELL")

// Execution Strategy
if (long_condition)
    strategy.entry("Long", strategy.long, qty=position_size)

if (short_condition)
    strategy.entry("Short", strategy.short, qty=position_size)

strategy.exit("Take Profit/Stop Loss", "Long", stop=long_stop, limit=long_target)
strategy.exit("Take Profit/Stop Loss", "Long", stop=long_stop, limit=fibonacci_target)

strategy.exit("Take Profit/Stop Loss", "Short", stop=short_stop, limit=short_target)
strategy.exit("Take Profit/Stop Loss", "Short", stop=short_stop, limit=fibonacci_target)

// DrawVWAPAnd overbought/oversold zones
plot(vwap, title="VWAP", color=color.blue)
plot(upper_bound, title="overbought area", color=color.red, linewidth=2, style=plot.style_line)
plot(lower_bound, title="oversold area", color=color.green, linewidth=2, style=plot.style_line)
Published by ianzeng123 on the FMZ strategy square · last modified 2025-02-20. Collected in the Quant Trading Vault. Unvalidated research: re-test with your own data and costs before trusting it.
Build this with AgenKit
A spec is not a trading system. Paste this into your coding agent and AgenKit runs a specialist team — architecture, test-first build, risk gates, review — with paper trading on by default.
/agenkit build a production-grade trading bot with a backtest engine, risk controls and paper trading by default from strategies/Multi-Period-Trend-Confirmation-Dynamic-Risk-Control-Quantitative-Trading-Strategy.md- npx agenkit install engineering-kit in your project
- Paste the command into your agent and approve each phase
- Get tests, backtest, risk controls and a paper-trading switch
Understand it first
Before you run this, read the lesson behind the idea and how to backtest it honestly. Specs like this one are the survivors of an unknown number of trials; deflate their results accordingly.
Related specs
- Multi Period Trend Following and Volume Analysis Adaptive Risk StrategyPine Script · Trend following · 1d
- Fixed Range Volume Profile And Anchored VWAP Trend Identification Strategy With Dynamic Stop LossPine Script · Trend following · 1h
- Trend Tracking and Short term Trading Strategy Based on ADX IndicatorPine Script · Trend following · 1d
- Multi Timeframe Volume and Trend Confluence Trading StrategyPine Script · Trend following · 1d
- Multi Indicator Trend Following Strategy with ATR Dynamic Stop Loss Take ProfitPine Script · Trend following · 1d
- Trend Tracking Trailing Stop StrategyPine Script · Trend following · 1d