Strategy vault / Trend following
Multi SMA and Stochastic Combined Trend Following Trading Strategy
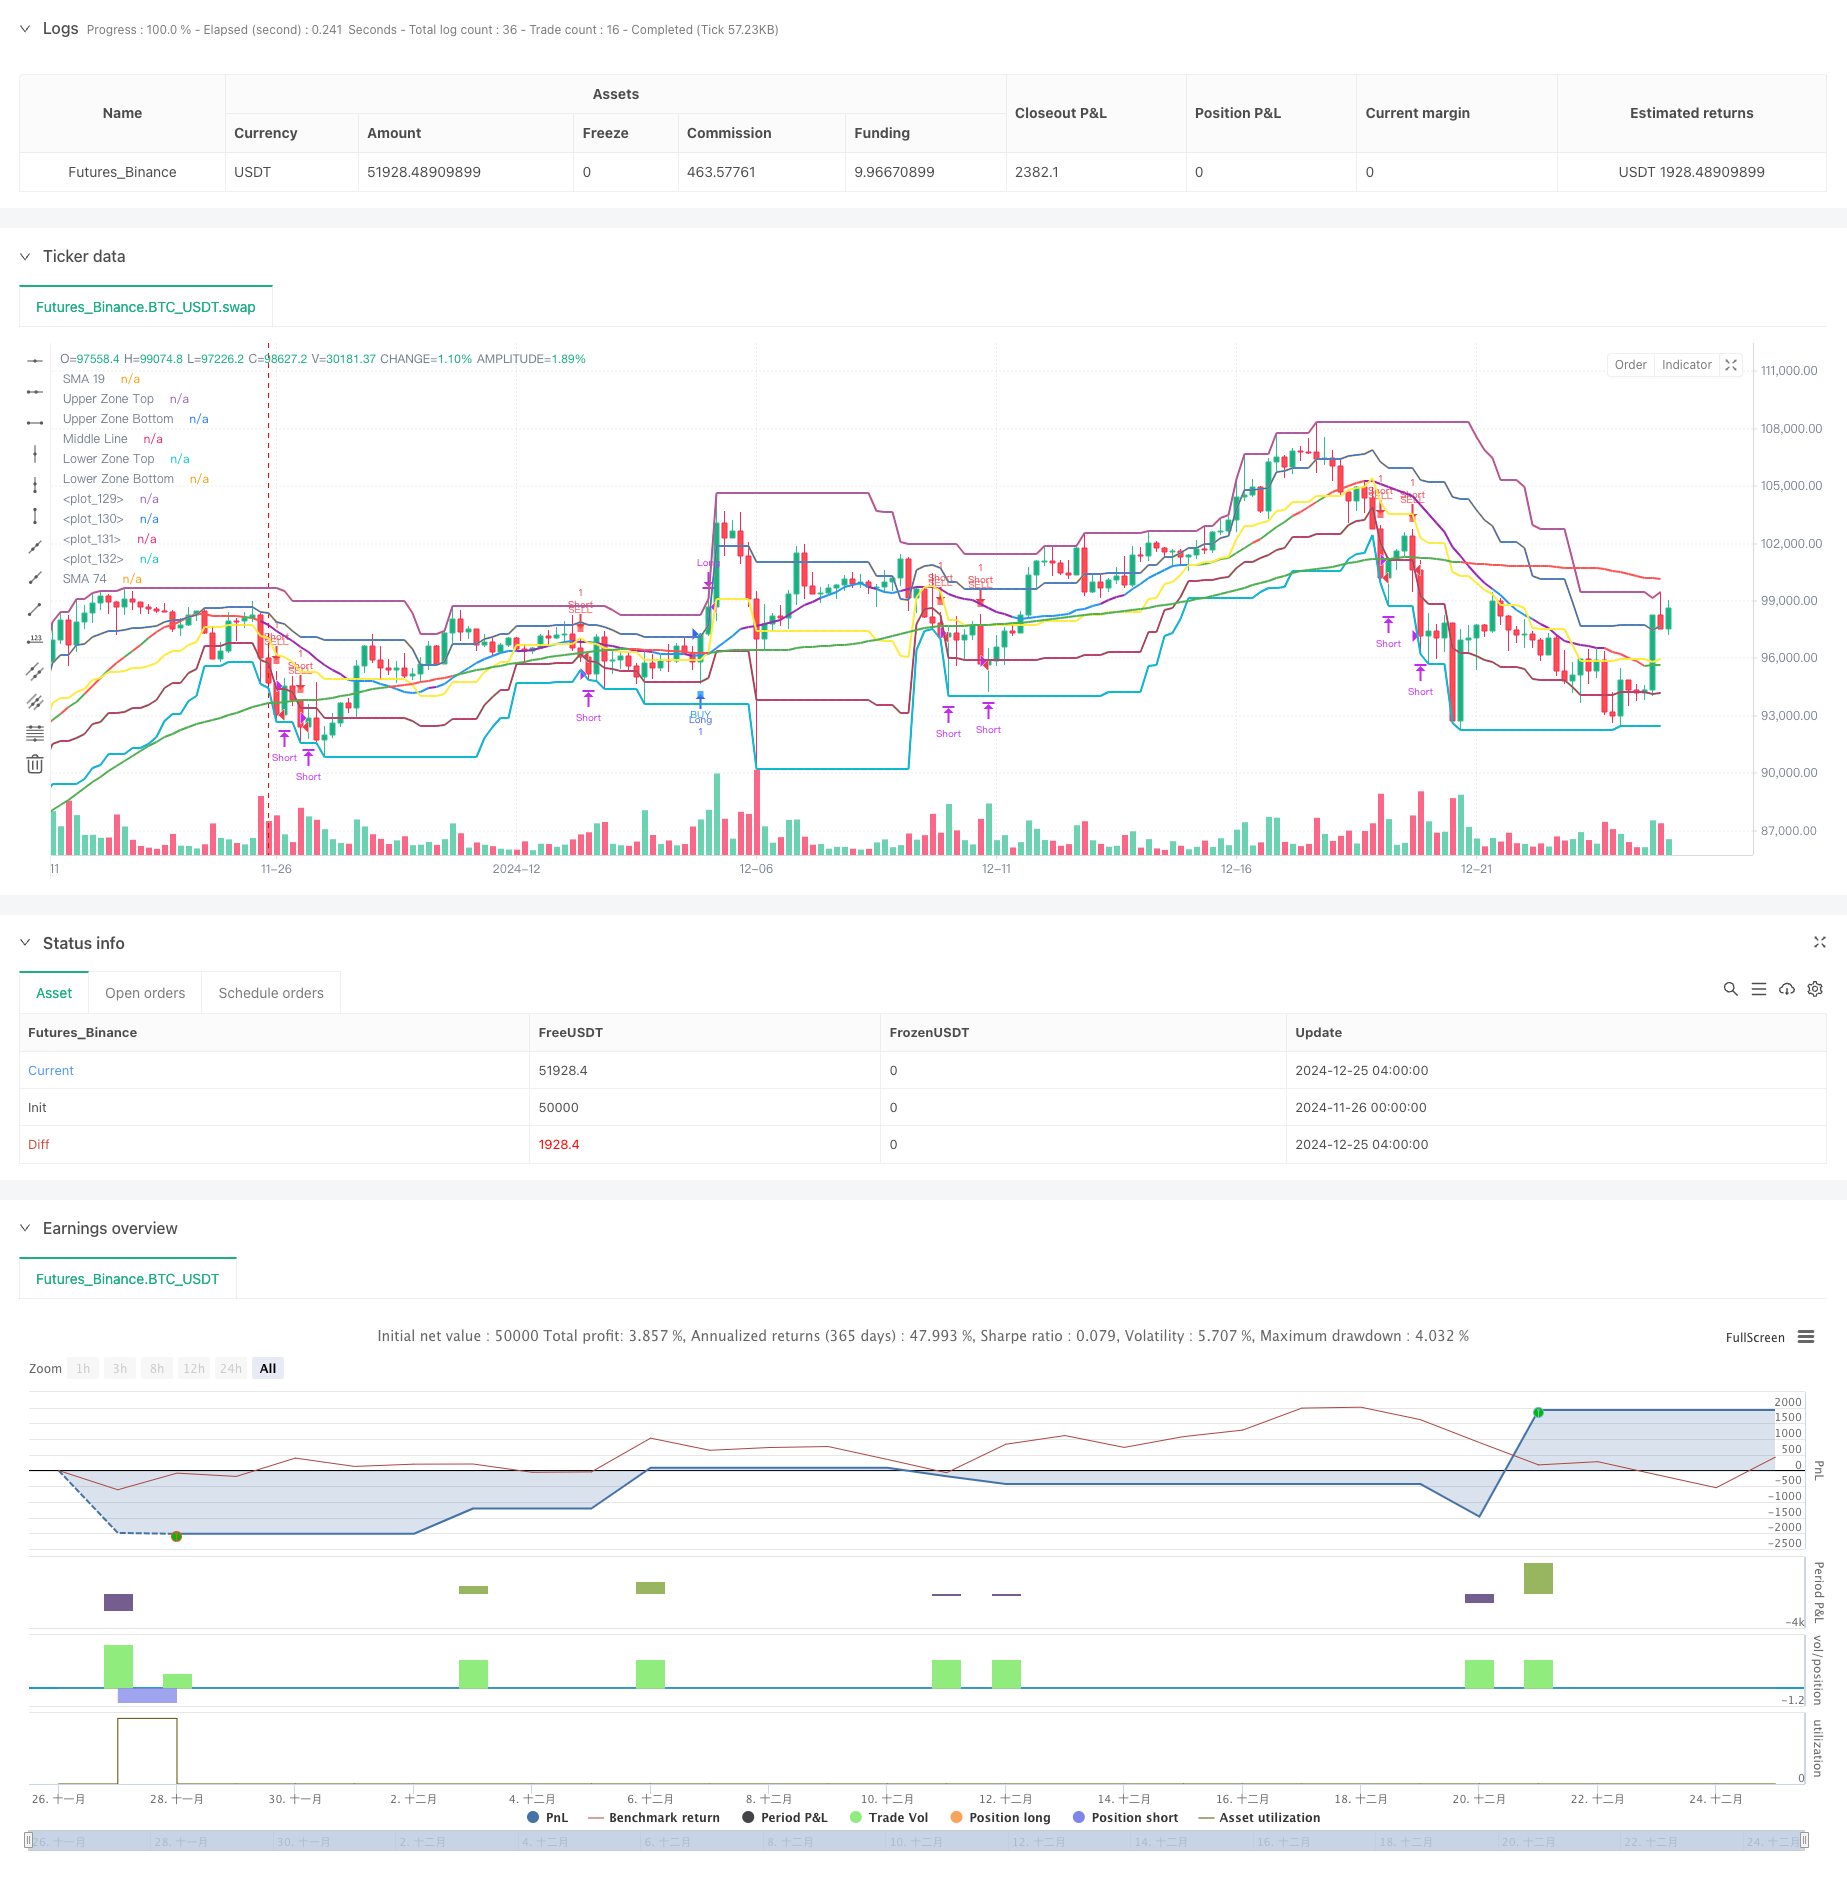
This strategy is a trend following trading system that combines multiple Simple Moving Averages (SMA) with the Stochastic oscillator. It executes trades when market trends are clearly defined by establishing price…
Overview
This strategy is a trend following trading system that combines multiple Simple Moving Averages (SMA) with the Stochastic oscillator. It executes trades when market trends are clearly defined by establishing price zones and trend identification conditions. The strategy employs a dynamic stop-loss mechanism that adjusts position management based on market movements, both protecting profits and avoiding premature exits.
Strategy Principles
The strategy is built on several core components:
- Dual SMA System: Uses 19-period and 74-period SMAs for trend determination
- Price Zones: Divides price range into 5 levels for market strength assessment
- Stochastic Oscillator: Employs 60-period stochastic for overbought/oversold conditions
- Trend Confirmation: Uses three consecutive candles to confirm trend continuation
- Entry Conditions: Enters when price crosses 74-period SMA and is within specified price zones
- Stop-Loss Mechanism: Implements trailing stops with trend-based exits
Strategy Advantages
- System Completeness: Combines trend following and momentum indicators for comprehensive market analysis
- Risk Management: Multiple stop-loss mechanisms including hard stops and trailing stops
- Adaptability: Can be adjusted for different market conditions through parameter optimization
- Trend Capture: Effectively captures medium to long-term trends while avoiding false signals
- Position Management: Dynamically adjusts positions based on market conditions for efficient capital utilization
Strategy Risks
- Choppy Market Risk: May generate frequent trades in sideways markets
- Slippage Risk: Potentially significant slippage in fast-moving markets
- Parameter Sensitivity: Different parameter combinations may lead to varying performance
- Market Environment Dependency: Strategy performs better in trending markets
- Capital Management Risk: Full position sizing may lead to significant drawdowns
Optimization Directions
- Incorporate Volatility Indicators: Consider adding ATR for dynamic stop-loss adjustment
- Optimize Entry Timing: Add volume confirmation to improve entry accuracy
- Enhance Capital Management: Implement position sizing module based on risk assessment
- Add Market Environment Analysis: Include trend strength indicators to filter signals
- Improve Stop-Loss Mechanism: Consider percentage-based trailing stops for better flexibility
Summary
This strategy builds a comprehensive trading system by combining multiple technical indicators, featuring strong trend-following capabilities and risk management mechanisms. While it may face challenges in certain market conditions, continuous optimization and refinement can help maintain stable performance across different market environments. Traders are advised to control position sizes, set appropriate stop-losses, and adjust parameters according to market conditions when implementing the strategy in live trading.
Source Pine Script
/*backtest
start: 2024-11-26 00:00:00
end: 2024-12-25 08:00:00
period: 4h
basePeriod: 4h
exchanges: [{"eid":"Futures_Binance","currency":"BTC_USDT"}]
*/

//@version=5
strategy("Purple SMA Strategy", overlay=true)

// === INPUTS ===
zoneLength = input.int(20, "Price Zone Length", minval=5)
tickSize = input.float(1.0, "Tick Size for Hard Stop")
hardStopTicks = input.int(50, "Hard Stop Loss in Ticks")

// === CALCULATE ZONES ===
h = ta.highest(high, zoneLength)
l = ta.lowest(low, zoneLength)
priceRange = h - l
lvl5 = h
lvl4 = l + (priceRange * 0.75)  // Orange line
lvl3 = l + (priceRange * 0.50)  // Yellow line
lvl2 = l + (priceRange * 0.25)  // Green line
lvl1 = l

// === INDICATORS ===
sma19 = ta.sma(close, 19)
sma74 = ta.sma(close, 74)

// === CANDLE COLOR CONDITIONS ===
isGreenCandle = close > open
isRedCandle = close < open

// === CONTINUOUS TREND DETECTION ===
isThreeGreenCandles = close > open and close[1] > open[1] and close[2] > open[2]
isThreeRedCandles = close < open and close[1] < open[1] and close[2] < open[2]

var bool inGreenTrend = false
var bool inRedTrend = false

// Update trends
if isThreeGreenCandles
    inGreenTrend := true
    inRedTrend := false
if isThreeRedCandles
    inRedTrend := true
    inGreenTrend := false
if (inGreenTrend and isRedCandle) or (inRedTrend and isGreenCandle)
    inGreenTrend := false
    inRedTrend := false

// === STOCHASTIC CONDITIONS ===
k = ta.stoch(close, high, low, 60)
d = ta.sma(k, 10)
isOverbought = d >= 80
isOversold = d <= 20
stochUp = d > d[1]
stochDown = d < d[1]

// === SMA COLOR LOGIC ===
sma19Color = if isOverbought and stochUp
    color.green
else if isOverbought and stochDown
    color.red
else if isOversold and stochUp
    color.green
else if isOversold and stochDown
    color.red
else if stochUp
    color.blue
else if stochDown
    color.purple
else
    color.gray

sma74Color = sma74 < sma19 ? color.green : color.red

// === CROSSING CONDITIONS ===
crossUpSMA = ta.crossover(close, sma74)
crossDownSMA = ta.crossunder(close, sma74)

// === ENTRY CONDITIONS ===
buyCondition = crossUpSMA and close > lvl4
sellCondition = crossDownSMA and close < lvl2

// === POSITION MANAGEMENT ===
var float stopLevel = na
var bool xMode = false

// Entry and Stop Loss
if buyCondition
    strategy.entry(id="Long", direction=strategy.long)
    stopLevel := close - (hardStopTicks * tickSize)
    xMode := false

if sellCondition
    strategy.entry(id="Short", direction=strategy.short)
    stopLevel := close + (hardStopTicks * tickSize)
    xMode := false

// Update stops based on X's
if strategy.position_size != 0 and (inGreenTrend or inRedTrend)
    xMode := true
    if strategy.position_size > 0  // Long position
        stopLevel := low
    else  // Short position
        stopLevel := high

// Exit logic
if strategy.position_size > 0  // Long position
    if low <= stopLevel
        strategy.close(id="Long")
    else if xMode and not (inGreenTrend or inRedTrend)
        strategy.close(id="Long")

if strategy.position_size < 0  // Short position
    if high >= stopLevel
        strategy.close(id="Short")
    else if xMode and not (inGreenTrend or inRedTrend)
        strategy.close(id="Short")

// === PLOTTING ===
plot(sma19, "SMA 19", color=sma19Color, linewidth=2)
plot(sma74, "SMA 74", color=sma74Color, linewidth=2)
plot(lvl5, "Upper Zone Top", color=color.red, linewidth=2)
plot(lvl4, "Upper Zone Bottom", color=color.orange, linewidth=2)
plot(lvl3, "Middle Line", color=color.yellow, linewidth=2)
plot(lvl2, "Lower Zone Top", color=color.green, linewidth=2)
plot(lvl1, "Lower Zone Bottom", color=color.blue, linewidth=2)

// Plot X signals
plotshape(inGreenTrend, title="Bullish Line", style=shape.xcross, location=location.belowbar, color=color.white, size=size.tiny)
plotshape(inRedTrend, title="Bearish Line", style=shape.xcross, location=location.abovebar, color=color.white, size=size.tiny)

// Zone fills
var p1 = plot(lvl5, display=display.none)
var p2 = plot(lvl4, display=display.none)
var p3 = plot(lvl2, display=display.none)
var p4 = plot(lvl1, display=display.none)
fill(p1, p2, color=color.new(color.red, 90))
fill(p3, p4, color=color.new(color.green, 90))

// Plot entry signals
plotshape(buyCondition, title="Buy", style=shape.square, location=location.belowbar, color=color.new(color.blue, 20), size=size.tiny, text="BUY", textcolor=color.blue)
plotshape(sellCondition, title="Sell", style=shape.square, location=location.abovebar, color=color.new(color.red, 20), size=size.tiny, text="SELL", textcolor=color.red)Published by ChaoZhang on the FMZ strategy square · last modified 2024-12-27. Collected in the Quant Trading Vault. Unvalidated research: re-test with your own data and costs before trusting it.
Build this with AgenKit
A spec is not a trading system. Paste this into your coding agent and AgenKit runs a specialist team — architecture, test-first build, risk gates, review — with paper trading on by default.
/agenkit build a production-grade trading bot with a backtest engine, risk controls and paper trading by default from strategies/Multi-SMA-and-Stochastic-Combined-Trend-Following-Trading-Strategy.md- npx agenkit install engineering-kit in your project
- Paste the command into your agent and approve each phase
- Get tests, backtest, risk controls and a paper-trading switch
Understand it first
Before you run this, read the lesson behind the idea and how to backtest it honestly. Specs like this one are the survivors of an unknown number of trials; deflate their results accordingly.
Related specs
- Multi Technical Indicator Cross Trend Tracking Strategy RSI and Stochastic RSI Synergy Trading SystemPine Script · Trend following · 1d
- Multi Timeframe Stochastic Oscillator Trend Following Trading StrategyPine Script · Trend following · 3h
- Adaptive Trading Strategy Based on Stochastic RSI Dual Line CrossoverPine Script · Trend following · 4h
- Dual Moving Average Crossover Strategy with Stop Loss and Take ProfitPine Script · Trend following · 4h
- Dynamic Moving Average and Bollinger Bands Cross Strategy with Fixed Stop Loss Optimization ModelPine Script · Trend following · 3h
- Dynamic Signal Line Trend Following Strategy Combining ATR and VolumePine Script · Trend following · 1h