Strategy vault / Trend following
Multi Technical Indicator Cross Trend Tracking Strategy RSI and Stochastic RSI Synergy Trading System
This strategy is a trend-following trading system based on the Relative Strength Index (RSI) and Stochastic RSI indicators. The strategy monitors overbought and oversold levels of both RSI and Stochastic RSI to…
Overview
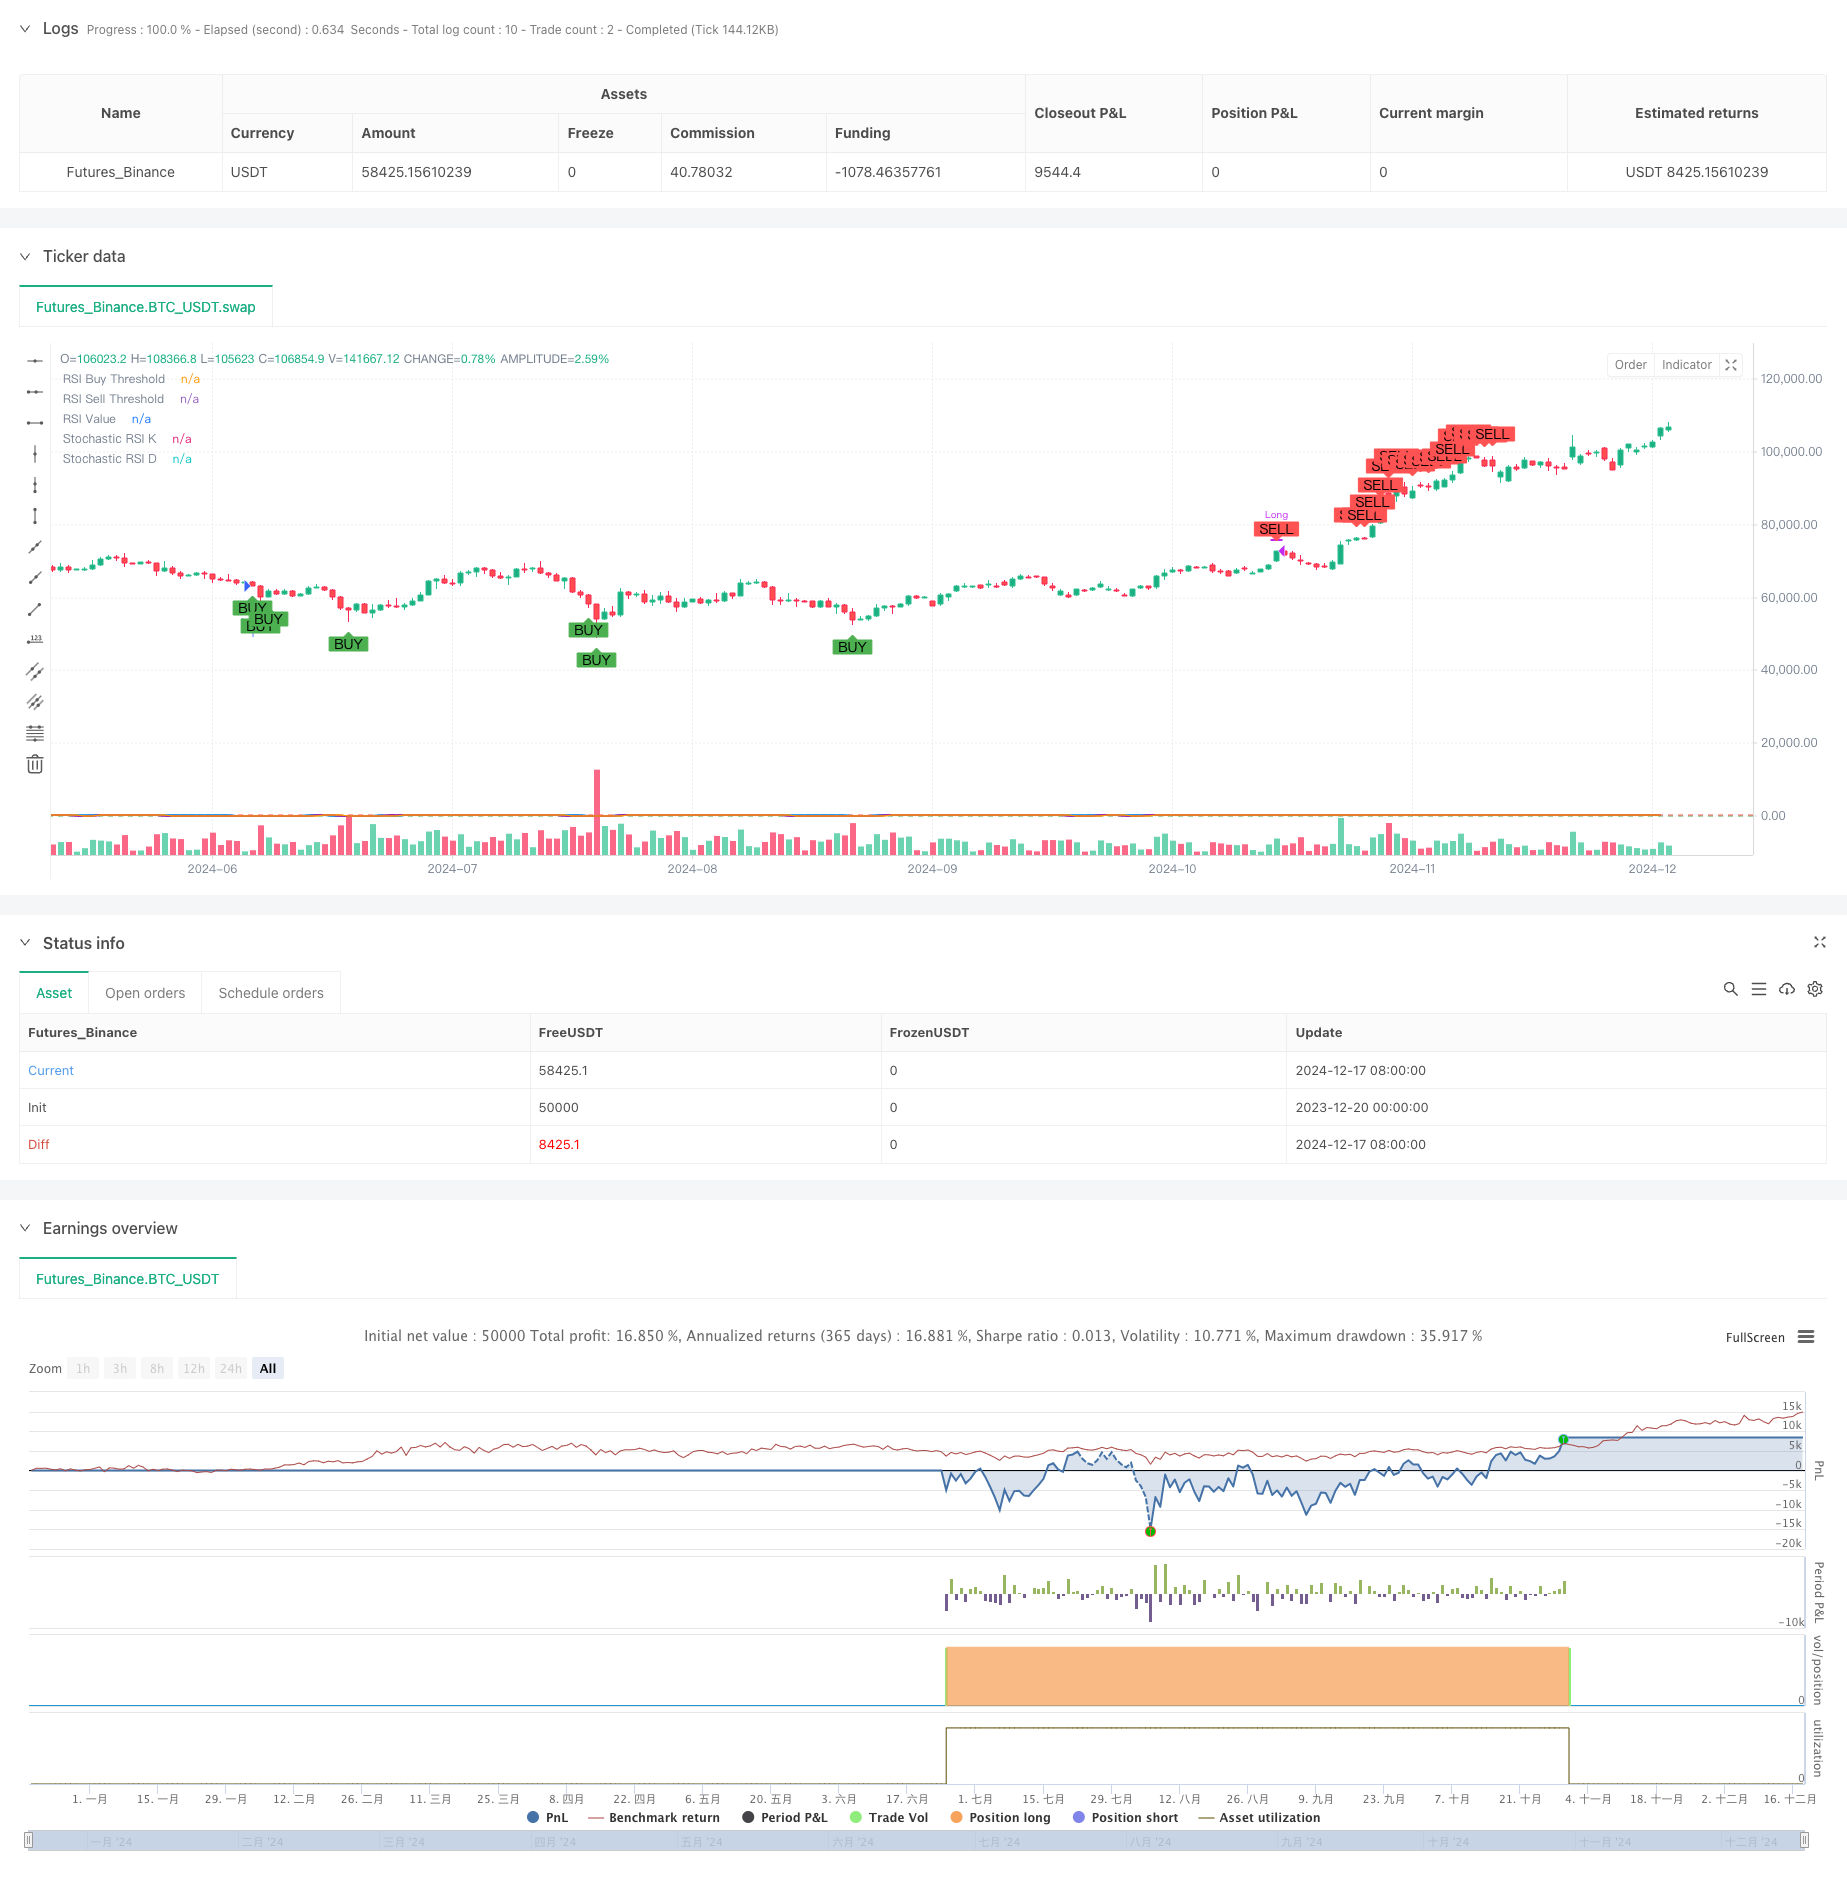
This strategy is a trend-following trading system based on the Relative Strength Index (RSI) and Stochastic RSI indicators. The strategy monitors overbought and oversold levels of both RSI and Stochastic RSI to execute trades when market signals appear. It supports both daily and weekly timeframes, providing traders with flexible trading options.
Strategy Principles
The strategy primarily relies on two technical indicators: RSI and Stochastic RSI. RSI measures the speed and magnitude of price movements, while Stochastic RSI applies stochastic calculations to RSI values to provide more sensitive overbought and oversold signals. Buy signals are triggered when RSI falls below 35 and Stochastic RSI K-value drops below 20, indicating oversold conditions. Sell signals are triggered when RSI rises above 70 and Stochastic RSI K-value exceeds 80, indicating overbought conditions. The strategy employs Simple Moving Averages (SMA) to smooth the Stochastic RSI K-line and D-line, reducing false signals.
Strategy Advantages
- Dual confirmation mechanism: Combining RSI and Stochastic RSI reduces the impact of false signals.
- Flexible timeframes: Supports both daily and weekly timeframes, accommodating different trading styles.
- Strong parameter adaptability: Traders can adjust RSI and Stochastic RSI parameters based on market conditions.
- Good visualization: Strategy provides clear buy/sell signal markers and indicator line visualization.
- Systematic approach: Clear strategy logic with defined entry and exit rules.
Strategy Risks
- Sideways market risk: May generate frequent trading signals in ranging markets, increasing transaction costs.
- Trend reversal risk: In strong trend markets, the strategy might exit positions early due to overbought/oversold signals.
- Parameter sensitivity: Different parameter settings can lead to significantly different trading results.
- Lag risk: Technical indicators inherently have lag, potentially causing delayed entry and exit timing.
Strategy Optimization Directions
- Implement trend filters: Add trend indicators like moving averages to execute signals only in clear trends.
- Optimize parameter adaptation: Develop dynamic parameter adjustment mechanisms for automatic market volatility adaptation.
- Add stop-loss mechanisms: Set stop-loss conditions based on ATR or fixed percentages for risk control.
- Incorporate volume confirmation: Integrate volume indicators to improve signal reliability.
- Develop signal strength scoring: Establish a signal strength scoring system to adjust position sizes based on signal strength.
Conclusion
This strategy builds a relatively reliable trading system by combining the advantages of RSI and Stochastic RSI. While it has certain limitations, the strategy holds practical value through proper risk management and continuous optimization. Traders are advised to thoroughly test different parameter combinations and make appropriate adjustments based on market conditions and personal risk preferences before live trading.
Source Pine Script
/*backtest
start: 2023-12-20 00:00:00
end: 2024-12-18 08:00:00
period: 1d
basePeriod: 1d
exchanges: [{"eid":"Futures_Binance","currency":"BTC_USDT"}]
*/

//@version=5
strategy("BTC Buy & Sell Strategy (RSI & Stoch RSI)", overlay=true)

// Input Parameters
rsi_length = input.int(14, title="RSI Length")
stoch_length = input.int(14, title="Stochastic Length")
stoch_smooth_k = input.int(3, title="Stochastic %K Smoothing")
stoch_smooth_d = input.int(3, title="Stochastic %D Smoothing")

// Threshold Inputs
rsi_buy_threshold = input.float(35, title="RSI Buy Threshold")
stoch_buy_threshold = input.float(20, title="Stochastic RSI Buy Threshold")
rsi_sell_threshold = input.float(70, title="RSI Sell Threshold")
stoch_sell_threshold = input.float(80, title="Stochastic RSI Sell Threshold")

use_weekly_data = input.bool(false, title="Use Weekly Data", tooltip="Enable to use weekly timeframe for calculations.")

// Timeframe Configuration
timeframe = use_weekly_data ? "W" : timeframe.period

// Calculate RSI and Stochastic RSI
rsi_value = request.security(syminfo.tickerid, timeframe, ta.rsi(close, rsi_length))
stoch_rsi_k_raw = request.security(syminfo.tickerid, timeframe, ta.stoch(close, high, low, stoch_length))
stoch_rsi_k = ta.sma(stoch_rsi_k_raw, stoch_smooth_k)
stoch_rsi_d = ta.sma(stoch_rsi_k, stoch_smooth_d)

// Define Buy and Sell Conditions
buy_signal = (rsi_value < rsi_buy_threshold) and (stoch_rsi_k < stoch_buy_threshold)
sell_signal = (rsi_value > rsi_sell_threshold) and (stoch_rsi_k > stoch_sell_threshold)

// Strategy Execution
if buy_signal
    strategy.entry("Long", strategy.long, comment="Buy Signal")

if sell_signal
    strategy.close("Long", comment="Sell Signal")

// Plot Buy and Sell Signals
plotshape(buy_signal, style=shape.labelup, location=location.belowbar, color=color.green, title="Buy Signal", size=size.small, text="BUY")
plotshape(sell_signal, style=shape.labeldown, location=location.abovebar, color=color.red, title="Sell Signal", size=size.small, text="SELL")

// Plot RSI and Stochastic RSI for Visualization
hline(rsi_buy_threshold, "RSI Buy Threshold", color=color.green)
hline(rsi_sell_threshold, "RSI Sell Threshold", color=color.red)

plot(rsi_value, color=color.blue, linewidth=2, title="RSI Value")
plot(stoch_rsi_k, color=color.purple, linewidth=2, title="Stochastic RSI K")
plot(stoch_rsi_d, color=color.orange, linewidth=1, title="Stochastic RSI D")
Published by ChaoZhang on the FMZ strategy square · last modified 2024-12-20. Collected in the Quant Trading Vault. Unvalidated research: re-test with your own data and costs before trusting it.
Build this with AgenKit
A spec is not a trading system. Paste this into your coding agent and AgenKit runs a specialist team — architecture, test-first build, risk gates, review — with paper trading on by default.
/agenkit build a production-grade trading bot with a backtest engine, risk controls and paper trading by default from strategies/Multi-Technical-Indicator-Cross-Trend-Tracking-Strategy-RSI-and-Stochastic-RSI-Synergy-Trading-System.md- npx agenkit install engineering-kit in your project
- Paste the command into your agent and approve each phase
- Get tests, backtest, risk controls and a paper-trading switch
Understand it first
Before you run this, read the lesson behind the idea and how to backtest it honestly. Specs like this one are the survivors of an unknown number of trials; deflate their results accordingly.
Related specs
- Adaptive Trading Strategy Based on Stochastic RSI Dual Line CrossoverPine Script · Trend following · 4h
- EMA200 and Stochastic RSI StrategyPine Script · Trend following · 1h
- Fixed Range Volume Profile And Anchored VWAP Trend Identification Strategy With Dynamic Stop LossPine Script · Trend following · 1h
- Gaussian Channel Trend Following with Stochastic RSI Trading StrategyPine Script · Trend following · 1d
- Multi Dimensional Short Term Trend Predictor Technical Analysis and Volatility Adaptive Trading StrategyPine Script · Trend following · 1h
- Multi Indicator Trend Following with Oscillator Alert StrategyPine Script · Trend following · 2h