Multi Technical Indicator Trend Following Channel Breakout Trading Strategy with Candlestick Pattern Filtering System
This strategy is a multi-dimensional technical indicator trading system combining Keltner Channel, candlestick patterns, and volume analysis. The strategy monitors price breakouts of the channel while using volume…
Overview
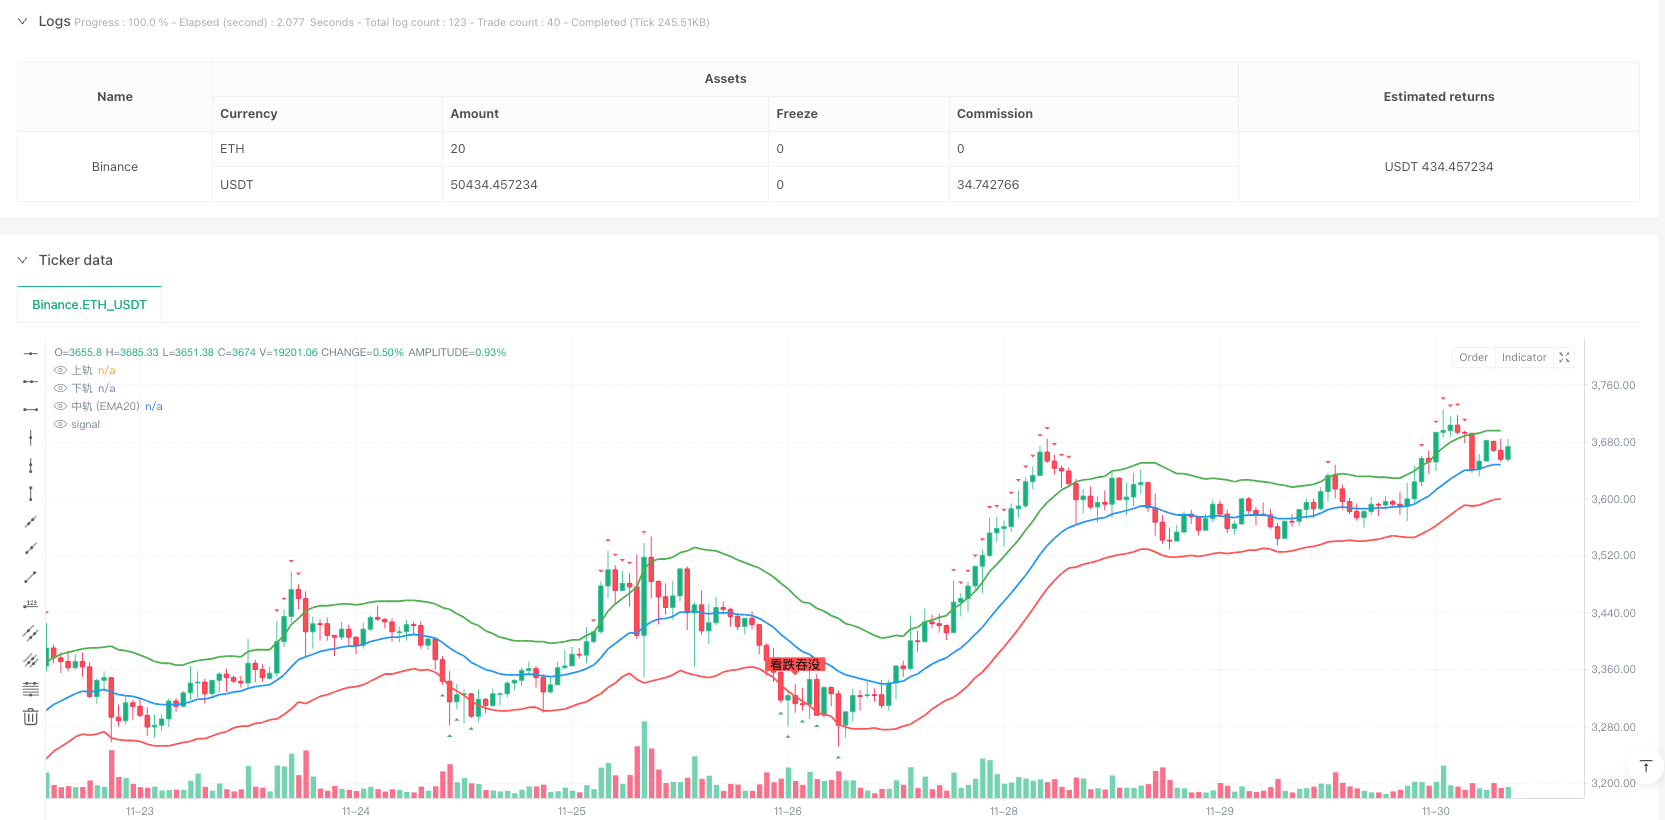
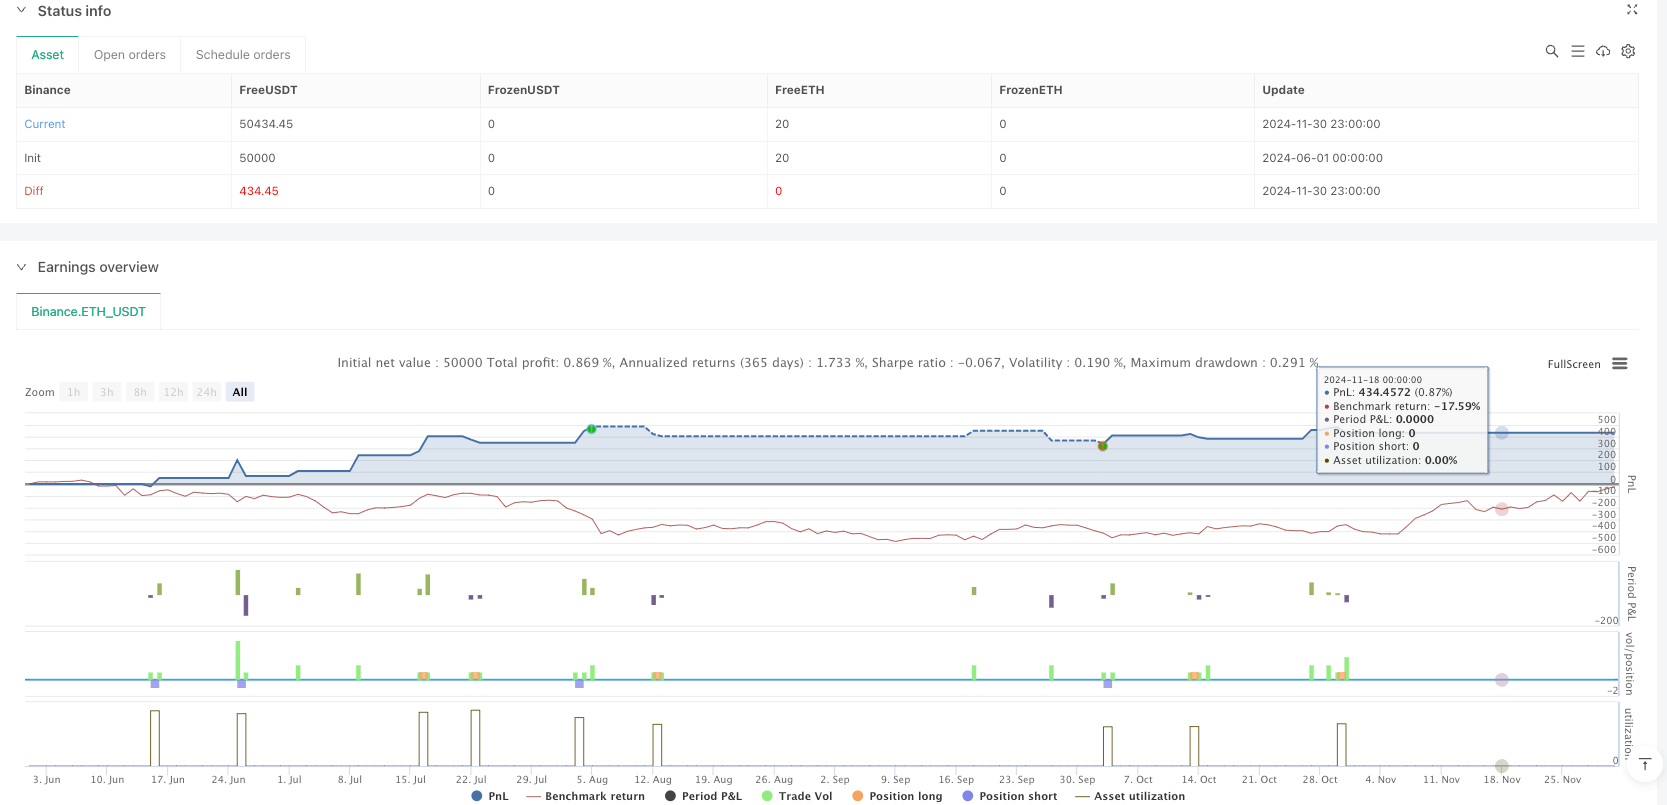
This strategy is a multi-dimensional technical indicator trading system combining Keltner Channel, candlestick patterns, and volume analysis. The strategy monitors price breakouts of the channel while using volume and candlestick patterns as filtering conditions to enhance signal reliability. The system includes a comprehensive money management mechanism with dynamic stop-loss and take-profit settings based on ATR.
Strategy Principles
The strategy is built on these core components:
- Uses 20-period EMA as the trend middle line, combined with 1.5x ATR to construct upper and lower bands, forming the Keltner Channel
- Identifies potential trading opportunities by monitoring closing price breakouts of channel boundaries
- Applies volume filtering, requiring breakout volume above 20-period average
- Incorporates bullish/bearish engulfing patterns as additional confirmation signals
- Employs 1.5x ATR for stop-loss and 2x ATR for take-profit, achieving a risk-reward ratio of approximately 1:1.33
Strategy Advantages
- Multiple technical indicator cross-validation improves signal reliability
- Dynamic channel width adapts to market volatility changes
- Volume confirmation enhances trading signal validity
- Candlestick pattern filtering reduces false breakout interference
- Comprehensive stop-loss and take-profit mechanism protects capital
- Visualization markers help traders identify false breakouts
Strategy Risks
- May generate frequent false breakout signals in ranging markets
- Stop-loss levels might be too wide during intense volatility
- Multiple filtering conditions could miss some valid signals
- Engulfing patterns may become less reliable in certain market conditions
- Fixed multiplier for stop-loss and take-profit may not suit all market environments
Strategy Optimization Directions
- Introduce trend strength indicator (like ADX) to filter ranging markets
- Develop adaptive ATR multiplier adjustment mechanism
- Add more candlestick pattern recognition to improve signal quality
- Dynamically adjust stop-loss and take-profit multipliers based on market volatility
- Add time filtering to avoid trading during unfavorable periods
- Develop market state classification system for parameter adaptation
Summary
This strategy integrates multiple technical analysis tools to build a relatively complete trading system. Its strengths lie in multiple signal confirmation mechanisms and comprehensive risk management system, but still requires optimization based on specific market characteristics. Successful application requires traders to deeply understand each component's role and maintain flexibility in actual trading.
Source Pine Script
/*backtest
start: 2024-06-01 00:00:00
end: 2024-12-01 00:00:00
period: 1h
basePeriod: 1h
exchanges: [{"eid":"Binance","currency":"ETH_USDT"}]
*/

//@version=5
strategy("Keltner Channel Breakout with Candlestick Patterns (Manual) - Visualize False Breakouts with Chinese Labels", overlay=true)

// Input Parameters
length = input.int(20, title="EMA Length")
mult = input.float(1.5, title="ATR Multiplier")  // Make the channel slightly tighter to increase breakout opportunities
atrLength = input.int(14, title="ATR Length")
volLength = input.int(20, title="Volume length")
stopLossMultiplier = input.float(1.5, title="stop lossATRMultiples")
takeProfitMultiplier = input.float(2.0, title="take profitATRMultiples")

// Calculation Keltner Channel
ema20 = ta.ema(close, length)
atr = ta.atr(atrLength)
upper = ema20 + mult * atr
lower = ema20 - mult * atr

// Draw Keltner Channel
plot(upper, color=color.green, linewidth=2, title="Upper rail")
plot(lower, color=color.red, linewidth=2, title="Lower Band")
plot(ema20, color=color.blue, linewidth=2, title="Middle track (EMA20)")

// Breakthrough Judgment
breakout_up = close > upper
breakout_down = close < lower

// Volume filter: Is current volume higher than in the past N Root K Average trading volume of the line
volume_above_avg = volume > ta.sma(volume, volLength)

// Manual Judgment KLine patterns: bullish engulfing and bearish engulfing
bullish_engulfing = close > open and open[1] > close[1] and close > open[1] and open < close[1]
bearish_engulfing = close < open and open[1] < close[1] and close < open[1] and open > close[1]

// Only applied when breaking upper and lower bands KLine pattern filter
valid_breakout_up = breakout_up and volume_above_avg and bullish_engulfing
valid_breakout_down = breakout_down and volume_above_avg and bearish_engulfing

// Trading signals
long_condition = valid_breakout_up
short_condition = valid_breakout_down

// Trading strategy
if (long_condition)
    strategy.entry("Long", strategy.long, comment="go long")

if (short_condition)
    strategy.entry("Short", strategy.short, comment="go short")

// stop loss & take profit
long_stop_loss = close - stopLossMultiplier * atr
long_take_profit = close + takeProfitMultiplier * atr
short_stop_loss = close + stopLossMultiplier * atr
short_take_profit = close - takeProfitMultiplier * atr

strategy.exit("Exit Long", from_entry="Long", stop=long_stop_loss, limit=long_take_profit)
strategy.exit("Exit Short", from_entry="Short", stop=short_stop_loss, limit=short_take_profit)

// Visualizing false breakthrough events
plotshape(series=breakout_up and not bullish_engulfing, location=location.abovebar, color=color.red, style=shape.triangledown, title="False Breakout - Up")
plotshape(series=breakout_down and not bearish_engulfing, location=location.belowbar, color=color.green, style=shape.triangleup, title="False Breakout - Down")

// Visualization KLine shape (Chinese label)
plotshape(series=bullish_engulfing and breakout_up, location=location.belowbar, color=color.green, style=shape.labelup, title="Bullish engulfing")
plotshape(series=bearish_engulfing and breakout_down, location=location.abovebar, color=color.red, style=shape.labeldown, title="Bearish engulfing")
Published by ianzeng123 on the FMZ strategy square · last modified 2025-02-27. Collected in the Quant Trading Vault. Unvalidated research: re-test with your own data and costs before trusting it.
Build this with AgenKit
A spec is not a trading system. Paste this into your coding agent and AgenKit runs a specialist team — architecture, test-first build, risk gates, review — with paper trading on by default.
/agenkit build a production-grade trading bot with a backtest engine, risk controls and paper trading by default from strategies/Multi-Technical-Indicator-Trend-Following-Channel-Breakout-Trading-Strategy-with-Candlestick-Pattern-Filtering-System.md- npx agenkit install engineering-kit in your project
- Paste the command into your agent and approve each phase
- Get tests, backtest, risk controls and a paper-trading switch
Understand it first
Before you run this, read the lesson behind the idea and how to backtest it honestly. Specs like this one are the survivors of an unknown number of trials; deflate their results accordingly.
Related specs
- Dual Breakout Volatility Channel StrategyPine Script · Breakout · 1h
- Flexible Long Short Trading Strategy Based on Keltner ChannelsPine Script · Breakout · 1d
- Multi Filter Trend Breakthrough Smart Moving Average Trading StrategyPine Script · Breakout · 1h
- Pivot Based Volume Weighted Breakout Reversal StrategyPine Script · Breakout · 1d
- Multi Strategy Adaptive Trend Following and Breakout Trading SystemPine Script · Breakout · 1d
- Multi Trend Breakout Momentum Trading StrategyPine Script · Breakout · 1d