Multi Timeframe EMA Trend Momentum Trading Strategy
This is a quantitative trading strategy that combines multi-timeframe EMA trend following with momentum analysis. The strategy primarily analyzes the alignment of 20, 50, 100, and 200-day exponential moving averages…
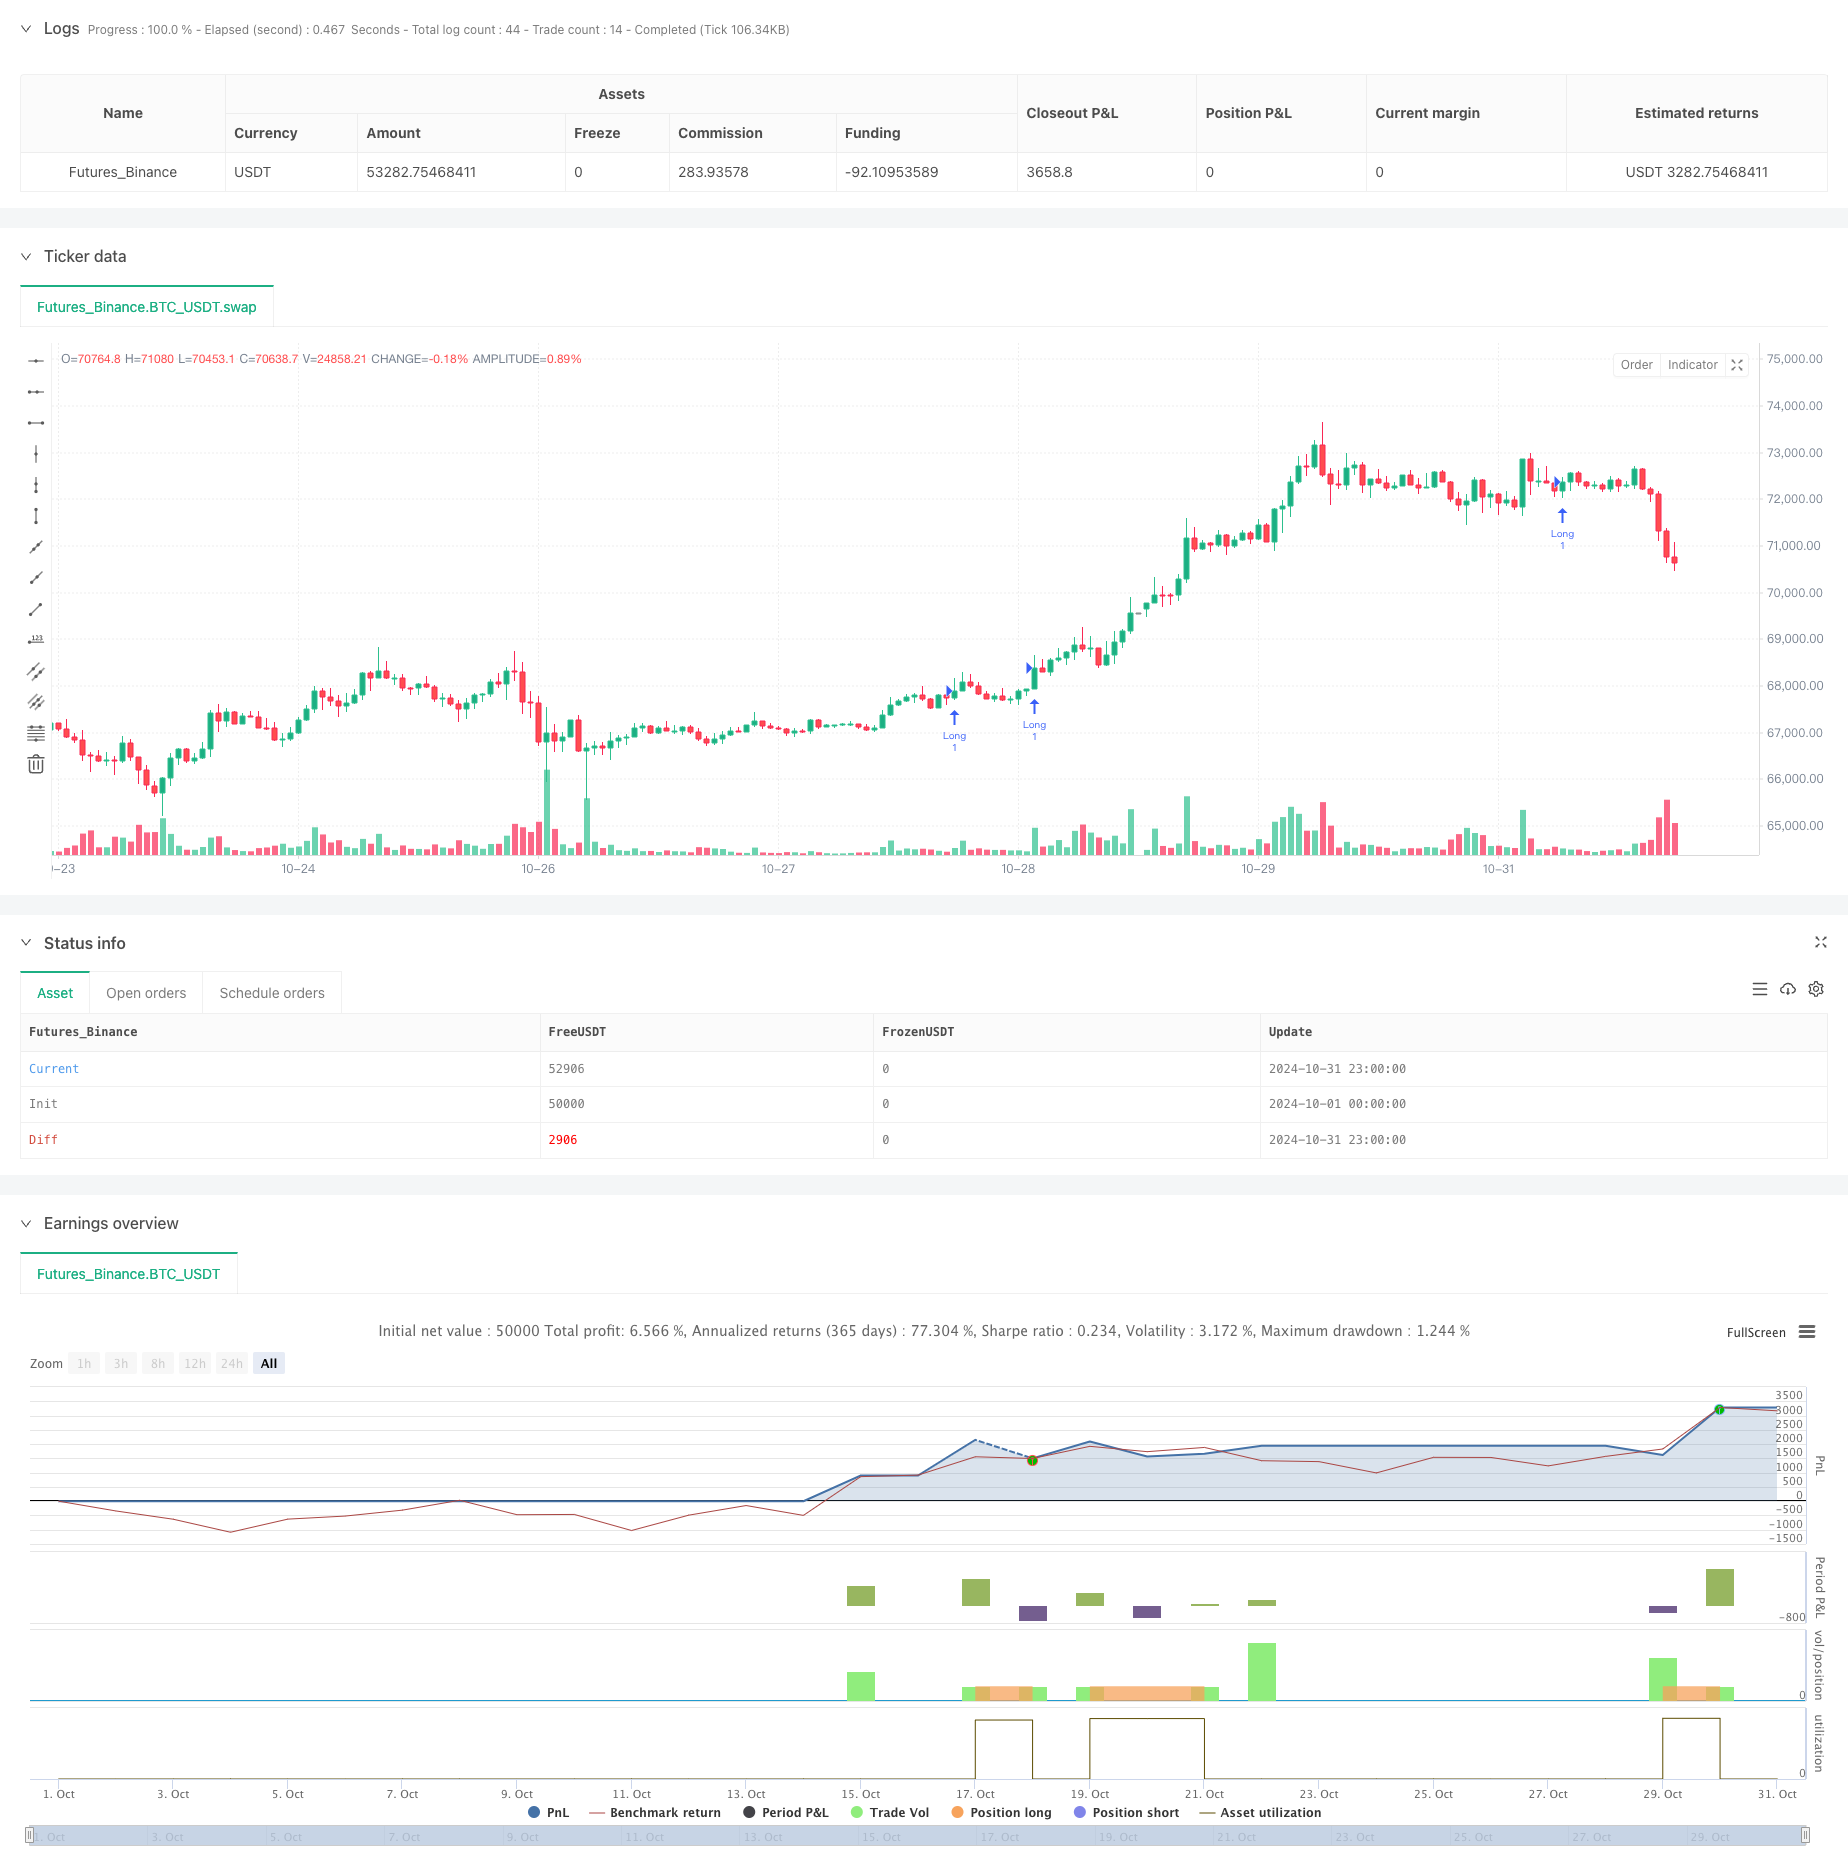
Overview
This is a quantitative trading strategy that combines multi-timeframe EMA trend following with momentum analysis. The strategy primarily analyzes the alignment of 20, 50, 100, and 200-day exponential moving averages (EMA) combined with momentum indicators on both daily and weekly timeframes. It employs ATR-based stop losses and enters trades when EMAs are aligned and momentum conditions are met, managing risk through ATR-multiple stop-loss and profit targets.
Strategy Principles
The core logic includes several key components:
- EMA Alignment System: Requires 20-day EMA above 50-day EMA, which is above 100-day EMA, which is above 200-day EMA, forming a perfect bullish alignment.
- Momentum Confirmation System: Calculates custom momentum indicators based on linear regression on both daily and weekly timeframes. This momentum is measured through linear regression of price deviation from the Keltner Channel midline.
- Pullback Entry System: Price must pull back within a specified percentage range of the 20-day EMA for entry, avoiding chase-buying.
- Risk Management System: Uses ATR multiples to set stop-loss and profit targets, defaulting to 1.5x ATR for stop-loss and 3x ATR for profit target.
Strategy Advantages
- Multiple Confirmation Mechanism: Reduces false signals through multiple conditions including EMA alignment, multi-timeframe momentum, and price pullback.
- Scientific Risk Management: Uses ATR to dynamically adjust stop-loss and profit targets, adapting to market volatility changes.
- Trend Following with Momentum: Captures major trends while optimizing entry timing within trends.
- High Customizability: All strategy parameters can be optimized for different market characteristics.
- Multi-timeframe Analysis: Improves signal reliability through daily and weekly timeframe coordination.
Strategy Risks
- EMA Lag: EMAs as lagging indicators may result in delayed entries. Consider incorporating leading indicators.
- Poor Performance in Ranging Markets: Strategy may generate frequent false signals in sideways markets. Consider adding market environment filters.
- Drawdown Risk: Despite ATR stops, significant drawdowns possible in extreme conditions. Consider implementing maximum drawdown limits.
- Parameter Sensitivity: Strategy performance is sensitive to parameter settings. Thorough parameter optimization testing recommended.
Optimization Directions
- Market Environment Recognition: Add volatility or trend strength indicators to use different parameter sets in different market conditions.
- Entry Optimization: Add oscillators like RSI for more precise entry points within pullback zones.
- Dynamic Parameter Adjustment: Automatically adjust ATR multiples and pullback ranges based on market volatility.
- Volume Analysis Integration: Confirm trend strength through volume analysis to improve signal reliability.
- Machine Learning Implementation: Use machine learning algorithms to dynamically optimize parameters and improve strategy adaptability.
Summary
This is a well-designed, logically rigorous trend-following strategy. Through the combination of multiple technical indicators, it ensures both strategy robustness and effective risk management. The strategy's high customizability allows optimization for different market characteristics. While inherent risks exist, the suggested optimization directions can further enhance strategy performance. Overall, this is a quantitative trading strategy worth experimenting with and studying in depth.
Source Pine Script
/*backtest
start: 2024-10-01 00:00:00
end: 2024-10-31 23:59:59
period: 1h
basePeriod: 1h
exchanges: [{"eid":"Futures_Binance","currency":"BTC_USDT"}]
*/

//@version=5
strategy("Swing Trading with EMA Alignment and Custom Momentum", overlay=true)

// User inputs for customization
atrLength = input.int(14, title="ATR Length", minval=1)
atrMultiplierSL = input.float(1.5, title="Stop-Loss Multiplier (ATR)", minval=0.1)   // Stop-loss at 1.5x ATR
atrMultiplierTP = input.float(3.0, title="Take-Profit Multiplier (ATR)", minval=0.1)   // Take-profit at 3x ATR
pullbackRangePercent = input.float(1.0, title="Pullback Range (%)", minval=0.1) // 1% range for pullback around 20 EMA
lengthKC = input.int(20, title="Length for Keltner Channels (Momentum Calculation)", minval=1)

// EMA settings
ema20 = ta.ema(close, 20)
ema50 = ta.ema(close, 50)
ema100 = ta.ema(close, 100)
ema200 = ta.ema(close, 200)

// ATR calculation
atrValue = ta.atr(atrLength)

// Custom Momentum Calculation based on Linear Regression for Daily Timeframe
highestHighKC = ta.highest(high, lengthKC)
lowestLowKC = ta.lowest(low, lengthKC)
smaCloseKC = ta.sma(close, lengthKC)

// Manually calculate the average of highest high and lowest low
averageKC = (highestHighKC + lowestLowKC) / 2

// Calculate daily momentum using linear regression
dailyMomentum = ta.linreg(close - (averageKC + smaCloseKC) / 2, lengthKC, 0) // Custom daily momentum calculation

// Fetch weekly data for momentum calculation using request.security()
[weeklyHigh, weeklyLow, weeklyClose] = request.security(syminfo.tickerid, "W", [high, low, close])

// Calculate weekly momentum using linear regression on weekly timeframe
weeklyHighestHighKC = ta.highest(weeklyHigh, lengthKC)
weeklyLowestLowKC = ta.lowest(weeklyLow, lengthKC)
weeklySmaCloseKC = ta.sma(weeklyClose, lengthKC)
weeklyAverageKC = (weeklyHighestHighKC + weeklyLowestLowKC) / 2

weeklyMomentum = ta.linreg(weeklyClose - (weeklyAverageKC + weeklySmaCloseKC) / 2, lengthKC, 0) // Custom weekly momentum calculation

// EMA alignment condition (20 EMA > 50 EMA > 100 EMA > 200 EMA)
emaAligned = ema20 > ema50 and ema50 > ema100 and ema100 > ema200

// Momentum increasing condition (daily and weekly momentum is positive and increasing)
dailyMomentumIncreasing = dailyMomentum > 0 and dailyMomentum > dailyMomentum[1] //and dailyMomentum[1] > dailyMomentum[2]
weeklyMomentumIncreasing = weeklyMomentum > 0 and weeklyMomentum > weeklyMomentum[1] //and weeklyMomentum[1] > weeklyMomentum[2]

// Redefine Pullback condition: price within 1% range of the 20 EMA
upperPullbackRange = ema20 * (1 + pullbackRangePercent / 100)
lowerPullbackRange = ema20 * (1 - pullbackRangePercent / 100)
pullbackToEma20 = (close <= upperPullbackRange) and (close >= lowerPullbackRange)

// Entry condition: EMA alignment and momentum increasing on both daily and weekly timeframes
longCondition = emaAligned and dailyMomentumIncreasing and weeklyMomentumIncreasing and pullbackToEma20

// Initialize stop loss and take profit levels as float variables
var float longStopLevel = na
var float longTakeProfitLevel = na

// Calculate stop loss and take profit levels based on ATR
if (longCondition)
    longStopLevel := close - (atrMultiplierSL * atrValue)  // Stop loss at 1.5x ATR below the entry price
    longTakeProfitLevel := close + (atrMultiplierTP * atrValue) // Take profit at 3x ATR above the entry price

// Strategy execution
if (longCondition)
    strategy.entry("Long", strategy.long)

// Exit conditions: Stop-loss at 1.5x ATR and take-profit at 3x ATR
if (strategy.position_size > 0)
    strategy.exit("Take Profit/Stop Loss", "Long", stop=longStopLevel, limit=longTakeProfitLevel)
Published by ChaoZhang on the FMZ strategy square · last modified 2024-11-12. Collected in the Quant Trading Vault. Unvalidated research: re-test with your own data and costs before trusting it.
Build this with AgenKit
A spec is not a trading system. Paste this into your coding agent and AgenKit runs a specialist team — architecture, test-first build, risk gates, review — with paper trading on by default.
/agenkit build a production-grade trading bot with a backtest engine, risk controls and paper trading by default from strategies/Multi-Timeframe-EMA-Trend-Momentum-Trading-Strategy.md- npx agenkit install engineering-kit in your project
- Paste the command into your agent and approve each phase
- Get tests, backtest, risk controls and a paper-trading switch
Understand it first
Before you run this, read the lesson behind the idea and how to backtest it honestly. Specs like this one are the survivors of an unknown number of trials; deflate their results accordingly.
Related specs
- Multi Indicator Comprehensive Analysis Quantitative Trading Strategy Trend Momentum and Volatility Collaborative Prediction ModelPine Script · Momentum · 3m
- SSL Momentum Combo Trading StrategyPine Script · Momentum · 2h
- Dynamic Trend Channel and Relative Strength Momentum Trading StrategyPine Script · Momentum · 3h
- KST EMA Momentum Trend Following StrategyPine Script · Momentum · 1d
- Momentum Strategy Based on DEMA and EMA Crossover with ATR Volatility FilterPine Script · Momentum · 1h
- Momentum Trend Optimization Combination StrategyPine Script · Momentum · 1h