Strategy vault / Multi-timeframe
Multi Timeframe Moving Average Combined with Trading Hours Quantitative Trading Strategy
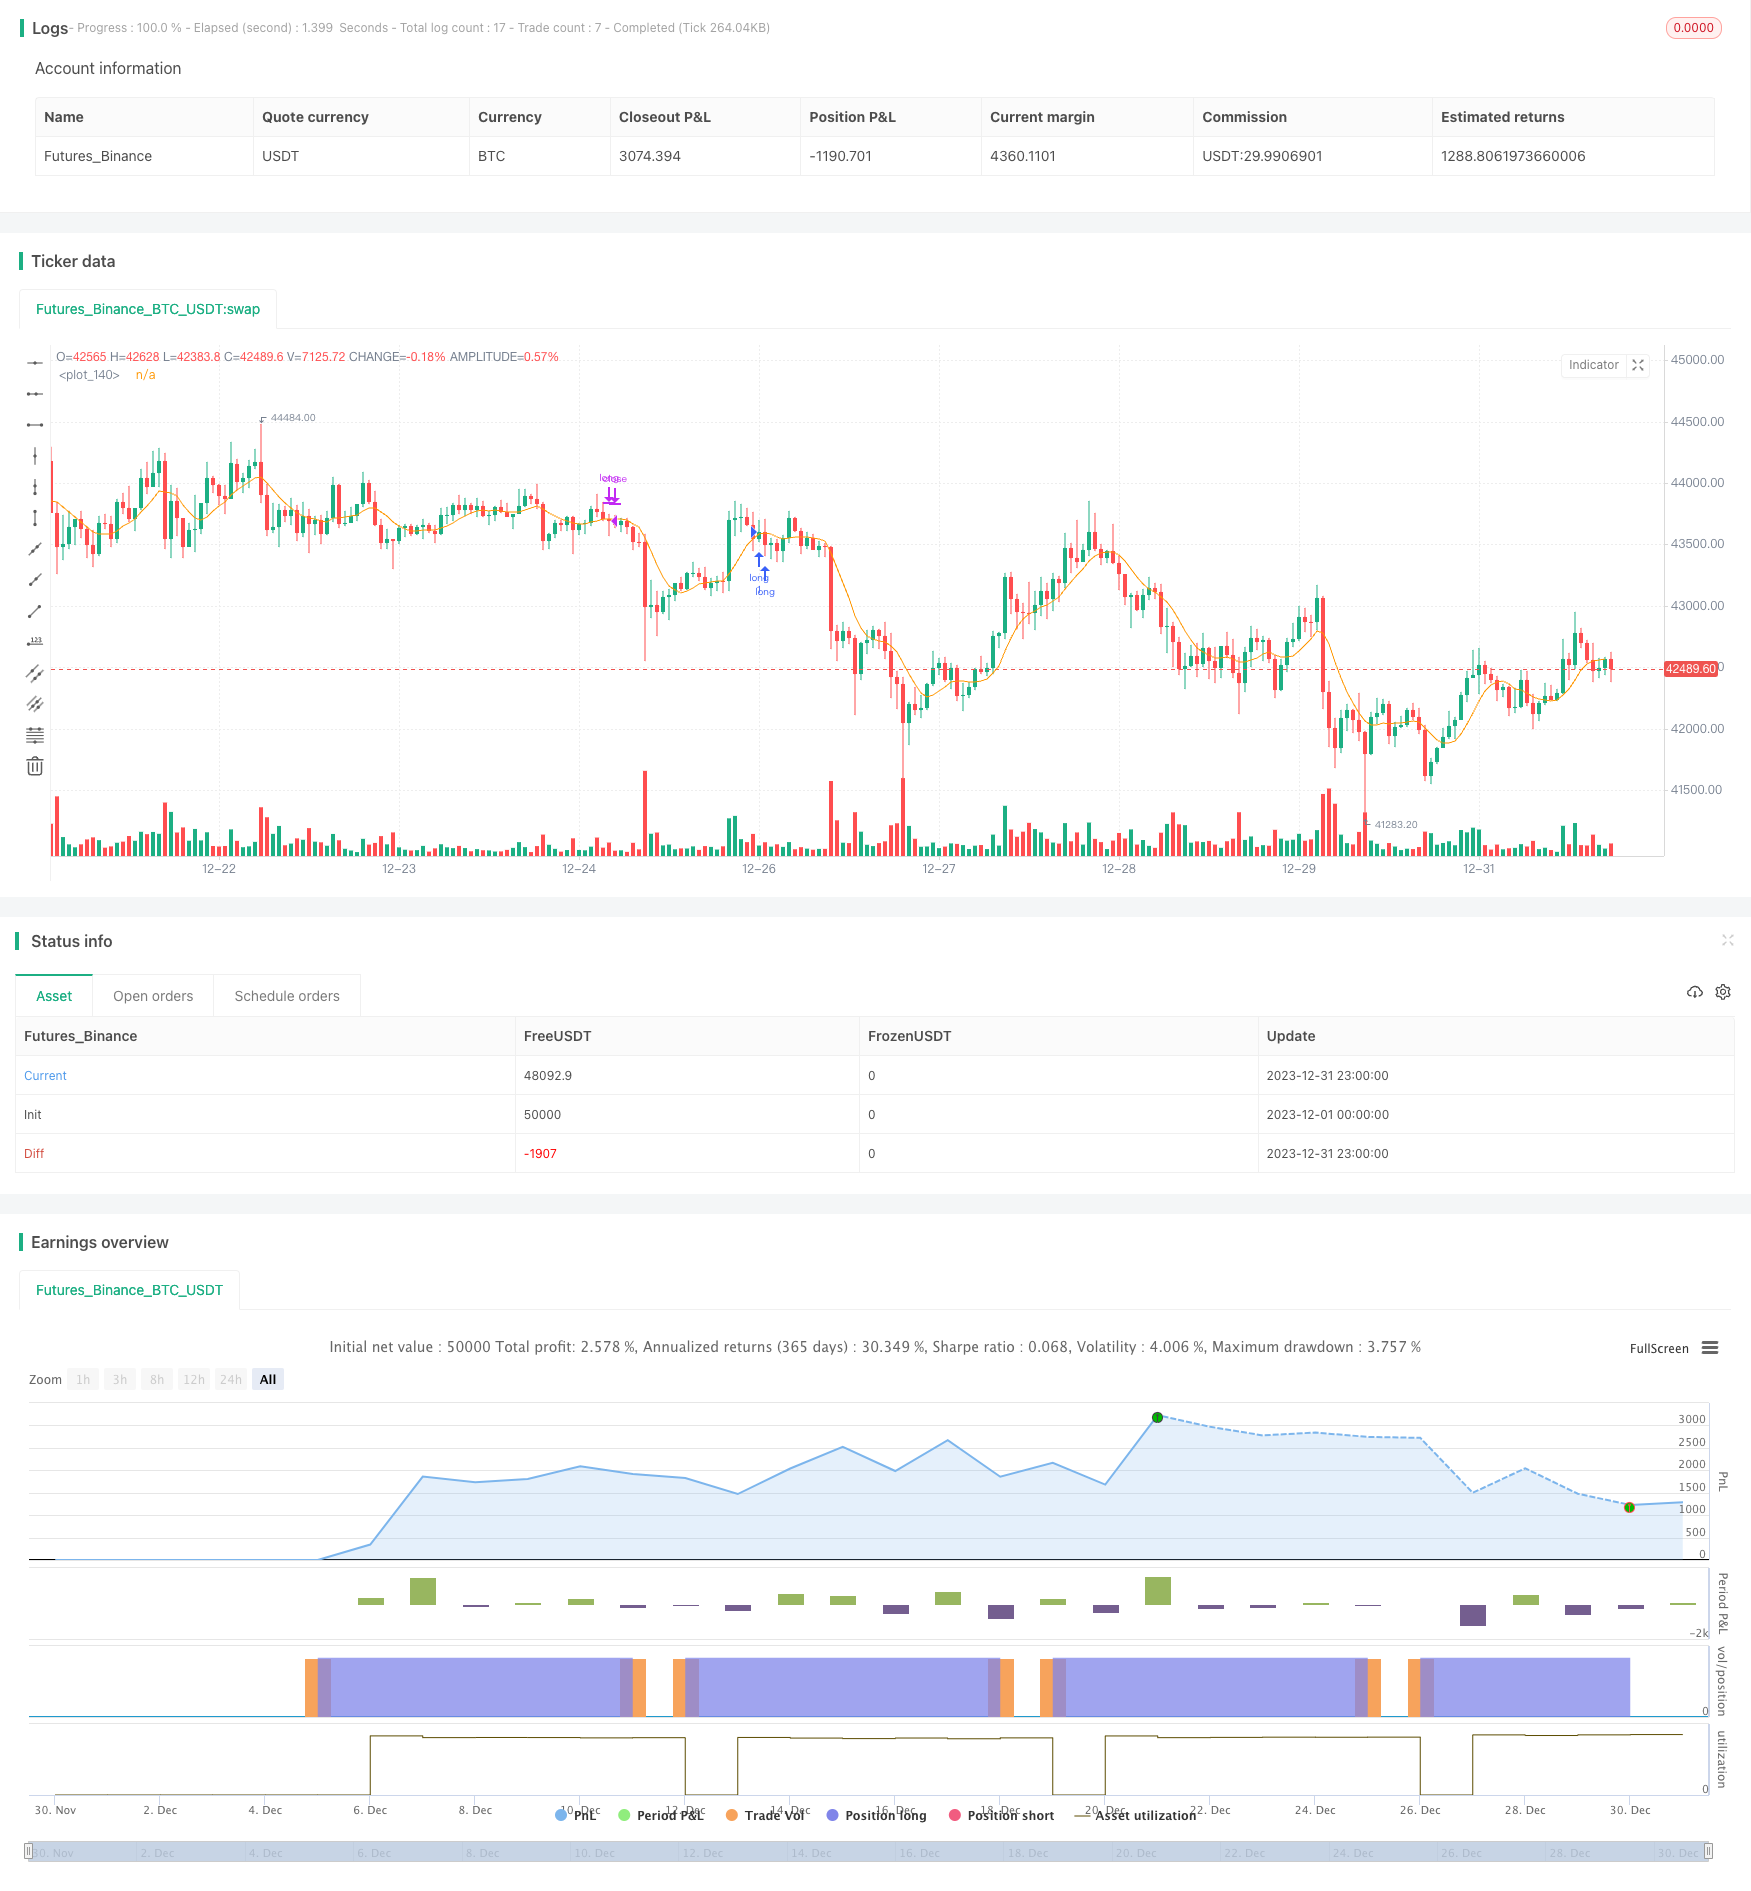
This strategy utilizes multiple moving average indicators and combines entry and exit timing based on trading hours to implement quantitative trading.
Overview
This strategy utilizes multiple moving average indicators and combines entry and exit timing based on trading hours to implement quantitative trading.
Strategy Logic
This strategy incorporates 9 types of moving averages including SMA, EMA, WMA etc. For long entry, the close price crosses above the selected moving average while the previous close was below the moving average. For short entry, the close price crosses below the moving average while the previous close was above. All trades are entered on Monday open only. Exit rules are either fixed take profit/stop loss or close all positions before Sunday close.
Advantage Analysis
This strategy combines the essence of multiple moving averages and users can pick different parameters based on varying market conditions. It only enters when a trend is confirmed, avoiding whipsaws. Also, it limits entries to Monday only and exits on Sunday close with stop loss/take profit, capping maximum trades per week and controlling trading risk.
Risk Analysis
The strategy relies mainly on moving averages to determine trend, thus faces the risk of being caught in reversals. Also, limiting entries to Monday only means missed profitable opportunities if a good setup appears later in the week.
To address these risks, dynamic average parameters could be used to shorten length during ranging periods. Also additional entry days could be allowed, like on Wednesday or Thursday.
Optimization Directions
The strategy can be improved in the following ways:
Add adaptive stop loss/take profit algorithms to dynamically adjust levels.
Incorporate machine learning models to better gauge trend in choppy markets.
Refine entry and exit logic to capture more trading opportunities.
Summary
This strategy combines multiple moving average indicators to determine trend direction and caps maximum weekly trades with Monday entry and Sunday exit rules. Strict stop loss/take profit further limits maximum loss per trade. In summary, it provides robust enhancements in both trend determination and risk control dimensions for quantitative trading.
Parameters
| Name | Default | What it controls |
|---|---|---|
| v_input_bool_1 | true | (?Type of Entries)longEntry |
| v_input_bool_2 | false | shortEntry |
| v_input_source_1_close | 0 | (?Parameters)Source: close | high | low | open | hl2 | hlc3 | hlcc4 | ohlc4 |
| v_input_int_1 | 17 | Moving Averages |
| v_input_string_1 | 0 | MA Type: ALMA | EMA | WMA | SMA | SMMA | LSMA | VWMA | DEMA | HULL | KAMA | FRAMA | VIDYA | JMA | TEMA | ZLEMA | T3 | TRIM |
| v_input_float_1 | 10 | (?Fixed Risk Management)LONG Stop Loss % |
| v_input_float_2 | 30 | LONG Take Profit % |
| v_input_float_3 | 5 | SHORT Stop Loss % |
| v_input_float_4 | 10 | SHORT Take Profit % |
Source Pine Script
/*backtest
start: 2023-12-01 00:00:00
end: 2023-12-31 23:59:59
period: 1h
basePeriod: 15m
exchanges: [{"eid":"Futures_Binance","currency":"BTC_USDT"}]
*/

// This source code is subject to the terms of the Mozilla Public License 2.0 at https://mozilla.org/MPL/2.0/
// © exlux99

//@version=5
strategy('Time MA strategy ', overlay=true)

longEntry = input.bool(true, group="Type of Entries")
shortEntry = input.bool(false, group="Type of Entries")


//==========DEMA
getDEMA(src, len) =>
    dema = 2 * ta.ema(src, len) - ta.ema(ta.ema(src, len), len)
    dema
//==========HMA
getHULLMA(src, len) =>
    hullma = ta.wma(2 * ta.wma(src, len / 2) - ta.wma(src, len), math.round(math.sqrt(len)))
    hullma
//==========KAMA
getKAMA(src, len, k1, k2) =>
    change = math.abs(ta.change(src, len))
    volatility = math.sum(math.abs(ta.change(src)), len)
    efficiency_ratio = volatility != 0 ? change / volatility : 0
    kama = 0.0
    fast = 2 / (k1 + 1)
    slow = 2 / (k2 + 1)
    smooth_const = math.pow(efficiency_ratio * (fast - slow) + slow, 2)
    kama := nz(kama[1]) + smooth_const * (src - nz(kama[1]))
    kama
//==========TEMA
getTEMA(src, len) =>
    e = ta.ema(src, len)
    tema = 3 * (e - ta.ema(e, len)) + ta.ema(ta.ema(e, len), len)
    tema
//==========ZLEMA
getZLEMA(src, len) =>
    zlemalag_1 = (len - 1) / 2
    zlemadata_1 = src + src - src[zlemalag_1]
    zlema = ta.ema(zlemadata_1, len)
    zlema
//==========FRAMA
getFRAMA(src, len) =>
    Price = src
    N = len
    if N % 2 != 0
        N := N + 1
        N
    N1 = 0.0
    N2 = 0.0
    N3 = 0.0
    HH = 0.0
    LL = 0.0
    Dimen = 0.0
    alpha = 0.0
    Filt = 0.0
    N3 := (ta.highest(N) - ta.lowest(N)) / N
    HH := ta.highest(N / 2 - 1)
    LL := ta.lowest(N / 2 - 1)
    N1 := (HH - LL) / (N / 2)
    HH := high[N / 2]
    LL := low[N / 2]
    for i = N / 2 to N - 1 by 1
        if high[i] > HH
            HH := high[i]
            HH
        if low[i] < LL
            LL := low[i]
            LL
    N2 := (HH - LL) / (N / 2)
    if N1 > 0 and N2 > 0 and N3 > 0
        Dimen := (math.log(N1 + N2) - math.log(N3)) / math.log(2)
        Dimen
    alpha := math.exp(-4.6 * (Dimen - 1))
    if alpha < .01
        alpha := .01
        alpha
    if alpha > 1
        alpha := 1
        alpha
    Filt := alpha * Price + (1 - alpha) * nz(Filt[1], 1)
    if bar_index < N + 1
        Filt := Price
        Filt
    Filt
//==========VIDYA
getVIDYA(src, len) =>
    mom = ta.change(src)
    upSum = math.sum(math.max(mom, 0), len)
    downSum = math.sum(-math.min(mom, 0), len)
    out = (upSum - downSum) / (upSum + downSum)
    cmo = math.abs(out)
    alpha = 2 / (len + 1)
    vidya = 0.0
    vidya := src * alpha * cmo + nz(vidya[1]) * (1 - alpha * cmo)
    vidya
//==========JMA
getJMA(src, len, power, phase) =>
    phase_ratio = phase < -100 ? 0.5 : phase > 100 ? 2.5 : phase / 100 + 1.5
    beta = 0.45 * (len - 1) / (0.45 * (len - 1) + 2)
    alpha = math.pow(beta, power)
    MA1 = 0.0
    Det0 = 0.0
    MA2 = 0.0
    Det1 = 0.0
    JMA = 0.0
    MA1 := (1 - alpha) * src + alpha * nz(MA1[1])
    Det0 := (src - MA1) * (1 - beta) + beta * nz(Det0[1])
    MA2 := MA1 + phase_ratio * Det0
    Det1 := (MA2 - nz(JMA[1])) * math.pow(1 - alpha, 2) + math.pow(alpha, 2) * nz(Det1[1])
    JMA := nz(JMA[1]) + Det1
    JMA
//==========T3
getT3(src, len, vFactor) =>
    ema1 = ta.ema(src, len)
    ema2 = ta.ema(ema1, len)
    ema3 = ta.ema(ema2, len)
    ema4 = ta.ema(ema3, len)
    ema5 = ta.ema(ema4, len)
    ema6 = ta.ema(ema5, len)
    c1 = -1 * math.pow(vFactor, 3)
    c2 = 3 * math.pow(vFactor, 2) + 3 * math.pow(vFactor, 3)
    c3 = -6 * math.pow(vFactor, 2) - 3 * vFactor - 3 * math.pow(vFactor, 3)
    c4 = 1 + 3 * vFactor + math.pow(vFactor, 3) + 3 * math.pow(vFactor, 2)
    T3 = c1 * ema6 + c2 * ema5 + c3 * ema4 + c4 * ema3
    T3
//==========TRIMA
getTRIMA(src, len) =>
    N = len + 1
    Nm = math.round(N / 2)
    TRIMA = ta.sma(ta.sma(src, Nm), Nm)
    TRIMA


src = input.source(close, title='Source', group='Parameters')
len = input.int(17, minval=1, title='Moving Averages', group='Parameters')
out_ma_source = input.string(title='MA Type', defval='ALMA', options=['SMA', 'EMA', 'WMA', 'ALMA', 'SMMA', 'LSMA', 'VWMA', 'DEMA', 'HULL', 'KAMA', 'FRAMA', 'VIDYA', 'JMA', 'TEMA', 'ZLEMA', 'T3', 'TRIM'], group='Parameters')
out_ma = out_ma_source == 'SMA' ? ta.sma(src, len) : out_ma_source == 'EMA' ? ta.ema(src, len) : out_ma_source == 'WMA' ? ta.wma(src, len) : out_ma_source == 'ALMA' ? ta.alma(src, len, 0.85, 6) : out_ma_source == 'SMMA' ? ta.rma(src, len) : out_ma_source == 'LSMA' ? ta.linreg(src, len, 0) : out_ma_source == 'VWMA' ? ta.vwma(src, len) : out_ma_source == 'DEMA' ? getDEMA(src, len) : out_ma_source == 'HULL' ? ta.hma(src, len) : out_ma_source == 'KAMA' ? getKAMA(src, len, 2, 30) : out_ma_source == 'FRAMA' ? getFRAMA(src, len) : out_ma_source == 'VIDYA' ? getVIDYA(src, len) : out_ma_source == 'JMA' ? getJMA(src, len, 2, 50) : out_ma_source == 'TEMA' ? getTEMA(src, len) : out_ma_source == 'ZLEMA' ? getZLEMA(src, len) : out_ma_source == 'T3' ? getT3(src, len, 0.7) : out_ma_source == 'TRIM' ? getTRIMA(src, len) : na


plot(out_ma)

long = close> out_ma and close[1] < out_ma and dayofweek==dayofweek.monday
short = close< out_ma and close[1] > out_ma and dayofweek==dayofweek.monday


stopPer = input.float(10.0, title='LONG Stop Loss % ', group='Fixed Risk Management') / 100
takePer = input.float(30.0, title='LONG Take Profit %', group='Fixed Risk Management') / 100

stopPerShort = input.float(5.0, title='SHORT Stop Loss % ', group='Fixed Risk Management') / 100
takePerShort = input.float(10.0, title='SHORT Take Profit %', group='Fixed Risk Management') / 100


longStop = strategy.position_avg_price * (1 - stopPer)
longTake = strategy.position_avg_price * (1 + takePer)

shortStop = strategy.position_avg_price * (1 + stopPerShort)
shortTake = strategy.position_avg_price * (1 - takePerShort)

// strategy.risk.max_intraday_filled_orders(2) // After 10 orders are filled, no more strategy orders will be placed (except for a market order to exit current open market position, if there is any).

if(longEntry)
    strategy.entry("long",strategy.long,when=long )
    strategy.exit('LONG EXIT', "long", limit=longTake, stop=longStop)
    strategy.close("long",when=dayofweek==dayofweek.sunday)

if(shortEntry)
    strategy.entry("short",strategy.short,when=short )
    strategy.exit('SHORT EXIT', "short", limit=shortTake, stop=shortStop)
    strategy.close("short",when=dayofweek==dayofweek.sunday)
Published by ChaoZhang on the FMZ strategy square · last modified 2024-01-12. Collected in the Quant Trading Vault. Unvalidated research: re-test with your own data and costs before trusting it.
Build this with AgenKit
A spec is not a trading system. Paste this into your coding agent and AgenKit runs a specialist team — architecture, test-first build, risk gates, review — with paper trading on by default.
/agenkit build a production-grade trading bot with a backtest engine, risk controls and paper trading by default from strategies/Multi-Timeframe-Moving-Average-Combined-with-Trading-Hours-Quantitative-Trading-Strategy.md- npx agenkit install engineering-kit in your project
- Paste the command into your agent and approve each phase
- Get tests, backtest, risk controls and a paper-trading switch
Understand it first
Before you run this, read the lesson behind the idea and how to backtest it honestly. Specs like this one are the survivors of an unknown number of trials; deflate their results accordingly.
Related specs
- EMA RSI and MACD Based Multi Timeframe Trading StrategyPine Script · Multi-timeframe · 1h
- Low Pyramid Risk Tracking StrategyPine Script · Multi-timeframe · 1d
- MacD Custom Indicator Multiple Time FrameAll Available OptionsPine Script · Multi-timeframe · 1h
- Multi Timeframe Adaptive Dynamic KDJ Indicator StrategyPine Script · Multi-timeframe · 1d
- Multi Timeframe Dynamic Stop Loss EMA Squeeze Trading StrategyPine Script · Multi-timeframe · 1h
- Multi Timeframe Smart Money Concept Support and Resistance Dynamic Trading StrategyPine Script · Multi-timeframe · 2d