Multi Timeframe Moving Average Momentum Trading Strategy
This trading strategy combines multiple moving averages and momentum indicators to identify the direction and strength of trends, establishing positions early in emerging trends, and then optimizing profit and risk…
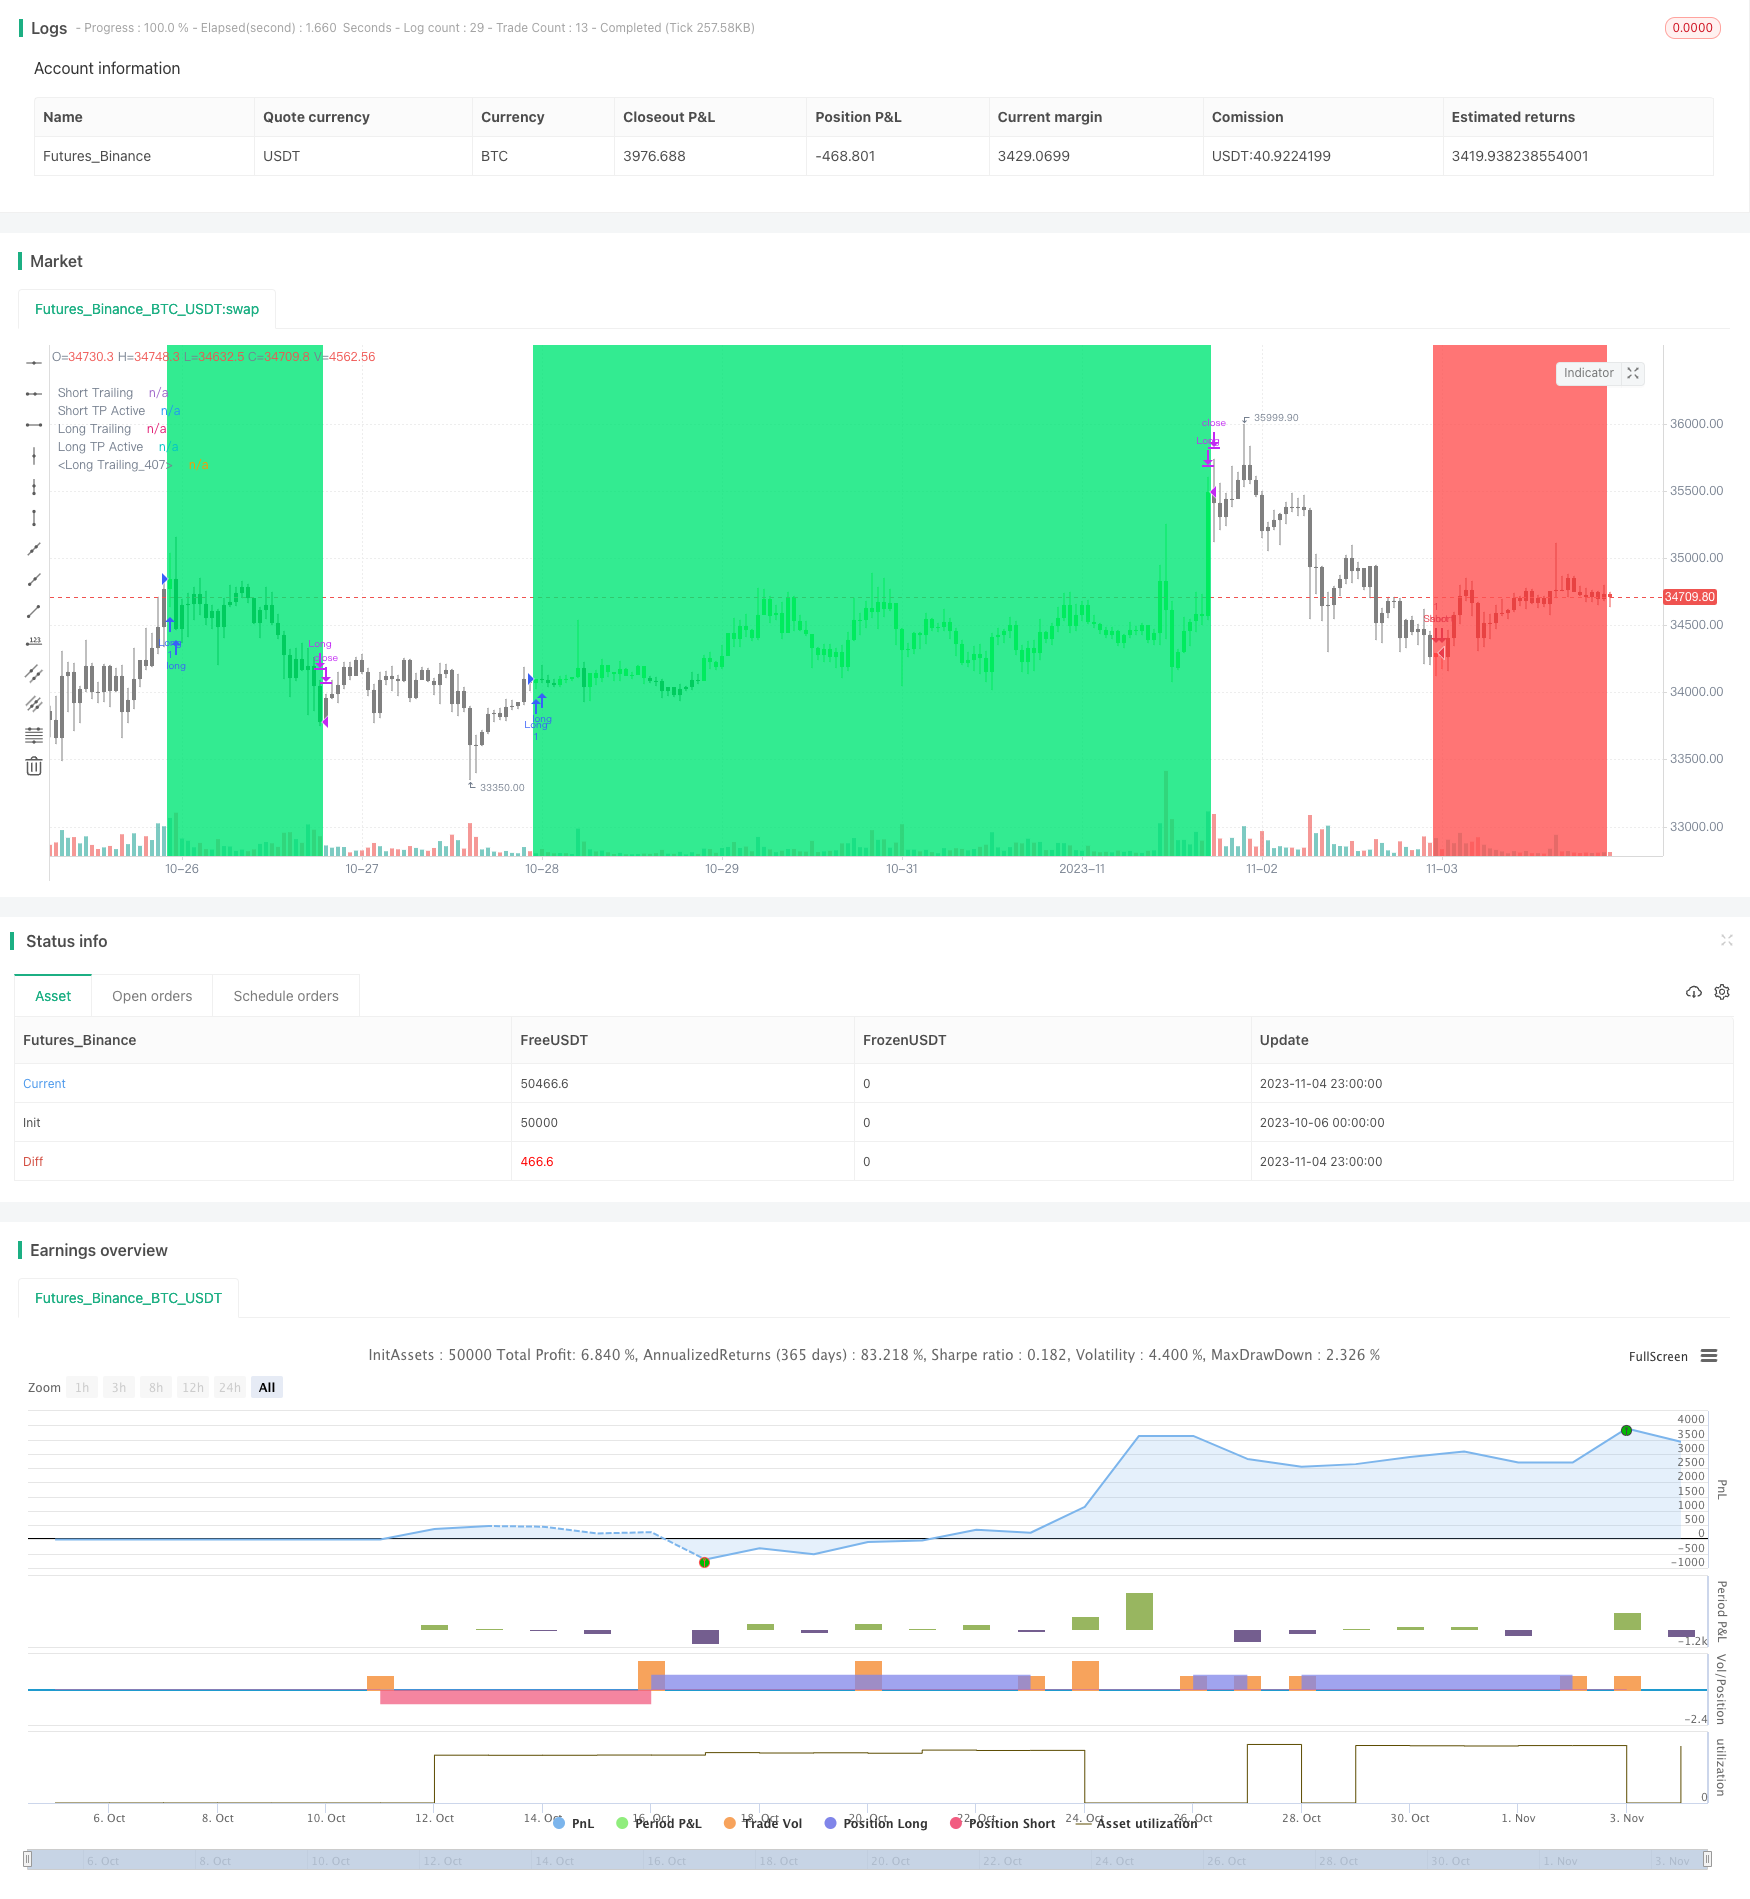
Overview
This trading strategy combines multiple moving averages and momentum indicators to identify the direction and strength of trends, establishing positions early in emerging trends, and then optimizing profit and risk management through the use of trailing stops and take profits. It aims to capture significant price swings during sustained trends.
Strategy Logic
Two sets of moving averages with different parameters are constructed to create fast and slow lines:
- Fast line consists of 5-period EMA and 25-period WMA, representing short-term trend
- Slow line consists of 28-period EMA and 72-period WMA, representing mid- to long-term trend
When fast line crosses above slow line, it signals short-term trend is gaining strength over mid-term trend, and presents entry signal.
RSI filter incorporated, only taking entries at RSI lows (for long) and RSI highs (for short) to avoid false breakouts.
Once entered, trailing stop used to minimize losses, while take profit locks in gains.
When fast line crosses below slow line, it signals trend reversal, prompting exit via stop loss or take profit.
Advantage Analysis
- Dual moving average combinations filter noise and identify trend direction & strength during trend progression.
- Entries established early in emerging trends avoids unnecessary losses from false breakouts.
- RSI filter improves quality of entries.
- Trailing stop compresses losses from individual losing trades.
- Take profit allows sizable profit capture during favorable moves.
Risk Analysis
- Dual moving averages can lag at turning points, missing reversal opportunities.
- Shorten moving average periods for greater sensitivity.
- False breakouts lead to unnecessary entries.
- Incorporate more filters before entry.
- Stop loss / take profit distances not optimized, may be too wide or too narrow.
- Optimize via backtest to find optimal levels.
- Directional strategy only works for trending markets.
- Only employ strategy based on market conditions.
Optimization Directions
- Optimize moving average parameters to find best representations of trend.
- Add trend filters like dynamic ATR stop, momentum oscillators etc.
- Optimize stop loss / take profit parameters.
- Incorporate regime filters based on market conditions.
- Add cross-timeframe analysis using higher timeframes to guide shorter-term strategy direction.
Summary
This strategy integrates moving averages and momentum indicators to identify and establish early entries during emerging trends, while managing risk and reward via timely stops and take profits. Although further parameter and logic optimization is needed to adapt to wider market conditions, it already has a basic framework and directionality for capturing mid- to long-term trends. With continual improvements, this strategy can potentially grow into a robust, efficient trend-following system.
Parameters
| Name | Default | What it controls |
|---|---|---|
| v_input_1 | true | IS This a RENKO Chart |
| v_input_2 | false | Alternate TimeFrame Multiplier (0=none) |
| v_input_3 | false | Show Coloured MA Ribbons |
| v_input_4 | false | Show Ribbon Median MA Lines |
| v_input_5 | 0 | FAST MA Ribbon Type: : EMA | SMA | WMA | VWMA | SMMA | DEMA | TEMA | LAGMA | HullMA | ZEMA | TMA | SSMA |
| v_input_6 | 5 | FAST Ribbon Lower MA Length |
| v_input_7 | 25 | FAST Ribbon Upper Length |
| v_input_8 | 0 | SLOW MA Ribbon Type: : EMA | SMA | WMA | VWMA | SMMA | DEMA | TEMA | LAGMA | HullMA | ZEMA | TMA | SSMA |
| v_input_9 | 28 | SLOW Ribbon Lower MA Length |
| v_input_10 | 72 | SLOW Ribbon Upper Length |
| v_input_11 | 2018 | Backtest Start Year |
| v_input_12 | true | Backtest Start Month |
| v_input_13 | true | Backtest Start Day |
| v_input_14 | 0.02 | start |
| v_input_15 | 0.02 | increment |
| v_input_16 | 0.2 | maximum |
| v_input_17 | false | Use Opposite Trade as a Close Signal |
| v_input_18 | true | Colour Candles to Trade Order state |
| v_input_19 | 0 | What type of Orders: Longs+Shorts | LongsOnly | ShortsOnly | Flip |
| v_input_20 | true | Trailing Stop |
| v_input_21 | 3 | Trailing Stop (%) |
| v_input_22 | true | Take Profit |
| v_input_23 | 3 | Take Profit (%) |
| v_input_24 | true | Trailing Profit (%) |
| v_input_25 | false | Stop Loss |
| v_input_26 | 3 | Stop Loss (%) |
Source Pine Script
/*backtest
start: 2023-10-06 00:00:00
end: 2023-11-05 00:00:00
period: 1h
basePeriod: 15m
exchanges: [{"eid":"Futures_Binance","currency":"BTC_USDT"}]
*/

//@version=3
strategy(title="[WAI GUA]", shorttitle="[EOS] 1.0", overlay=true)

//study(title="[WAI GUA]", shorttitle="[EOS] 1.0", overlay=true)


//
// Use Alternate Anchor TF for MAs
uRenko    = input(true, title="IS This a RENKO Chart")
//
anchor     = input(0,minval=0,maxval=1440,title="Alternate TimeFrame Multiplier (0=none)")
//
src          = close //input(close, title="EMA Source")
showRibbons  = input(false,title="Show Coloured MA Ribbons")
showAvgs     = input(false,title="Show Ribbon Median MA Lines")

//
// Fast Ribbon MAs
// Lower MA - type, length
typeF1    = input(defval="EMA", title="FAST MA Ribbon Type: ", options=["SMA", "EMA", "WMA", "VWMA", "SMMA", "DEMA", "TEMA", "LAGMA", "HullMA", "ZEMA", "TMA", "SSMA"])
lenF1     = input(defval=5, title="FAST Ribbon Lower MA Length", minval=1)
gammaF1   = 0.33 //input(defval=0.33,title="Fast MA - Gamma for LAGMA")

// Upper MA - type, length
typeF11   = typeF1 //input(defval="WMA", title="FAST Ribbon Upper MA Type: ", options=["SMA", "EMA", "WMA", "VWMA", "SMMA", "DEMA", "TEMA", "LAGMA", "HullMA", "ZEMA", "TMA", "SSMA"])
lenF11    = input(defval=25, title="FAST Ribbon Upper Length", minval=2)
gammaF11  = 0.77 //input(defval=0.77,title="Slow MA - Gamma for LAGMA")

// Slow Ribbon MAs
// Lower MA - type, length
typeS1   = input(defval="EMA", title="SLOW MA Ribbon Type: ", options=["SMA", "EMA", "WMA", "VWMA", "SMMA", "DEMA", "TEMA", "LAGMA", "HullMA", "ZEMA", "TMA", "SSMA"])
lenS1    = input(defval=28, title="SLOW Ribbon Lower MA Length", minval=1)
gammaS1  = 0.33 //input(defval=0.33,title="Fast MA - Gamma for LAGMA")

// Upper MA - type, length
typeS16   = typeS1 //input(defval="WMA", title="SLOW Ribbon Upper MA Type: ", options=["SMA", "EMA", "WMA", "VWMA", "SMMA", "DEMA", "TEMA", "LAGMA", "HullMA", "ZEMA", "TMA", "SSMA"])
lenS16    = input(defval=72, title="SLOW Ribbon Upper Length", minval=2)
gammaS16  = 0.77 //input(defval=0.77,title="Slow MA - Gamma for LAGMA")

// - Constants
gold = #FFD700

// - FUNCTIONS
// - variant(type, src, len, gamma)
// ReturnMAEnter the selection variable, default isSMA,If Blank or Type.

// SuperSmoother filter
variant_supersmoother(src,len) =>
    a1 = exp(-1.414*3.14159 / len)
    b1 = 2*a1*cos(1.414*3.14159 / len)
    c2 = b1
    c3 = (-a1)*a1
    c1 = 1 - c2 - c3
    v9 = 0.0
    v9 := c1*(src + nz(src[1])) / 2 + c2*nz(v9[1]) + c3*nz(v9[2])
    v9

variant_smoothed(src,len) =>
    v5 = 0.0
    v5 := na(v5[1]) ? sma(src, len) : (v5[1] * (len - 1) + src) / len
    v5

variant_zerolagema(src,len) =>
    ema1 = ema(src, len)
    ema2 = ema(ema1, len)
    v10 = ema1+(ema1-ema2)
    v10

variant_doubleema(src,len) =>
    v2 = ema(src, len)
    v6 = 2 * v2 - ema(v2, len)
    v6

variant_tripleema(src,len) =>
    v2 = ema(src, len)
    v7 = 3 * (v2 - ema(v2, len)) + ema(ema(v2, len), len)               // Triple Exponential
    v7

//calc Laguerre
variant_lag(p,g) =>
    L0 = 0.0
    L1 = 0.0
    L2 = 0.0
    L3 = 0.0
    L0 := (1 - g)*p+g*nz(L0[1])
    L1 := -g*L0+nz(L0[1])+g*nz(L1[1])
    L2 := -g*L1+nz(L1[1])+g*nz(L2[1])
    L3 := -g*L2+nz(L2[1])+g*nz(L3[1])
    f = (L0 + 2*L1 + 2*L2 + L3)/6
    f

// return variant, defaults to SMA
variant(type, src, len, g) =>
    type=="EMA"     ? ema(src,len) :
      type=="WMA"   ? wma(src,len):
      type=="VWMA"  ? vwma(src,len) :
      type=="SMMA"  ? variant_smoothed(src,len) :
      type=="DEMA"  ? variant_doubleema(src,len):
      type=="TEMA"  ? variant_tripleema(src,len):
      type=="LAGMA" ? variant_lag(src,g) :
      type=="HullMA"? wma(2 * wma(src, len / 2) - wma(src, len), round(sqrt(len))) :
      type=="SSMA"  ? variant_supersmoother(src,len) :
      type=="ZEMA"  ? variant_zerolagema(src,len) :
      type=="TMA"   ? sma(sma(src,len),len) :
                      sma(src,len)

// - /variant

// If have anchor specified, calculate the base multiplier.
//mult  = isintraday ? anchor==0 or interval<=0 or interval>=anchor or anchor>1440? 1 : round(anchor/interval) : 1
//mult := isdwm?  1 : mult  // Only available Daily or less
mult = anchor>0 ? anchor : 1

//
high_  = uRenko? max(close,open) : high
low_   = uRenko? min(close,open) : low


//Adjust using anchor multiplierMALength

//Fast MA Ribbon
emaF1 = variant(typeF1, src, lenF1*mult, gammaF1)
emaF11 = variant(typeF11, src, lenF11*mult,gammaF11)
emafast = (emaF1+emaF11)/2 // Average of Upper and Lower MAs
//
//Slow MA Ribbon
emaS1 = variant(typeS1,src, lenS1*mult,gammaS1)
emaS16 = variant(typeS16, src, lenS16*mult, gammaS16)
emaslow = (emaS1+emaS16)/2 // Average of Upper and Lower MAs
//
// Count crossover candles
xup = 0
xdn = 0
fup = 0
fdn = 0
sup = 0
sdn = 0
//
xup := (emafast-emaslow)>0 and (emafast-emaslow)>(emafast[1]-emaslow[1]) ? nz(xup[1])+1 : 0
xdn := (emafast-emaslow)<0 and (emafast-emaslow)<(emafast[1]-emaslow[1]) ? nz(xdn[1])+1 : 0
fup := (emaF1-emaF11)>0 and (emaF1-emaF11)>(emaF1[1]-emaF11[1]) ? nz(fup[1])+1 : 0
fdn := (emaF1-emaF11)<0 and (emaF1-emaF11)<(emaF1[1]-emaF11[1]) ? nz(fdn[1])+1 : 0
sup := (emaS1-emaS16)>0 and (emaS1-emaS16)>(emaS1[1]-emaS16[1]) ? nz(sup[1])+1 : 0
sdn := (emaS1-emaS16)<0 and (emaS1-emaS16)<(emaS1[1]-emaS16[1]) ? nz(sdn[1])+1 : 0

//Fast EMA Final Color Rules
colFinal = fup>=2 ? aqua : fdn>=2 ? blue : gray
//Slow EMA Final Color Rules
colFinal2 = sup>=2 ? lime : sdn>=2 ? red : gray

//Fast EMA Plots
p1=plot(showRibbons?emaF1:na, title="Fast Ribbon Lower MA", style=line, linewidth=1, color=colFinal,transp=10)
p2=plot(showRibbons?emaF11:na, title="Fast Ribbon Upper MA", style=line, linewidth=1, color=colFinal,transp=10)
plot(showAvgs?emafast:na, title="Fast Ribbon Avg MA", style=circles,join=true, linewidth=1, color=gold,transp=10)

//
//fill(p1,p2,color=colFinal, transp=90)

//Slow EMA Plots
p3=plot(showRibbons?emaS1:na, title="Slow Ribbon Lower MA", style=line, linewidth=1, color=colFinal2,transp=10)
p4=plot(showRibbons?emaS16:na, title="Slow Ribbon Upper MA", style=line, linewidth=1, color=colFinal2,transp=10)
plot(showAvgs?emaslow:na, title="Slow Ribbon Avg MA", style=circles,join=true, linewidth=1, color=fuchsia,transp=10)
//
//fill(p3,p4, color=colFinal2, transp=90)

// Generate Buy Sell signals,
buy = 0
sell=0
//
buy  := xup>=2 and sup>=2 and fup>=2 ? nz(buy[1])>0?buy[1]+1  :1 : 0
sell := xdn>=2 and sdn>=2 and fdn>=2 ? nz(sell[1])>0?sell[1]+1 :1 : 0

////////////////////////
//* Backtest period selector *//
////////////////////////

testStartYear = input(2018, "Backtest Start Year",minval=1980)
testStartMonth = input(1, "Backtest Start Month",minval=1,maxval=12)
testStartDay = input(1, "Backtest Start Day",minval=1,maxval=31)
testPeriodStart = timestamp(testStartYear,testStartMonth,testStartDay,0,0)

testStopYear = 9999 //input(9999, "Backtest Stop Year",minval=1980)
testStopMonth = 12 // input(12, "Backtest Stop Month",minval=1,maxval=12)
testStopDay = 31 //input(31, "Backtest Stop Day",minval=1,maxval=31)
testPeriodStop = timestamp(testStopYear,testStopMonth,testStopDay,0,0)

testPeriod() => time >= testPeriodStart and time <= testPeriodStop ? true : false


///////////////
//* RSIStrategy *//
///////////////

//Indicator 1
lowerpc = lowest(low, 21)
upperpc = highest(high, 21)
midpc = avg(upperpc, lowerpc)

//Indicator 2
ma = sma(close, 50)
petd = ema(close,13)
rangema = ema(tr, 50)
upperkc = ma + rangema * 0.25
lowerkc = ma - rangema * 0.25

//Indicator 3
up = rma(max(change(close), 0), 5)
down = rma(-min(change(close), 0), 5)
rsi = down == 0 ? 100 : up == 0 ? 0 : 100 - (100 / (1 + up / down))

// PET-D
petdcolor = close > petd ? green : red
barcolor (petdcolor)


//Slope
SlopeL = midpc > midpc[5]
SlopeS = midpc < midpc[5]

//condition
CL = SlopeL == 1 and close > lowerkc and close < midpc and rsi < 35
CS = SlopeS == 1 and close < upperkc and close > midpc and rsi > 65

//Setup
RsiSL = CL == 1 and CL[1] != 1
RsiSS = CS == 1 and CS[1] != 1

/////////////////////
//* RSAParabolic indicator *//
/////////////////////
start = input(0.02)
increment = input(0.02)
maximum = input(0.2)

psar = sar(start, increment, maximum)

RSALE = false
RSASE = false
if (psar > high)
    RSALE = true
else
    RSALE = false

if (psar < low)
    RSASE = true
else
    RSASE = false


////////////////
//* Strategy component *//
////////////////

AQUA = #00FFFFFF
BLUE = #0000FFFF
RED  = #FF0000FF
LIME = #00FF00FF
GRAY = #808080FF
DARKRED   = #8B0000FF
DARKGREEN = #006400FF
//
fastExit  = input(false,title="Use Opposite Trade as a Close Signal")
clrBars   = input(true,title="Colour Candles to Trade Order state")
orderType = input("Longs+Shorts",title="What type of Orders", options=["Longs+Shorts","LongsOnly","ShortsOnly","Flip"])
//
isLong   = (orderType != "ShortsOnly")
isShort  = (orderType != "LongsOnly")

//////////////////////////
//* Trading status engine *//
//////////////////////////

// Track current trade status
longClose = false, longClose := nz(longClose[1],false)
shortClose = false, shortClose := nz(shortClose[1],false)
tradeState = 0, tradeState := nz(tradeState[1])
tradeState := tradeState==0 ?   buy==1 and (barstate.isconfirmed or barstate.ishistory) and isLong and not longClose and not shortClose? 1 :
                               sell==1  and (barstate.isconfirmed or barstate.ishistory) and isShort and not longClose and not shortClose? -1 :
                          tradeState : tradeState

////////////////////////////////////
//* Set the entry and special exit conditions here *//
////////////////////////////////////

//Enter state, when the state changes direction.
longCondition  = false
shortCondition = false
//longCondition  := longCondition != true ? change(tradeState) and tradeState==1 : true
//shortCondition := shortCondition != true ? change(tradeState) and tradeState==-1 : true
longCondition  := change(tradeState) and tradeState==1
shortCondition := change(tradeState) and tradeState==-1
if orderType=="Flip"
    temp = longCondition
    longCondition  := shortCondition
    shortCondition := temp
//end if

// Sell signal exit
longExitC  =  (emafast[1]<emaslow[1] and open<emaslow[1]) ? 1 : 0
shortExitC = (emafast[1]>emaslow[1] and open>emaslow[1]) ? 1 : 0

// changeExit conditions.
longExit = change(longExitC) and longExitC==1 and tradeState==1
shortExit = change(shortExitC) and shortExitC==1 and tradeState==-1

// -- debugs
//plotchar(tradeState,"tradeState at Event",location=location.bottom, color=#FF0000FF)
//plotchar(longCondition, title="longCondition",color=#FF0000FF)
//plotchar(shortCondition, title="shortCondition",color=#FF0000FF)
//plotchar(tradeState, title="tradeState",color=#006400FF)
// -- /debugs

////////////////////////////////
//======[ Trade entry price ]======//
////////////////////////////////

last_open_longCondition = na
last_open_shortCondition = na
last_open_longCondition := longCondition ? close : nz(last_open_longCondition[1])
last_open_shortCondition := shortCondition ? close : nz(last_open_shortCondition[1])

////////////////////////////
//======[ Location Status ]======//
////////////////////////////

in_longCondition  = tradeState == 1
in_shortCondition = tradeState == -1

////////////////////////
//======[ Tail stop ]======//
////////////////////////

isTS = input(true, "Trailing Stop")
ts = input(3.0, "Trailing Stop (%)", minval=0,step=0.1, type=float) /100

last_high = na
last_low = na
last_high_short = na
last_low_long = na
last_high := not in_longCondition ? na : in_longCondition and (na(last_high[1]) or high_ > nz(last_high[1])) ? high_ : nz(last_high[1])
last_high_short := not in_shortCondition ? na : in_shortCondition and (na(last_high[1]) or high_ > nz(last_high[1])) ? high_ : nz(last_high[1])
last_low := not in_shortCondition ? na : in_shortCondition and (na(last_low[1]) or low_ < nz(last_low[1])) ? low_ : nz(last_low[1])
last_low_long := not in_longCondition ? na : in_longCondition and (na(last_low[1]) or low_ < nz(last_low[1])) ? low_ : nz(last_low[1])

long_ts =  isTS and in_longCondition and not na(last_high) and (low_ <= last_high - last_high * ts) //and (last_high >= last_open_longCondition + last_open_longCondition * tsi)
short_ts = isTS and in_shortCondition and not na(last_low) and (high_ >= last_low + last_low * ts) //and (last_low <= last_open_shortCondition - last_open_shortCondition * tsi)


////////////////////////
//======[ Profit ]======//
////////////////////////

isTP = input(true, "Take Profit")
tp = input(3.0, "Take Profit (%)",minval=0,step=0.1,type=float) / 100
ttp = input(1.0, "Trailing Profit (%)",minval=0,step=0.1,type=float) / 100
ttp := ttp>tp ? tp : ttp

long_tp =  isTP and in_longCondition  and (last_high >= last_open_longCondition + last_open_longCondition * tp)   and (low_ <= last_high - last_high * ttp)
short_tp = isTP and in_shortCondition and (last_low <= last_open_shortCondition - last_open_shortCondition * tp) and (high_ >= last_low + last_low * ttp)

////////////////////////////
//======[ Stop loss ]======//
////////////////////////////

isSL = input(false, "Stop Loss")
sl = input(3.0, "Stop Loss (%)", minval=0,step=0.1, type=float) / 100
long_sl =  isSL and in_longCondition and (low_ <= last_open_longCondition - last_open_longCondition * sl)
short_sl = isSL and in_shortCondition and (high_ >= last_open_shortCondition + last_open_shortCondition * sl)

////////////////////////
//======[ Confrontation ]======//
////////////////////////

//Note: short exit signals are not forceful; no need to exert effort if the wedge continues.
long_sos = (fastExit or (not isTS and not isSL)) and longExit and in_longCondition
short_sos = (fastExit or (not isTS and not isSL)) and shortExit and in_shortCondition

////////////////////////////
//======[ Close signal ]======//
////////////////////////////

// Create a single shutdown for all different shutdown conditions, all conditions here are not repainted.
longClose :=  isLong and (long_tp or long_sl or long_ts or long_sos) and not longCondition
shortClose := isShort and (short_tp or short_sl or short_ts or short_sos) and not shortCondition
////////////////////////////
//======[ Plot color ]======//
////////////////////////////

longCloseCol = na
shortCloseCol = na
longCloseCol := long_tp ? green : long_sl ? maroon : long_ts ? purple : long_sos ? orange :longCloseCol[1]
shortCloseCol := short_tp ? green : short_sl ? maroon : short_ts ? purple : short_sos ? orange : shortCloseCol[1]
//
tpColor = isTP and in_longCondition ? lime : isTP and in_shortCondition ? lime : na
slColor = isSL and in_longCondition ? red : isSL and in_shortCondition ? red : na


//////////////////////////////////
//======[ Strategy chart ]======//
//////////////////////////////////

plot(isTS and in_longCondition?
     last_high - last_high * ts : na, "Long Trailing", fuchsia, style=2, linewidth=2,offset=1)
plot(isTP and in_longCondition and last_high < last_open_longCondition + last_open_longCondition * tp ?
     last_open_longCondition + last_open_longCondition * tp : na, "Long TP Active", tpColor, style=3,join=false, linewidth=2,offset=1)
plot(isTP and in_longCondition and last_high >= last_open_longCondition +  last_open_longCondition * tp ?
     last_high - last_high * ttp : na, "Long Trailing", black, style=2, linewidth=2,offset=1)
plot(isSL and in_longCondition and last_low_long > last_open_longCondition - last_open_longCondition * sl ?
     last_open_longCondition - last_open_longCondition * sl : na, "Long SL", slColor, style=3,join=false, linewidth=2,offset=1)

plot(isTS and in_shortCondition?
     last_low + last_low * ts : na, "Short Trailing", fuchsia, style=2, linewidth=2,offset=1)
plot(isTP and in_shortCondition and last_low > last_open_shortCondition - last_open_shortCondition * tp ?
     last_open_shortCondition - last_open_shortCondition * tp : na, "Short TP Active", tpColor, style=3,join=false, linewidth=2,offset=1)
plot(isTP and in_shortCondition and last_low <= last_open_shortCondition -  last_open_shortCondition * tp ?
     last_low + last_low * ttp : na, "Short Trailing", black, style=2, linewidth=2,offset=1)
plot(isSL and in_shortCondition and last_high_short < last_open_shortCondition + last_open_shortCondition * sl ?
     last_open_shortCondition + last_open_shortCondition * sl : na, "Short SL", slColor, style=3,join=false, linewidth=2,offset=1)

bclr = not clrBars ? na : tradeState==0 ? GRAY :
                          in_longCondition ? close<last_open_longCondition? DARKGREEN : LIME :
                          in_shortCondition ? close>last_open_shortCondition? DARKRED : RED : GRAY
barcolor(bclr,title="Trade State Bar Colouring")


//////////////////////////////////
//======[ Strategy Entry and Exit ]======//
//////////////////////////////////

if testPeriod() and isLong
    strategy.entry("Long", 1, when=longCondition)
    strategy.close("Long", when=longClose )

if testPeriod() and isShort
    strategy.entry("Short", 0,  when=shortCondition)
    strategy.close("Short", when=shortClose )

// --- Debugs
//plotchar(longExit,title="longExit",location=location.bottom,color=na)
//plotchar(longCondition,title="longCondition",location=location.bottom,color=na)
//plotchar(in_longCondition,title="in_longCondition",location=location.bottom,color=na)
//plotchar(longClose,title="longClose",location=location.bottom,color=na,color=na)
//plotchar(buy,title="buy",location=location.bottom,color=na)
// --- /Debugs
//Change Background When Opening Position
bgcolor( in_longCondition ? lime : na, transp=90)
bgcolor( in_shortCondition ? red : na, transp=90)

////////////////////////////
//======[ Reset variables ]======//
////////////////////////////


if longClose or not in_longCondition
    last_high := na
    last_high_short := na

if shortClose or not in_shortCondition
    last_low := na
    last_low_long := na

if longClose or shortClose
    tradeState := 0
    in_longCondition := false
    in_shortCondition := false


//plotchar(tradeState,"tradeState at EOF",location=location.bottom, color=na)
// EOFPublished by ChaoZhang on the FMZ strategy square · last modified 2023-11-06. Collected in the Quant Trading Vault. Unvalidated research: re-test with your own data and costs before trusting it.
Build this with AgenKit
A spec is not a trading system. Paste this into your coding agent and AgenKit runs a specialist team — architecture, test-first build, risk gates, review — with paper trading on by default.
/agenkit build a production-grade trading bot with a backtest engine, risk controls and paper trading by default from strategies/Multi-Timeframe-Moving-Average-Momentum-Trading-Strategy.md- npx agenkit install engineering-kit in your project
- Paste the command into your agent and approve each phase
- Get tests, backtest, risk controls and a paper-trading switch
Understand it first
Before you run this, read the lesson behind the idea and how to backtest it honestly. Specs like this one are the survivors of an unknown number of trials; deflate their results accordingly.
Related specs
- Multi Indicator Comprehensive Analysis Quantitative Trading Strategy Trend Momentum and Volatility Collaborative Prediction ModelPine Script · Momentum · 3m
- Advanced Multi Indicator Trend Following and Momentum Quantitative Trading StrategyPine Script · Momentum · 1h
- KST EMA Momentum Trend Following StrategyPine Script · Momentum · 1d
- Multi EMA Trend Momentum Trading Strategy with Risk Management SystemPine Script · Momentum · 1h
- Multi Indicator Trend Momentum Trading Strategy with Dynamic Risk Management SystemPine Script · Momentum · 1h
- Multi Indicator Dynamic Momentum Cross StrategyPine Script · Momentum · 1d