Strategy vault / Multi-timeframe
Multi Timeframe Moving Average Pullback Trading Strategy
This strategy adopts the multi timeframe moving average approach, using the long term moving average to determine the major trend direction while the short term moving average to determine the short term trend…
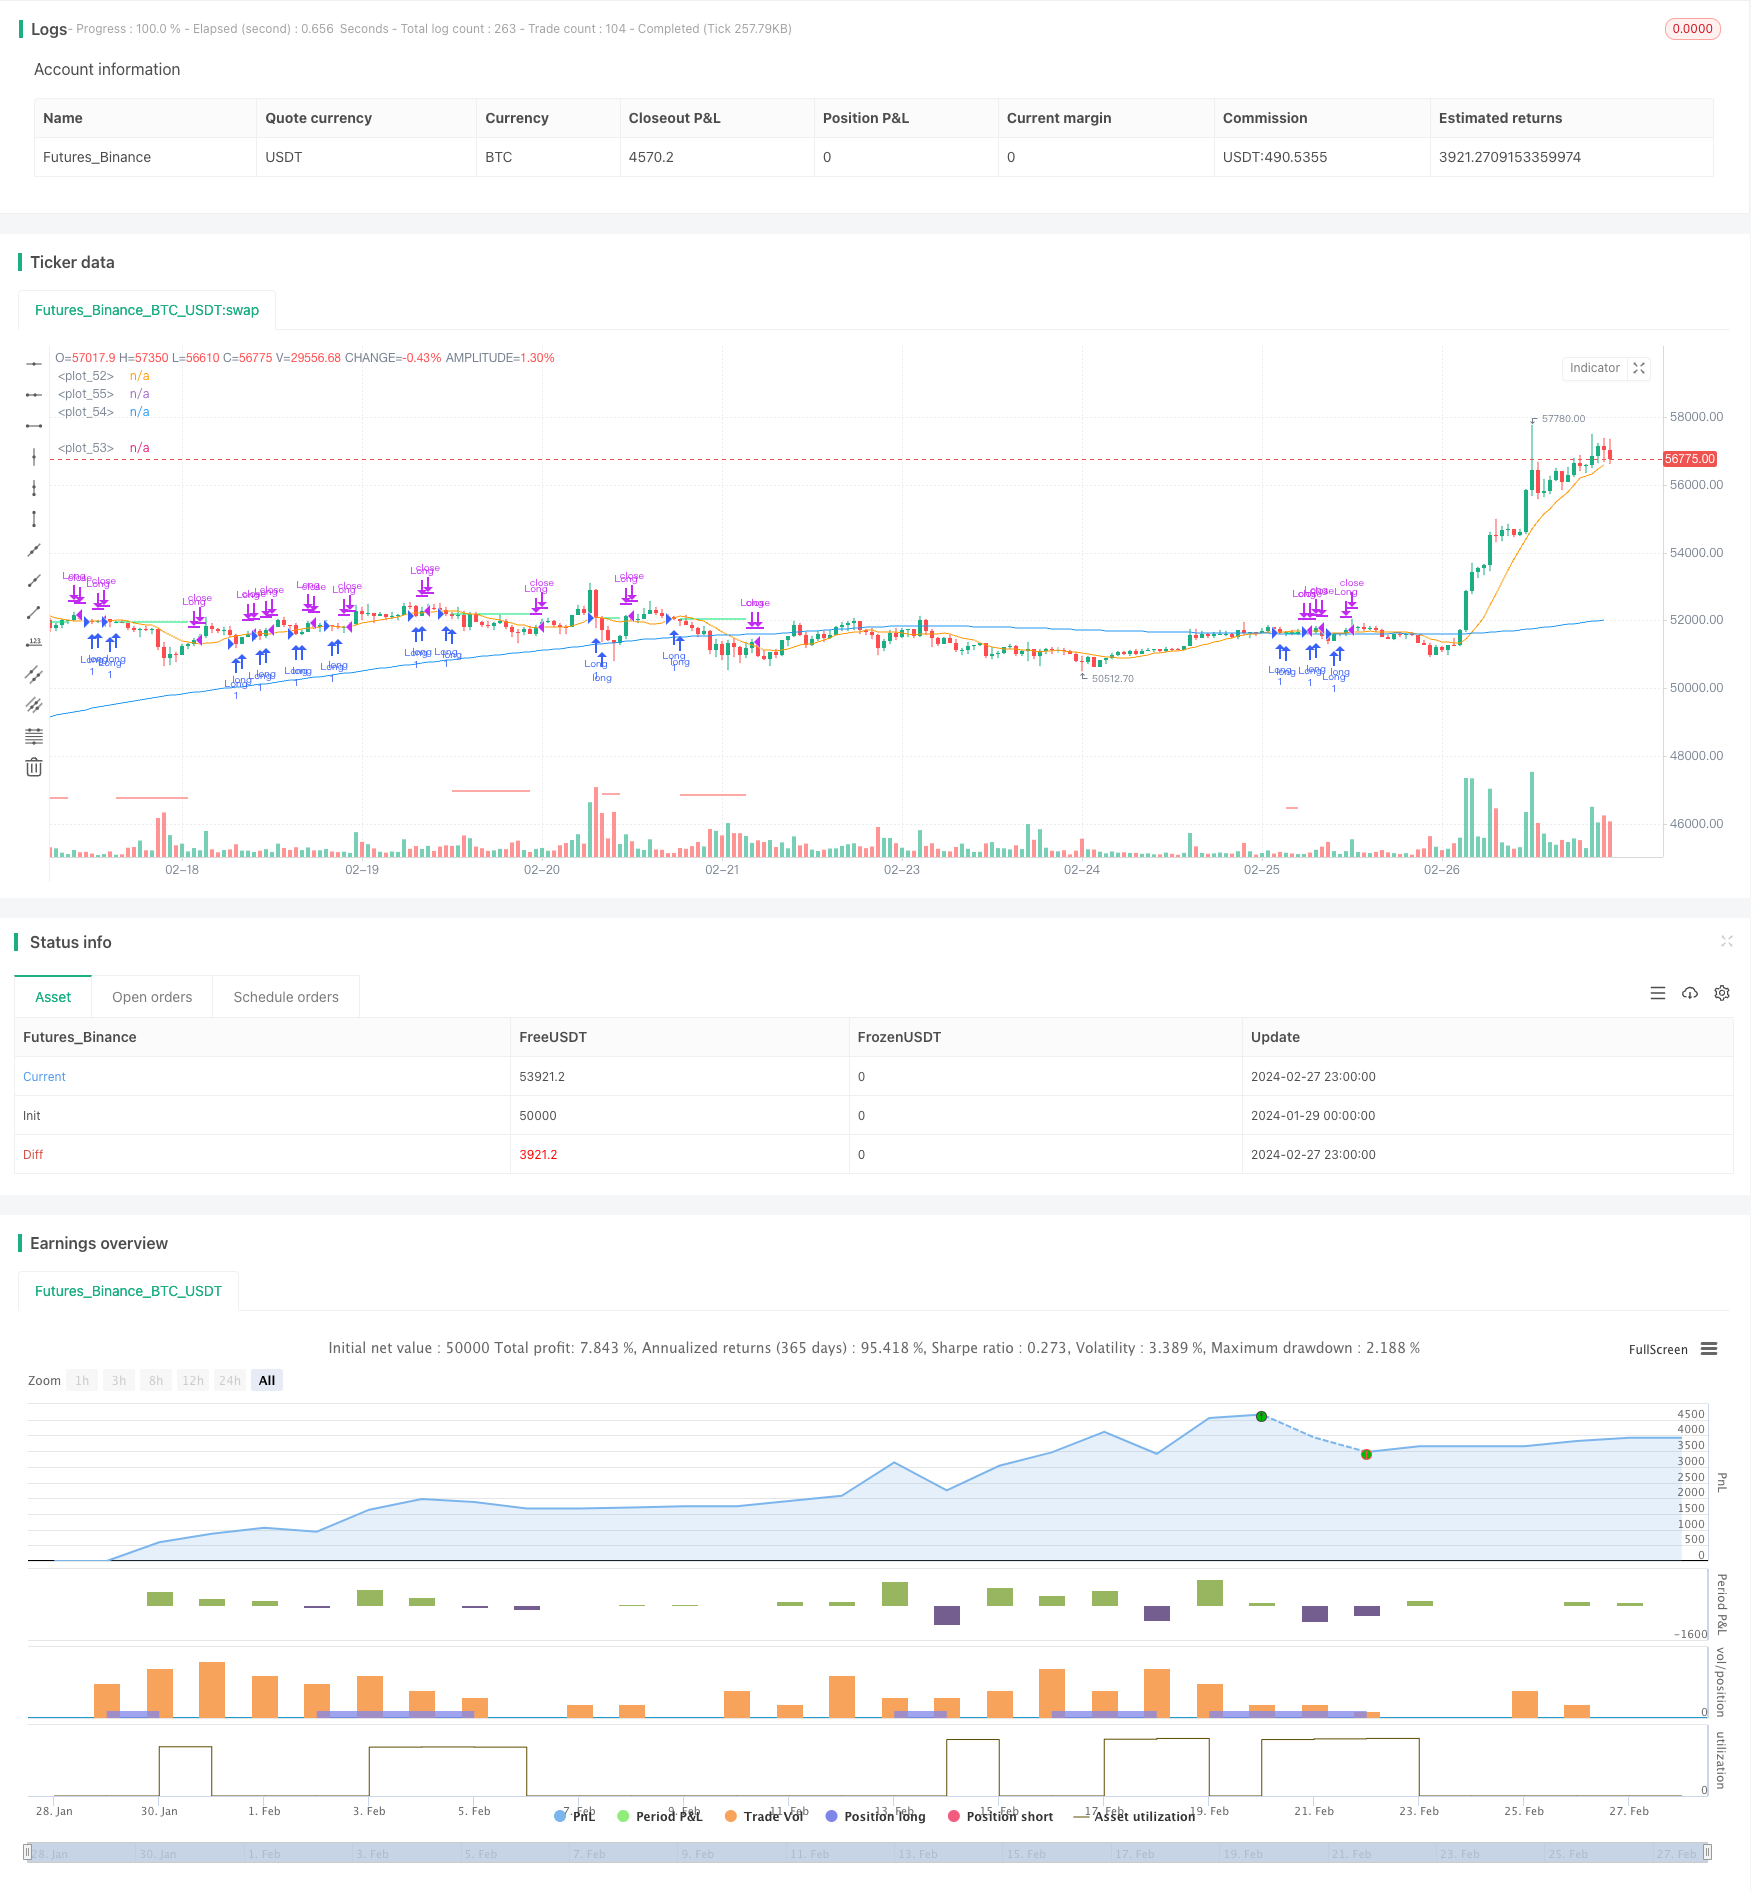
Overview
This strategy adopts the multi timeframe moving average approach, using the long term moving average to determine the major trend direction while the short term moving average to determine the short term trend direction. When the long term trend aligns with the short term trend, positions are taken accordingly. When the short term moving average pulls back to the vicinity of the long term moving average, it indicates a short term correction presenting trading opportunities for the reverse direction. This strategy works best for trending stocks over medium to long term timeframe.
Strategy Logic
The strategy uses the 200-day simple moving average (SMA) to determine the long term trend direction, and the 10-day SMA for the short term trend direction. When the price closes above the 200-day SMA and below the 10-day SMA, it signals an upward long term trend with a short term pullback, presenting buying opportunity. When the price closes below the 200-day SMA and above the 10-day SMA, it signals a downward long term trend with a short term bounce, presenting selling opportunity.
Specifically, when the following conditions are met, long entry is triggered: Close > 200-day SMA AND Close < 10-day SMA. When the following conditions are met, short entry is triggered: Close < 200-day SMA AND Close > 10-day SMA.
After entry, a 10% stop loss mechanism is implemented. The position will be stopped out if the retracement from the entry price exceeds 10%. Also, if the i_lowerClose option is enabled, it will wait for a lower close before exiting, avoiding excessive sensitivity of the stop loss.
Advantage Analysis
This strategy combines multi timeframe moving averages, enabling high probability in capturing the mid to long term trend direction. It provides decent entry timing when the short term SMA pulls back to the long term SMA. Compared to single moving average systems, the probability of being caught in short term corrections is reduced.
The risk involved in this strategy is well defined and capped. A 10% stop loss ratio restricts the maximum loss size. Also the time range filter avoids trading in specified time periods.
Risk Analysis
There is still the risk of being caught in this strategy. If the short term correction lasts too long or the pullback amplitude is too big, the stop loss could be triggered resulting in forced exit at inopportune times. This introduces the risk of loss.
The adaptiveness of this strategy across trading instruments is limited. For stocks with high volatility and prolonged correction periods, this strategy tends to hit stop loss prematurely rendering poor performance.
During major market-wide corrections, e.g. financial crisis, this strategy could suffer big losses. Profitability is improbable during such times.
Optimization Directions
More moving average systems can be introduced to form a multiple filtering mechanism. For example, adding a 50-day SMA, entry positions are considered only when price is between the 50-day SMA and 200-day SMA. This extra filters out stocks with inferior trend characteristics.
A dynamic stop loss mechanism can be implemented. Specifically, after entry, the stop loss ratio is adjusted based on the observed volatility instead of a fixed 10%. This avoids premature trigger of the hard stop loss.
Other indicators gauging market conditions can also be incorporated. For example MACD, when MACD shows market divergence, this strategy could be temporarily deactivated to avoid losses. It adds a market timing mechanism to turn the strategy on and off.
Conclusion
In conclusion this is a typical multi timeframe moving average strategy. It capitalizes on the mid-long term trend direction indicated by the long term moving average, while taking advantage of short term pullback opportunities revealed by the short term moving average. The risk factors are defined and well capped. Further enhancements like additional filters, adaptive stop loss and market timing mechanism could improve its stability.
Parameters
| Name | Default | What it controls |
|---|---|---|
| v_input_int_1 | 200 | (?Strategy Parameters)MA 1 Length |
| v_input_int_2 | 10 | MA 2 Length |
| v_input_float_1 | 0.1 | Stop Loss Percent |
| v_input_bool_1 | false | Exit On Lower Close |
| v_input_1 | timestamp(01 Jan 1995 13:30 +0000) | (?Time Filter)Start Filter |
| v_input_2 | timestamp(1 Jan 2099 19:30 +0000) | End Filter |
Source Pine Script
/*backtest
start: 2024-01-29 00:00:00
end: 2024-02-28 00:00:00
period: 1h
basePeriod: 15m
exchanges: [{"eid":"Futures_Binance","currency":"BTC_USDT"}]
*/

// This Pine Script™ code is subject to the terms of the Mozilla Public License 2.0 at https://mozilla.org/MPL/2.0/
// © irfanp056
// @version=5

strategy("Simple Pullback Strategy",
     overlay=true) // Interactive Brokers rate

// Get user input
i_ma1           = input.int(title="MA 1 Length", defval=200, step=10, group="Strategy Parameters", tooltip="Long-term MA")
i_ma2           = input.int(title="MA 2 Length", defval=10, step=10, group="Strategy Parameters", tooltip="Short-term MA")
i_stopPercent   = input.float(title="Stop Loss Percent", defval=0.10, step=0.1, group="Strategy Parameters", tooltip="Failsafe Stop Loss Percent Decline")
i_lowerClose    = input.bool(title="Exit On Lower Close", defval=false, group="Strategy Parameters", tooltip="Wait for a lower-close before exiting above MA2")
i_startTime     = input(title="Start Filter", defval=timestamp("01 Jan 1995 13:30 +0000"), group="Time Filter", tooltip="Start date & time to begin searching for setups")
i_endTime       = input(title="End Filter", defval=timestamp("1 Jan 2099 19:30 +0000"), group="Time Filter", tooltip="End date & time to stop searching for setups")

// Get indicator values
ma1 = ta.sma(close, i_ma1)
ma2 = ta.sma(close, i_ma2)

// Check filter(s)
f_dateFilter = true

// Check buy/sell conditions
var float buyPrice = 0
buyCondition    = close > ma1 and close < ma2 and strategy.position_size == 0 and f_dateFilter
sellCondition   = close > ma2 and strategy.position_size > 0 and (not i_lowerClose or close < low[1])
stopDistance    = strategy.position_size > 0 ? ((buyPrice - close) / close) : na
stopPrice       = strategy.position_size > 0 ? buyPrice - (buyPrice * i_stopPercent) : na
stopCondition   = strategy.position_size > 0 and stopDistance > i_stopPercent

// Enter positions
if buyCondition
    strategy.entry(id="Long", direction=strategy.long)

if buyCondition[1]
    buyPrice := open

// Exit positions
if sellCondition or stopCondition
    strategy.close(id="Long", comment="Exit" + (stopCondition ? "SL=true" : ""))
    buyPrice := na

// Draw pretty colors
plot(buyPrice, color=color.lime, style=plot.style_linebr)
plot(stopPrice, color=color.red, style=plot.style_linebr, offset=-1)
plot(ma1, color=color.blue)
plot(ma2, color=color.orange)
Published by ChaoZhang on the FMZ strategy square · last modified 2024-02-29. Collected in the Quant Trading Vault. Unvalidated research: re-test with your own data and costs before trusting it.
Build this with AgenKit
A spec is not a trading system. Paste this into your coding agent and AgenKit runs a specialist team — architecture, test-first build, risk gates, review — with paper trading on by default.
/agenkit build a production-grade trading bot with a backtest engine, risk controls and paper trading by default from strategies/Multi-Timeframe-Moving-Average-Pullback-Trading-Strategy.md- npx agenkit install engineering-kit in your project
- Paste the command into your agent and approve each phase
- Get tests, backtest, risk controls and a paper-trading switch
Understand it first
Before you run this, read the lesson behind the idea and how to backtest it honestly. Specs like this one are the survivors of an unknown number of trials; deflate their results accordingly.
Related specs
- EMA RSI and MACD Based Multi Timeframe Trading StrategyPine Script · Multi-timeframe · 1h
- Low Pyramid Risk Tracking StrategyPine Script · Multi-timeframe · 1d
- MacD Custom Indicator Multiple Time FrameAll Available OptionsPine Script · Multi-timeframe · 1h
- Multi Timeframe Adaptive Dynamic KDJ Indicator StrategyPine Script · Multi-timeframe · 1d
- Multi Timeframe Dynamic Stop Loss EMA Squeeze Trading StrategyPine Script · Multi-timeframe · 1h
- Multi Timeframe RSI SRSI Trading StrategyPine Script · Multi-timeframe · 1d