Strategy vault / Multi-timeframe
Multi Timeframe RSI and Stochastics Strategy
The Multi Timeframe RSI and Stochastics Strategy is a strategy that combines RSI and Stochastics indicators across multiple timeframes to determine overbought and oversold conditions in the market. It utilizes the…
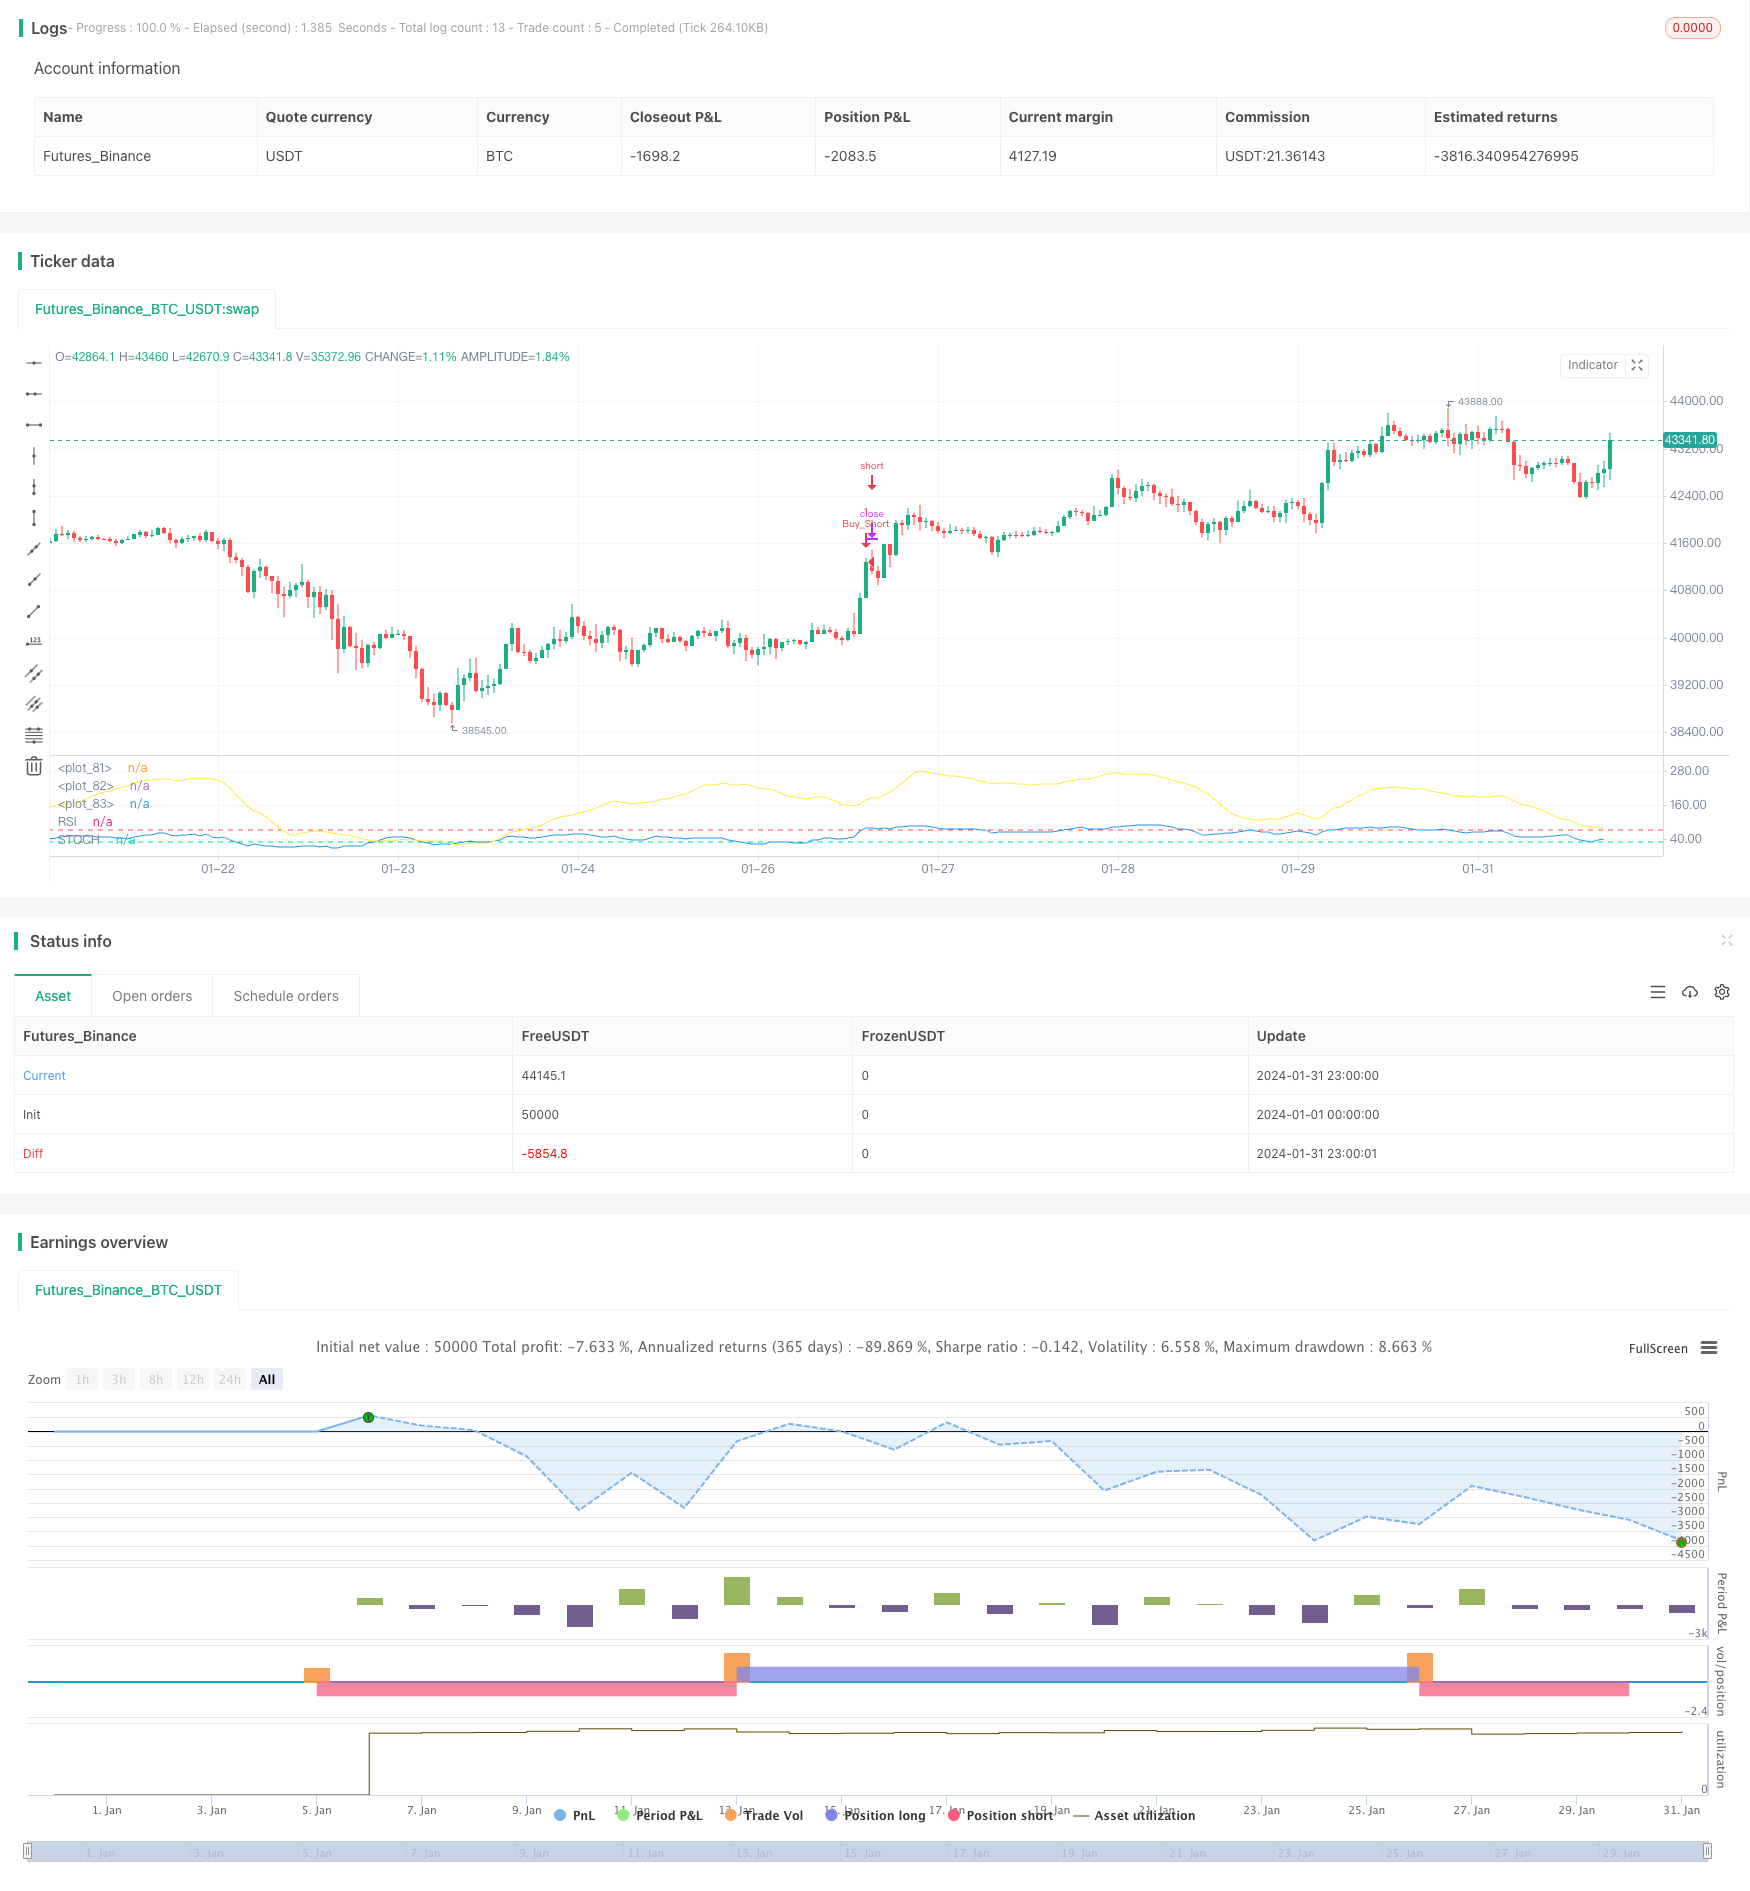
Overview
The Multi Timeframe RSI and Stochastics Strategy is a strategy that combines RSI and Stochastics indicators across multiple timeframes to determine overbought and oversold conditions in the market. It utilizes the average values of RSI and Stochastics from 4 different timeframes to gauge overall market momentum and overextension. This allows it to harness the strengths of indicators across different timeframes.
Strategy Logic
1. RSI Indicator
The RSI indicator is a powerful oscillator that measures overbought and oversold levels based on the magnitude of recent price movements. RSI values fluctuate between 0 to 100, where values over 70 are considered overbought and under 30 oversold.
This strategy uses a 14-period RSI and obtains RSI values from the monthly, daily, 4-hour and 1-hour timeframes.
2. Stochastics %K
Stochastics %K is an indicator that shows overbought/oversold levels in the market on a scale of 0 to 100. Generally, values above 80 indicate an overbought market while values below 20 signal an oversold market.
The strategy uses a 14,3 Stochastics configuration and likewise obtains %K values from the aforementioned timeframes.
3. Average Value Combination
The crux of the strategy lies in taking an average of the two indicators across the multiple timeframes. This allows it to tap on the strengths of each timeframe when gauging overall market conditions. The exact formulas are:
RSI Average = (Monthly RSI + Daily RSI + 4H RSI + 1H RSI) / 4
Stochastics Average = (Monthly Stochastics + Daily Stochastics + 4H Stochastics + 1H Stochastics) / 4
4. Trade Signals
The strategy triggers a long when the RSI average falls below 30 and Stochastics average goes below 20. It triggers a short when the RSI average rises above 70 and Stochastics average breaches 80.
The long position is closed when Stochastics average rises above 70 and RSI average climbs over 50. The short position is closed when Stochastics average dips below 30 and RSI average drops under 50.
Advantage Analysis
The key advantage of this strategy lies in the combination of two indicators across multiple timeframes. This greatly enhances the reliability of trade signals and minimizes false signals. Specific advantages include:
RSI and Stochastics verify each other as signals. Relying solely on one indicator tends to generate false signals more frequently. The dual indicator approach promotes accuracy.
Multiple timeframes lead to more robust analysis. For instance, the monthly and daily timeframes show an overbought market but the smaller timeframes have yet to reach overextension levels. This suggests an uptrend is likely to continue. Signals are more reliable when all timeframes agree.
Clearer identification of structural turning points when multiple timeframes concurrently show a break of key S/R levels, signaling a trend reversal.
Auto-computation of averages simplifies the workflow. No manual calculation needed as the code handles data retrieval, indicator computation and averaging automatically.
Risk Analysis
As with all technical analysis strategies, the core risk lies in whipsaws and false signals. Key risks include:
Trend reversals leading to being stopped out. For instance, prices make a short term breach below support before rebounding while long. Such cases may incur short term losses due to the exit logic.
Invalidation of key S/R leading to failed trailing stops. A break of major S/R levels can directly trigger stops designed below them, resulting in above average losses.
Incorrect judgments from suboptimal timeframe configurations. Overssmoothed or undersmoothed timeframes may provide misleading oscillator values.
Divergence across timeframes causing a Dunkirk effect. Where higher timeframes show an overbought market but lower timeframes signal oversold conditions, rendering averages ineffective.
Solutions involve optimizing stop loss strategies, tracking dynamic S/R levels, adjusting timeframe parameters and adding additional filters.
Enhancement Opportunities
In view of the discussed risks, enhancement opportunities include:
Optimizing the stop loss mechanism to incorporate trailing stops and partial exits. This locks in profits while controlling single trade risks.
Adding higher timeframes like the quarterly chart. This allows larger trend guidance to filter false signals. Prioritize readings from higher timeframes when divergence occurs.
Incorporating volume for additional trend validation via bull/bear divergences to avoid zombie trends.
Fine-tuning entry signals by awaiting breakouts around key historic S/R or allowing for optimal pullback entries.
Implementing adaptive stops based on recent volatility and ATR values for dynamic stop positioning.
Conclusion
The Multi Timeframe RSI and Stochastics Strategy is a clear, reliable approach that uses a combination of RSI and Stochastics across multiple timeframes to identify overbought/oversold levels. Its biggest strength lies in the mutual verification of indicators and timeframes to minimize whipsaw and false signal risks. Nonetheless like all technical strategies, it faces inherent risks that need to be addressed via stop loss optimization, timeframe selections etc to refine it into a stable automated trading strategy.
Parameters
| Name | Default | What it controls |
|---|---|---|
| v_input_int_1 | 80 | (?══════════ General ══════════)Overbought Level |
| v_input_int_2 | 20 | Oversold Level |
| v_input_timeframe_1 | W | (?══════════ Timeframes ══════════)Timeframe 1 |
| v_input_timeframe_2 | D | Timeframe 2 |
| v_input_timeframe_3 | 240 | Timeframe 3 |
| v_input_timeframe_4 | 60 | Timeframe 4 |
| v_input_int_3 | 14 | (?══════════ RSI settings ══════════)RSI length |
| v_input_1_close | 0 | RSI Source: close | high | low | open | hl2 | hlc3 | hlcc4 | ohlc4 |
| v_input_int_4 | 70 | RSI Overbought Level |
| v_input_int_5 | 30 | RSI Oversold Level |
| v_input_int_6 | 14 | (?══════════ Stochastic settings ══════════)%K length |
| v_input_int_7 | 3 | Smooth K |
| v_input_2_close | 0 | Stochastic Source: close | high | low | open | hl2 | hlc3 | hlcc4 | ohlc4 |
| v_input_int_8 | 70 | Stochastic Overbought Level |
| v_input_int_9 | 30 | Stochastic Oversold Level |
Source Pine Script
/*backtest
start: 2024-01-01 00:00:00
end: 2024-01-31 23:59:59
period: 1h
basePeriod: 15m
exchanges: [{"eid":"Futures_Binance","currency":"BTC_USDT"}]
*/

////////////////////////////////////////// MTF Stochastic & RSI Strategy ? ©️ bykzis /////////////////////////////////////////
//

// *** Inspired by "Binance CHOP Dashboard" from @Cazimiro and "RSI MTF Table" from @mobester16 *** and LOT OF COPY of Indicator-Jones MTF Scanner
//
////////////////////////////////////////////////////////////////////////////////////////////////////////////////////////////

//@version=5
strategy('MTF RSI & STOCH Strategy? by kzi', overlay=false,initial_capital=100, currency=currency.USD, commission_value=0.01, commission_type=strategy.commission.percent)


// Pair list
var string GRP1       = '══════════    General    ══════════'
overbought = input.int(80, 'Overbought Level', minval=1, group=GRP1)
oversold = input.int(20, 'Oversold Level', minval=1, group=GRP1)


/// Timeframes
var string GRP2       = '══════════   Timeframes   ══════════'
timeframe1 = input.timeframe(title="Timeframe 1", defval="W", group=GRP2)
timeframe2 = input.timeframe(title="Timeframe 2", defval="D", group=GRP2)
timeframe3 = input.timeframe(title="Timeframe 3", defval="240", group=GRP2)
timeframe4 = input.timeframe(title="Timeframe 4", defval="60", group=GRP2)

// RSI settings
var string GRP3       = '══════════   RSI settings   ══════════'
rsiLength = input.int(14, minval=1, title='RSI length', group=GRP3)
rsiSource = input(close, 'RSI Source', group=GRP3)
rsioverbought = input.int(70, 'RSI Overbought Level', minval=1, group=GRP3)
rsioversold = input.int(30, 'RSI Oversold Level', minval=1, group=GRP3)


/// Get RSI values of each timeframe /////////////////////////////////////////////////////
rsi = ta.rsi(rsiSource, rsiLength)
callRSI(id,timeframe) =>
    rsiValue = request.security(id, str.tostring(timeframe), rsi, gaps=barmerge.gaps_off)
    rsiValue

RSI_TF1 = callRSI(syminfo.tickerid, timeframe1)
RSI_TF2 = callRSI(syminfo.tickerid, timeframe2)
RSI_TF3 = callRSI(syminfo.tickerid, timeframe3)
RSI_TF4 = callRSI(syminfo.tickerid, timeframe4)


/////// Calculate Averages /////////////////////////////////////////////////////////////////
calcAVG(valueTF1, valueTF2, valueTF3, valueTF4) =>
    math.round((valueTF1 + valueTF2 + valueTF3 + valueTF4) / 4, 2)

AVG=calcAVG(RSI_TF1, RSI_TF2, RSI_TF3, RSI_TF4)


// Stochastic settings
var string GRP4       = '══════════   Stochastic settings   ══════════'
periodK = input.int(14, '%K length', minval=1, group=GRP4)
smoothK = input.int(3, 'Smooth K', minval=1, group=GRP4)
stochSource = input(close, 'Stochastic Source', group=GRP4)
stochoverbought = input.int(70, 'Stochastic Overbought Level', minval=1, group=GRP4)
stochoversold = input.int(30, 'Stochastic Oversold Level', minval=1, group=GRP4)


/// Get Stochastic values of each timeframe ////////////////////////////////////////////////
stoch = ta.sma(ta.stoch(stochSource, high, low, periodK), smoothK)
getStochastic(id,timeframe) =>
    stochValue = request.security(id, str.tostring(timeframe), stoch, gaps=barmerge.gaps_off)
    stochValue

Stoch_TF1 = getStochastic(syminfo.tickerid, timeframe1)
Stoch_TF2 = getStochastic(syminfo.tickerid, timeframe2)
Stoch_TF3 = getStochastic(syminfo.tickerid, timeframe3)
Stoch_TF4 = getStochastic(syminfo.tickerid, timeframe4)


AVG_STOCH=calcAVG(Stoch_TF1, Stoch_TF2, Stoch_TF3, Stoch_TF4)


plot(AVG, color = color.blue, title='RSI')
plot(AVG_STOCH, color = color.yellow,title='STOCH')
hline(rsioverbought,color=color.red)
hline(rsioversold, color=color.lime)
hline(50, color=color.white)

//============ signal Generator ==================================//

if AVG <= rsioversold and AVG_STOCH <=stochoversold
    strategy.entry('Buy_Long', strategy.long)


strategy.close("Buy_Long",when=(AVG_STOCH >=70 and AVG >=50 and close >=strategy.position_avg_price),comment="Long_OK")

if AVG >=rsioverbought and AVG_STOCH >=stochoverbought
    strategy.entry('Buy_Short', strategy.short)


strategy.close("Buy_Short",when=(AVG_STOCH <=30 and AVG <=50 and close <=strategy.position_avg_price),comment="Short_OK")


///////////////////////////////////////////////////////////////////////////////////////////
Published by ChaoZhang on the FMZ strategy square · last modified 2024-02-21. Collected in the Quant Trading Vault. Unvalidated research: re-test with your own data and costs before trusting it.
Build this with AgenKit
A spec is not a trading system. Paste this into your coding agent and AgenKit runs a specialist team — architecture, test-first build, risk gates, review — with paper trading on by default.
/agenkit build a production-grade trading bot with a backtest engine, risk controls and paper trading by default from strategies/Multi-Timeframe-RSI-and-Stochastics-Strategy.md- npx agenkit install engineering-kit in your project
- Paste the command into your agent and approve each phase
- Get tests, backtest, risk controls and a paper-trading switch
Understand it first
Before you run this, read the lesson behind the idea and how to backtest it honestly. Specs like this one are the survivors of an unknown number of trials; deflate their results accordingly.
Related specs
- Low Pyramid Risk Tracking StrategyPine Script · Multi-timeframe · 1d
- Multi Timeframe RSI SRSI Trading StrategyPine Script · Multi-timeframe · 1d
- Multi timeframe RSI and Moving Average Trading StrategyPine Script · Multi-timeframe · 1h
- Aggregated Multi timeframe MACD RSI CCI StochRSI MA Linear Trading StrategyPine Script · Multi-timeframe · 1m
- Multi Timeframe MACD StochRSI Combo StrategyPine Script · Multi-timeframe · 1h
- MTF RSI STOCH StrategyPine Script · Multi-timeframe · 1d