Strategy vault / Multi-timeframe
Multi Timeframe RSI SRSI Trading Strategy
This trading strategy combines the Relative Strength Index (RSI) and Stochastic Relative Strength Index (Stochastic RSI) technical indicators to generate trading signals. Additionally, it utilizes the price trend of…
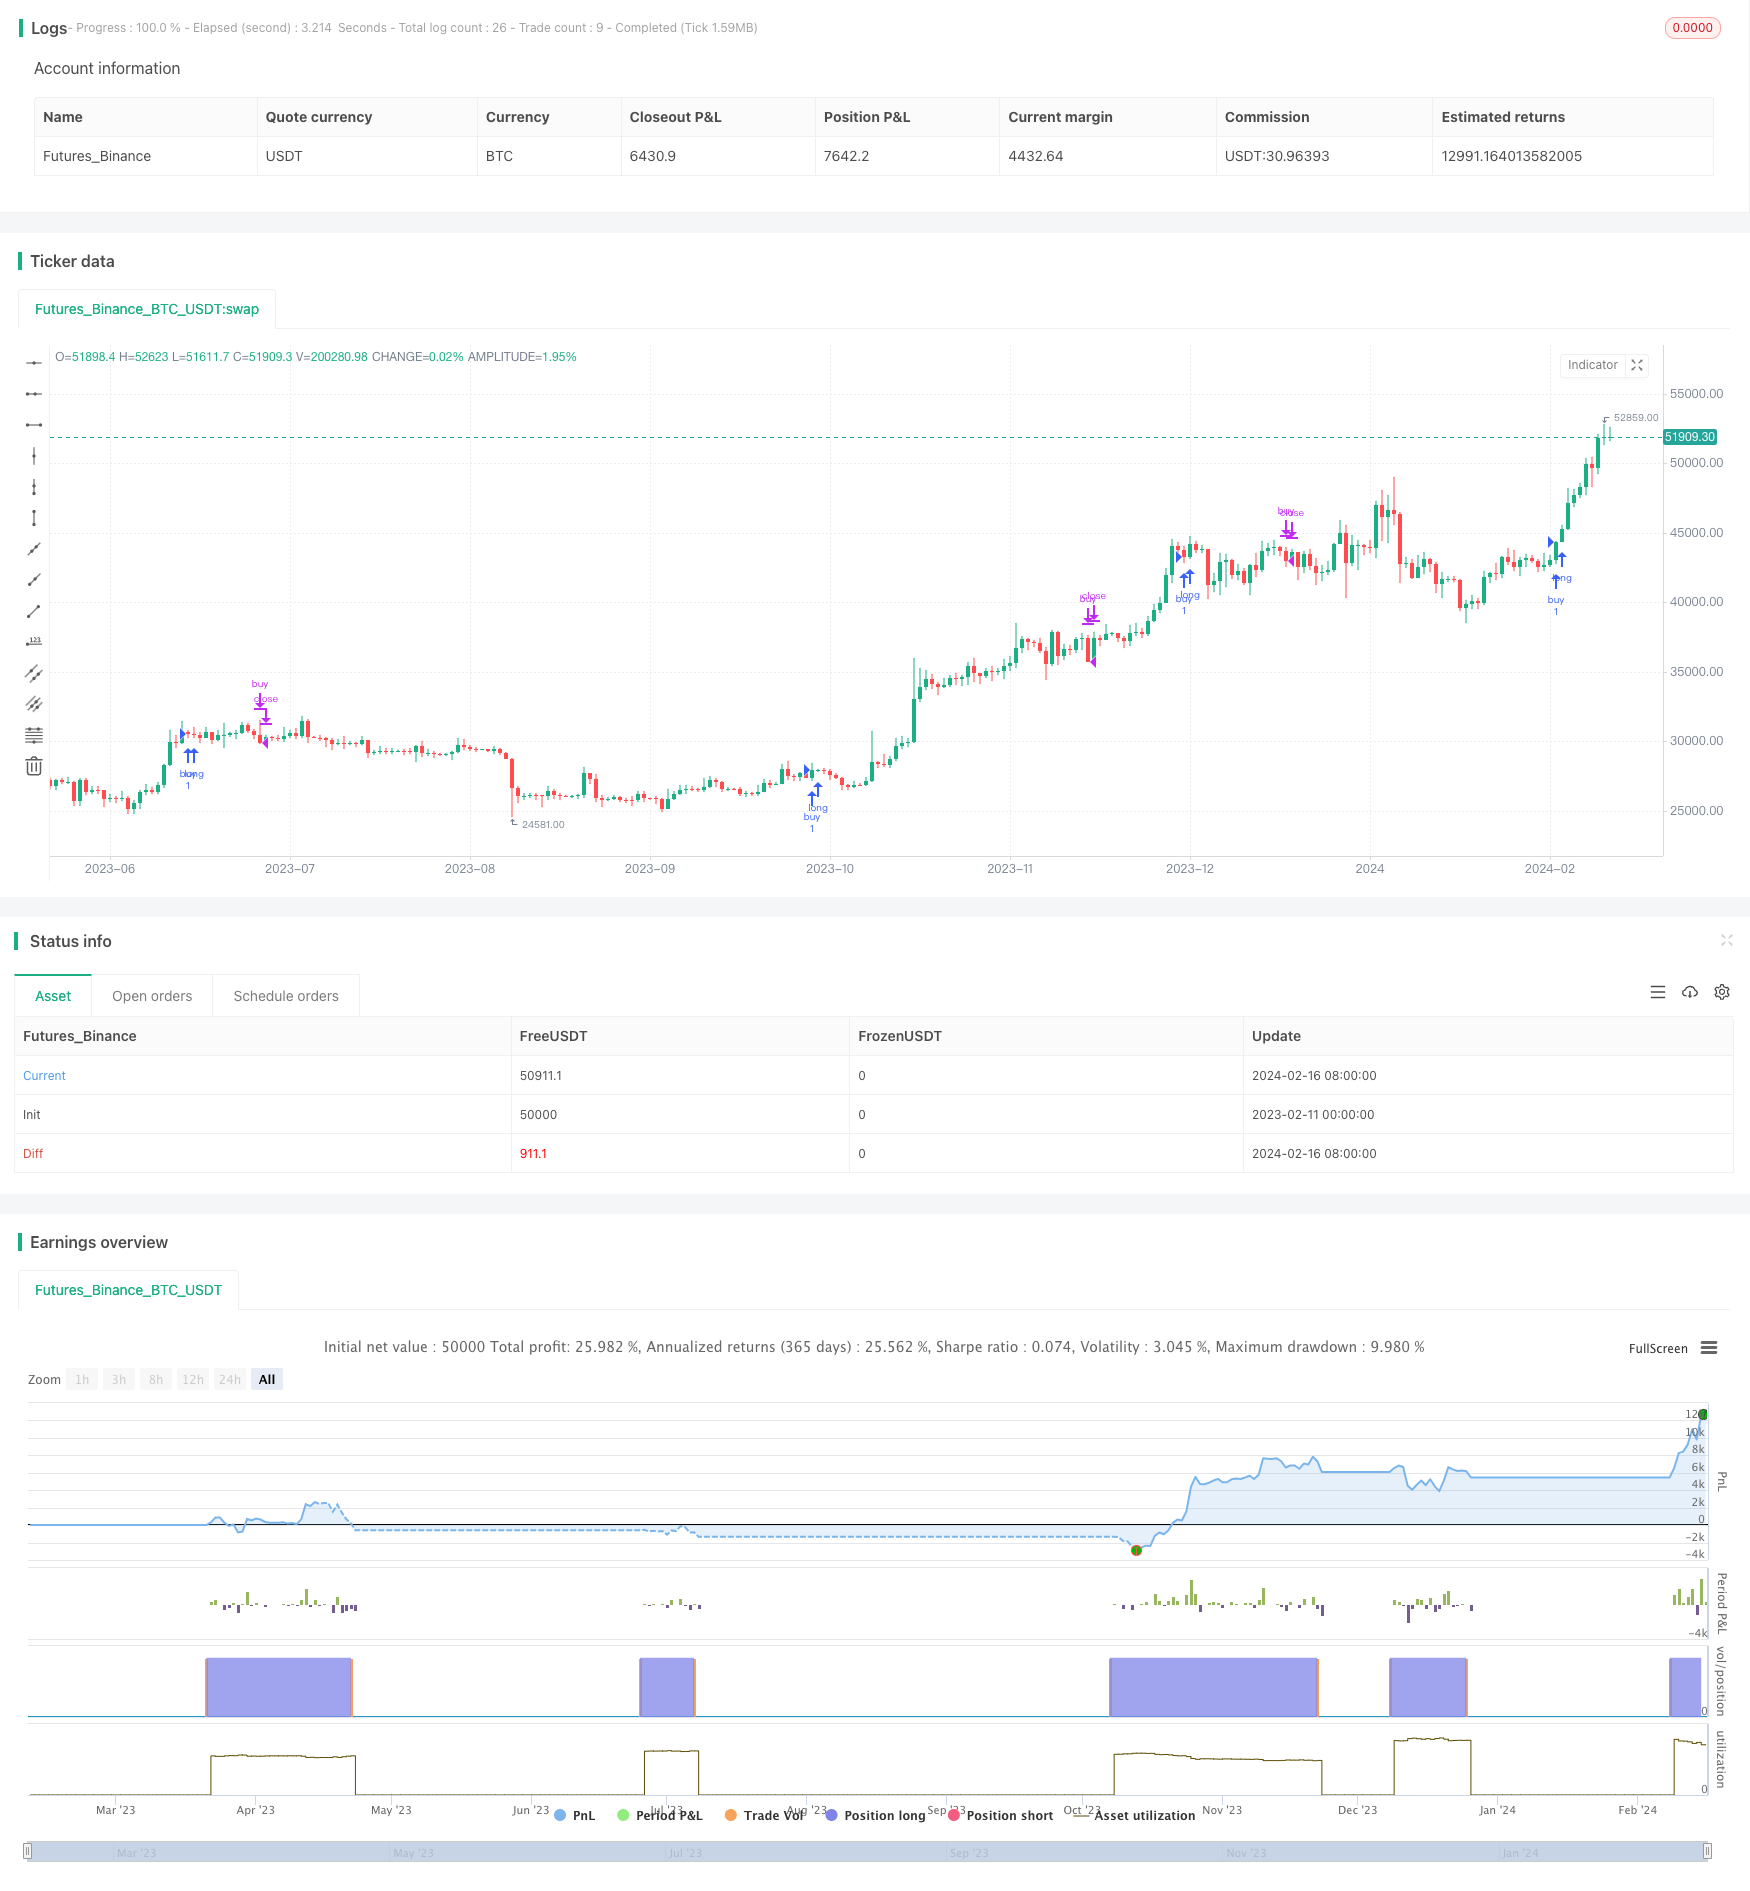
Overview
This trading strategy combines the Relative Strength Index (RSI) and Stochastic Relative Strength Index (Stochastic RSI) technical indicators to generate trading signals. Additionally, it utilizes the price trend of cryptocurrencies in higher timeframes to confirm the trend and increase signal reliability.
Strategy Name
Multi Timeframe RSI-SRSI Trading Strategy
Strategy Logic
The strategy judges overbought and oversold conditions based on RSI values. RSI below 30 is considered oversold signal and RSI above 70 is considered overbought signal. The Stochastic RSI indicator observes the fluctuation of RSI values. Stochastic RSI below 5 is oversold and Stochastic RSI above 50 is overbought.
The strategy also incorporates the price trend of cryptocurrency in higher timeframes (e.g. weekly). Only when higher timeframe RSI is above a threshold (e.g. 45), long signals are triggered. This filters out non-persistent oversold signals when the overall trend is down.
The buy and sell signals need to be confirmed for a number of periods (e.g. 8 bars) before an actual trading signal is generated to avoid fake signals.
Advantages
- Classic technical analysis method using RSI to identify overbought/oversold levels
- Incorporates Stochastic RSI to catch reversals of RSI
- Applies multi-timeframe techniques to filter fake signals and improve quality
Risks & Solutions
- RSI prone to generating false signals
- Combine other indicators to filter fake signals
- Apply trend confirmation techniques
- Improper threshold settings can produce too many signals
- Optimize parameters to find best combination
- Signals need confirmation time
- Balance confirmation periods - filter fake signals without missing opportunities
Enhancement Areas
- Test more indicator combinations for stronger signals
- e.g. incorporate MACD indicator
- Utilize machine learning methods to find optimal parameters
- e.g. genetic algorithms/evolutionary algorithms for automated optimization
- Add stop loss strategies to control single trade risks
- Set stop loss when price breaks support level
Conclusion
The strategy mainly relies on the two classic technical indicators, RSI and Stochastic RSI, to generate trading signals. Additionally, the introduction of trend confirmation from higher timeframes helps filter fake signals effectively and improves signal quality. Further performance improvement can be achieved by optimizing parameters, adding stop loss and other means. The logic is simple and easy to understand. It serves a good starting point for quant trading.
Parameters
| Name | Default | What it controls |
|---|---|---|
| v_input_1 | 14 | RSI Length |
| v_input_2 | 14 | Stochastic Length |
| v_input_3 | 3 | K Smooth |
| v_input_4 | 3 | D Smooth |
| v_input_5 | 5 | Low SRSI |
| v_input_6 | 50 | High SRSI |
| v_input_7 | 5 | difference |
| v_input_8 | 30 | Low RSI |
| v_input_9 | 60 | High RSI |
| v_input_10 | 45 | High higher time frame RSI |
| v_input_11 | 8 | Trigger duration |
| v_input_12 | 20 | Monitoring last low |
| v_input_timeframe_1 | W | Higher time-frame |
| v_input_13 | BTC_USDT:swap | Input Ticker (leave empty for current) |
| v_input_14 | 2019 | Start Year |
| v_input_15 | true | Start Month |
| v_input_16 | true | Start Day |
| v_input_17 | 2030 | End Year |
| v_input_18 | true | End Month |
| v_input_19 | true | End Day |
Source Pine Script
/*backtest
start: 2023-02-11 00:00:00
end: 2024-02-17 00:00:00
period: 1d
basePeriod: 1h
exchanges: [{"eid":"Futures_Binance","currency":"BTC_USDT"}]
*/

//@version=5
strategy("RSI and Stochatic Strategy", overlay=true, use_bar_magnifier = false)


/////// Inputs ///////////////

// RSI and SRSI
rsiLength = input(14, title="RSI Length")
stochLength = input(14, title="Stochastic Length")
kSmooth = input(3, title="K Smooth")
dSmooth = input(3, title="D Smooth")


//////// thresholds ///////////////
st_low = input(5, title="Low SRSI") // stochastic RSI low -- prepare to sell
st_hi = input(50, title="High SRSI") // stochastic RSI high -- prepare to buy
diff = input(5, title="difference") // minimum change in RSI
// inval_diff = input(12, title="difference") // invalidation difference: change in the oposite direction that invalidates rsi falling/rising
rsi_low = input(30, title="Low RSI") // RSI considered low
rsi_hi = input(60, title="High RSI") // RSI considered high
rsi_ht_hi = input(45, title="High higher time frame RSI") // RSI in higher time frame considered high


/// buy trigger duration
tr_dur = input(8, title="Trigger duration")
low_dur = input(20, title="Monitoring last low")


///////////////// Higher time frame trend ///////////////////
// higher time frame resolution
res2 = input.timeframe("W", title="Higher time-frame")
// Input for the ticker symbol, default is an empty string
// For instance we could monitor BTC higher time frame trend
symbol = input("BTC_USDT:swap", "Input Ticker (leave empty for current)")

// Determine the symbol to use
inputSymbol = symbol == "" ? syminfo.tickerid : symbol
//////////////////////////////////////////////////////////

// Calculate RSI //
rsi = ta.rsi(close, rsiLength)

// Calculate Stochastic RSI //
rsiLowest = ta.lowest(rsi, stochLength)
rsiHighest = ta.highest(rsi, stochLength)
stochRsi = 100 * (rsi - rsiLowest) / (rsiHighest - rsiLowest)

// Apply smoothing
K = ta.sma(stochRsi, kSmooth)
D = ta.sma(K, dSmooth)

// Higher time Frame RSI
cl2 = request.security(inputSymbol, res2, close)
rsi2 = ta.rsi(cl2, 14)

// SRSI BUY/SELL signals
sell_stoch = (ta.lowest(K, tr_dur) < st_low) or (ta.highest(rsi, tr_dur) < rsi_low)
buy_stoch = ((ta.lowest(K, tr_dur) > st_hi) or (ta.lowest(rsi, tr_dur) > rsi_hi)) and (rsi2 > rsi_ht_hi)

 // valitation / invalidation sell signal
ll = ta.barssince(not sell_stoch)+1
sell_validation = (ta.highest(rsi, ll)>rsi[ll]+diff and rsi < rsi[ll]) or (rsi < rsi[ll]-diff)

// valitation / invalidation buy signal
llb = ta.barssince(not buy_stoch)+1
buy_validation = (ta.lowest(rsi, llb)<rsi[llb]-diff and rsi > rsi[llb]) or (rsi > rsi_hi and rsi - rsi[tr_dur] > 0)

sell_signal = sell_stoch and sell_validation
buy_signal = buy_stoch and buy_validation

// Define the start date for the strategy
startYear = input(2019, "Start Year")
startMonth = input(1, "Start Month")
startDay = input(1, "Start Day")

// Convert the start date to Unix time
startTime = timestamp(startYear, startMonth, startDay, 00, 00)

// Define the end date for the strategy
endYear = input(2030, "End Year")
endMonth = input(1, "End Month")
endDay = input(1, "End Day")

// Convert the end date to Unix time
endTime = timestamp(endYear, endMonth, endDay, 00, 00)


if true
    if buy_signal
        strategy.entry("buy", strategy.long, comment = "Buy")
    if sell_signal
strategy.close("buy", "Sell")Published by ChaoZhang on the FMZ strategy square · last modified 2024-02-18. Collected in the Quant Trading Vault. Unvalidated research: re-test with your own data and costs before trusting it.
Build this with AgenKit
A spec is not a trading system. Paste this into your coding agent and AgenKit runs a specialist team — architecture, test-first build, risk gates, review — with paper trading on by default.
/agenkit build a production-grade trading bot with a backtest engine, risk controls and paper trading by default from strategies/Multi-Timeframe-RSI-SRSI-Trading-Strategy.md- npx agenkit install engineering-kit in your project
- Paste the command into your agent and approve each phase
- Get tests, backtest, risk controls and a paper-trading switch
Understand it first
Before you run this, read the lesson behind the idea and how to backtest it honestly. Specs like this one are the survivors of an unknown number of trials; deflate their results accordingly.
Related specs
- Multi timeframe RSI and Moving Average Trading StrategyPine Script · Multi-timeframe · 1h
- Aggregated Multi timeframe MACD RSI CCI StochRSI MA Linear Trading StrategyPine Script · Multi-timeframe · 1m
- Multi Timeframe MACD StochRSI Combo StrategyPine Script · Multi-timeframe · 1h
- EMA RSI and MACD Based Multi Timeframe Trading StrategyPine Script · Multi-timeframe · 1h
- Low Pyramid Risk Tracking StrategyPine Script · Multi-timeframe · 1d
- Multi Timeframe Adaptive Market Regime Quantitative Trading StrategyPine Script · Multi-timeframe · 1m