Strategy vault / Multi-timeframe
Multi Timeframe RSI Strategy
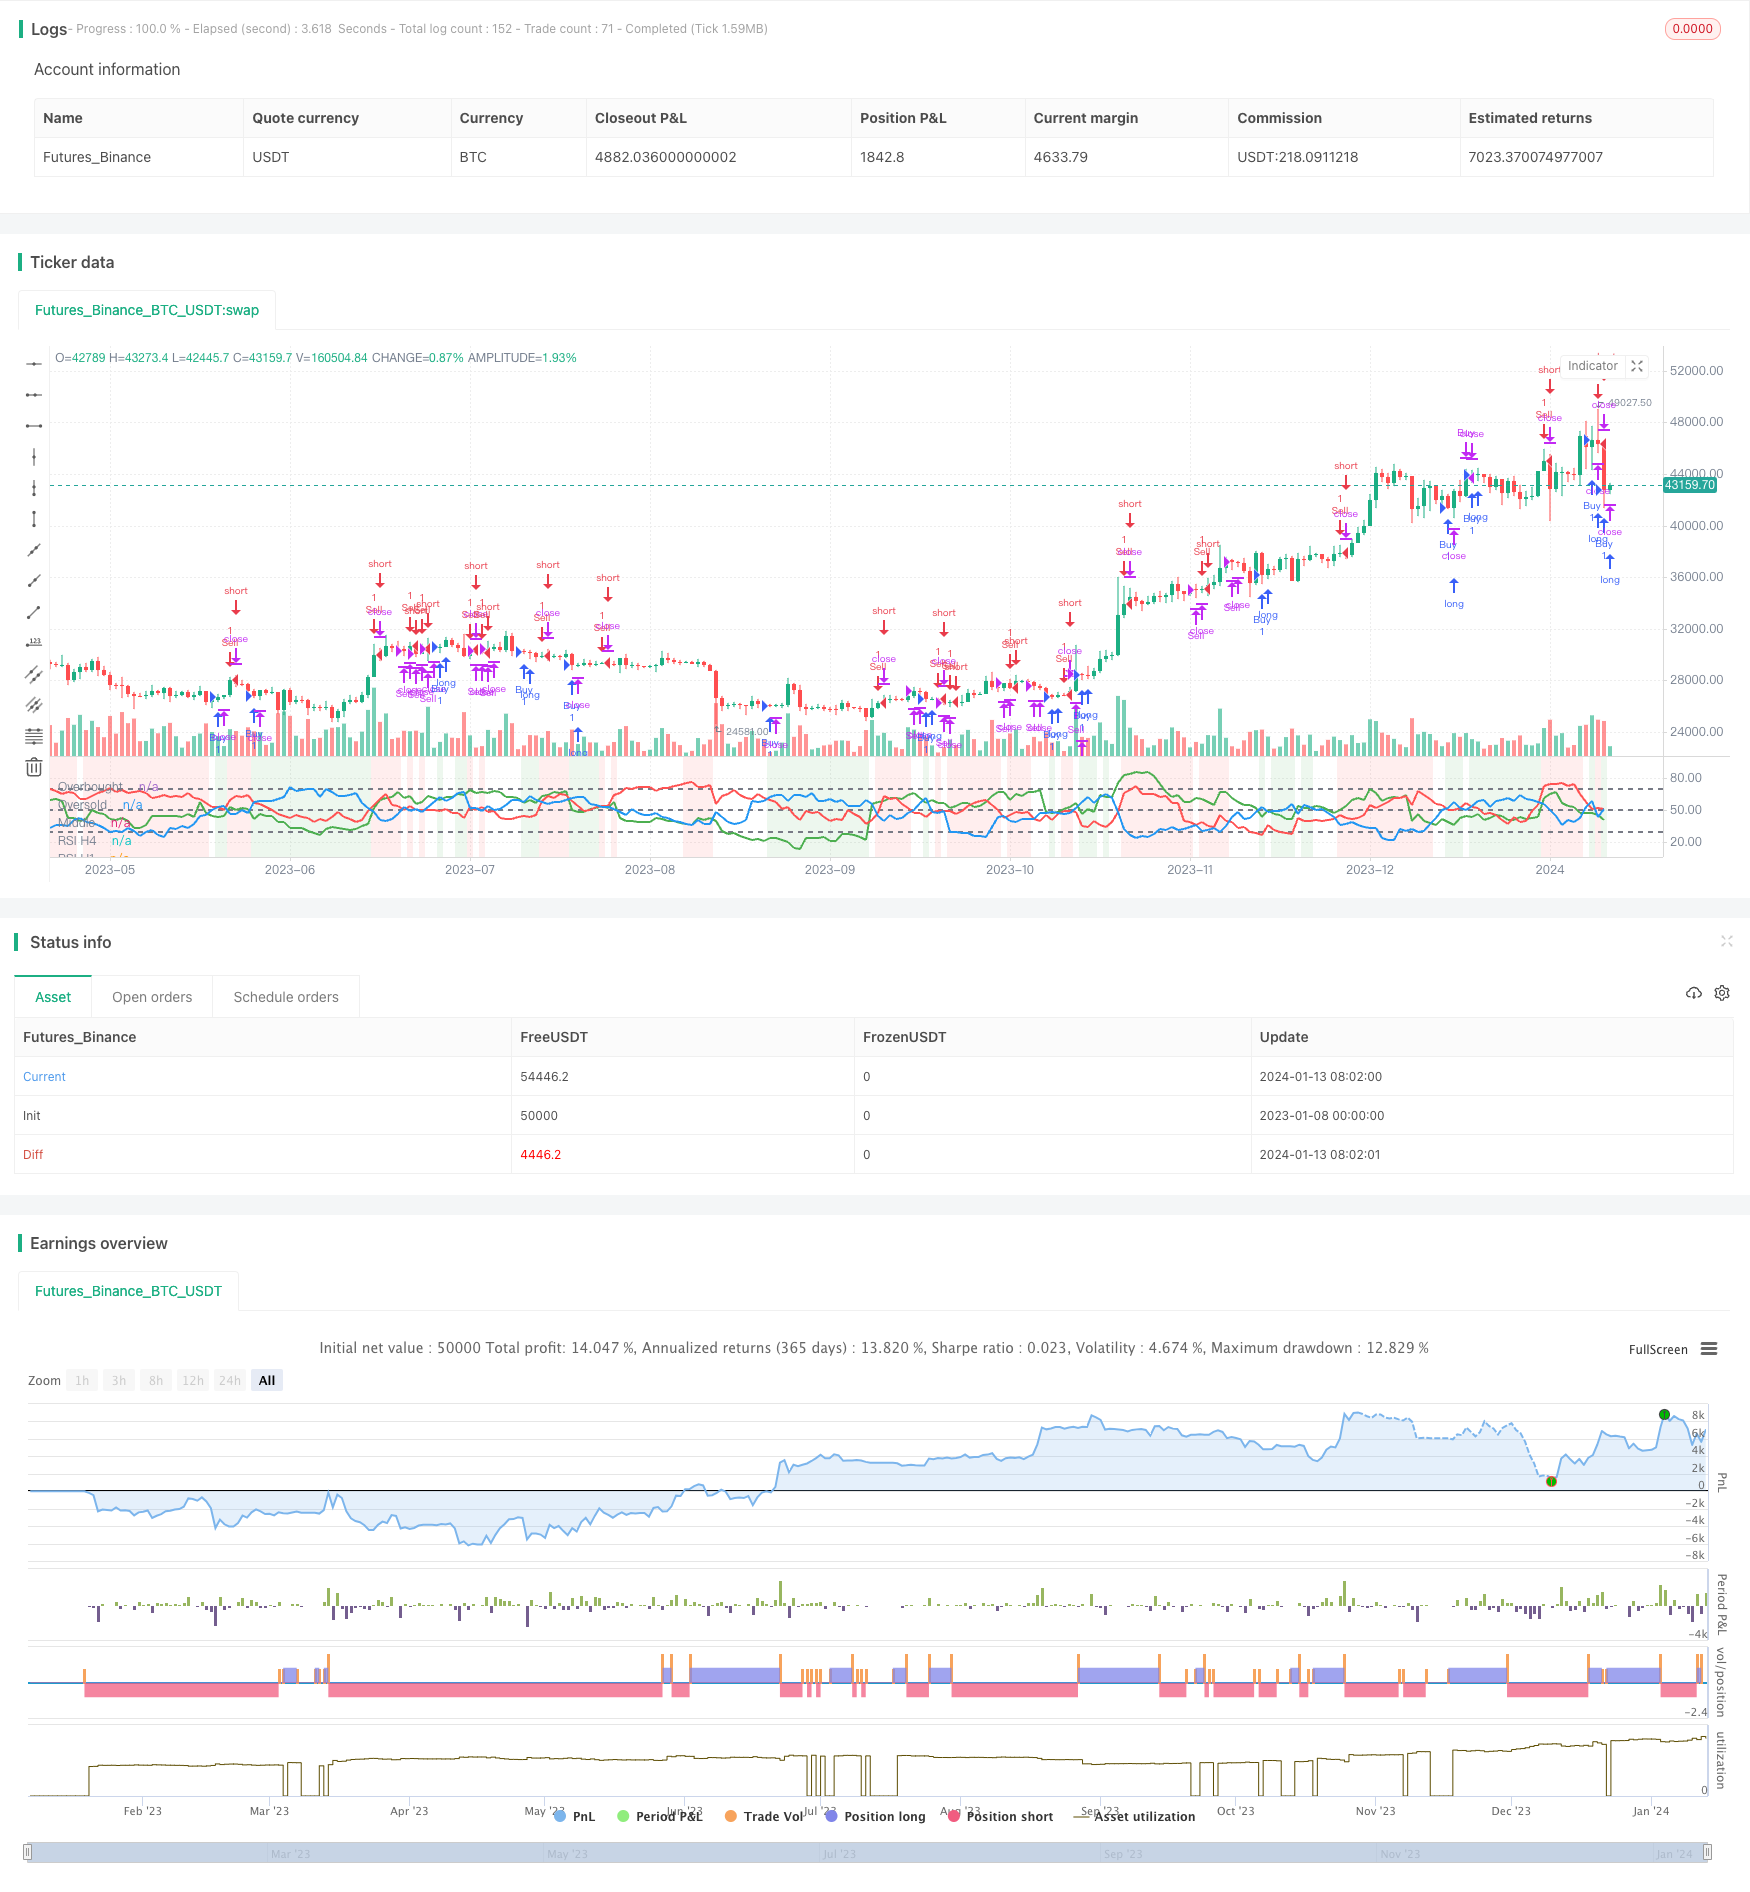
The Multi Timeframe RSI strategy generates trading signals by comparing RSI indicators across different timeframes to determine market trend and extremity. It incorporates RSI from three timeframes - 15mins, 1hr, and…
Overview
The Multi Timeframe RSI strategy generates trading signals by comparing RSI indicators across different timeframes to determine market trend and extremity. It incorporates RSI from three timeframes - 15mins, 1hr, and 4hr - to ensure both trading frequency and judgment accuracy.
Strategy Logic
The core indicator of this strategy is Relative Strength Index (RSI). RSI compares the average gain and average loss over a period to determine if the market is overbought or oversold. Values above 70 indicate overbought conditions while values below 30 indicate oversold conditions.
This strategy utilizes 15mins, 1hr and 4hr RSI. First, it compares 15mins RSI with the other two timeframes to determine trend consistency. Second, it generates buy signals when 15mins RSI crosses below 30 and sell signals when 15mins RSI goes above 70. Finally, entry signals are confirmed by combining trend consistency and extremity judgments.
Advantage Analysis
The biggest advantage of multi timeframe RSI strategy is it balances judgment accuracy and trading frequency. Multiple timeframes improve reliability while 15mins timeframe ensures frequency. Also, RSI is very sensitive in detecting trend reversals ahead of price action.
Risk Analysis
The main risk is generating excessive false signals. Inconsistencies between periods can increase difficulty in judgment and mislead trading decisions. Also, RSI is more sensitive to ranging markets, prone to wrong signals.
To control risk, stop losses should be implemented. RSI parameters should be tested and optimized to find the best balance. Confirmation from other indicators should be considered instead of solely relying on RSI.
Optimization Directions
The strategy can be improved in the following ways:
Test more timeframe combinations to find optimal parameters
Optimize overbought and oversold threshold levels of RSI
Incorporate other indicators for signal confirmation
Add stop loss and take profit rules
Further testing and optimization will lead to best parameter configuration for higher strategy stability.
Conclusion
The multi timeframe RSI strategy effectively utilizes the advantages of RSI indicator and multiple timeframes analysis to determine market trend and extremity. Compared to single indicator and timeframe systems, it can significantly improve judgment accuracy. With further testing and optimization, this strategy can be refined into a robust automated trading system.
Source Pine Script
/*backtest
start: 2023-01-08 00:00:00
end: 2024-01-14 00:00:00
period: 1d
basePeriod: 1h
exchanges: [{"eid":"Futures_Binance","currency":"BTC_USDT"}]
*/

//@version=5
strategy("Multi-Timeframe RSI", overlay=false)

// Lấy dữ liệu RSI từ các biểu đồ khác nhau
rsiM15 = request.security(syminfo.tickerid, "15", ta.rsi(close, 14))
rsiH1 = request.security(syminfo.tickerid, "60", ta.rsi(close, 14))
rsiH4 = request.security(syminfo.tickerid, "240", ta.rsi(close, 14))

// Vẽ đường RSI của M15
plot(rsiM15, title="RSI M15", color=color.blue, linewidth=2)

// Vẽ đường RSI của H1
plot(rsiH1, title="RSI H1", color=color.red, linewidth=2)

// Vẽ đường RSI của H4
plot(rsiH4, title="RSI H4", color=color.green, linewidth=2)

// Điều kiện mua: RSI của M15 > RSI của H1 và RSI của M15 > RSI của H4
buyCondition = rsiM15 > rsiH1 and rsiM15 > rsiH4

// Điều kiện bán: RSI của M15 < RSI của H1 và RSI của M15 < RSI của H4
sellCondition = rsiM15 < rsiH1 and rsiM15 < rsiH4

// Điều kiện đóng lệnh buy: RSI của M15 < RSI của H1
closeBuyCondition = rsiM15 < rsiH1

// Điều kiện đóng lệnh sell: RSI của M15 > RSI của H1
closeSellCondition = rsiM15 > rsiH1

// Vẽ đường Overbought (70)
hline(70, "Overbought", color=color.gray, linewidth=2)

// Vẽ đường Oversold (30)
hline(30, "Oversold", color=color.gray, linewidth=2)

// Vẽ đường Middle (50)
hline(50, "Middle", color=color.gray, linewidth=2)

// Đánh dấu điều kiện mua và bán
bgcolor(buyCondition ? color.new(color.green, 90) : sellCondition ? color.new(color.red, 90) : na)

// Mã chiến lược
if (buyCondition)
    strategy.entry("Buy", strategy.long)
if (sellCondition)
    strategy.entry("Sell", strategy.short)

// Điều kiện đóng lệnh buy
if (closeBuyCondition)
    strategy.close("Buy")

// Điều kiện đóng lệnh sell
if (closeSellCondition)
    strategy.close("Sell")
Published by ChaoZhang on the FMZ strategy square · last modified 2024-01-15. Collected in the Quant Trading Vault. Unvalidated research: re-test with your own data and costs before trusting it.
Build this with AgenKit
A spec is not a trading system. Paste this into your coding agent and AgenKit runs a specialist team — architecture, test-first build, risk gates, review — with paper trading on by default.
/agenkit build a production-grade trading bot with a backtest engine, risk controls and paper trading by default from strategies/Multi-Timeframe-RSI-Strategy.md- npx agenkit install engineering-kit in your project
- Paste the command into your agent and approve each phase
- Get tests, backtest, risk controls and a paper-trading switch
Understand it first
Before you run this, read the lesson behind the idea and how to backtest it honestly. Specs like this one are the survivors of an unknown number of trials; deflate their results accordingly.
Related specs
- EMA RSI and MACD Based Multi Timeframe Trading StrategyPine Script · Multi-timeframe · 1h
- Low Pyramid Risk Tracking StrategyPine Script · Multi-timeframe · 1d
- Multi Timeframe RSI SRSI Trading StrategyPine Script · Multi-timeframe · 1d
- Multi timeframe RSI and Moving Average Trading StrategyPine Script · Multi-timeframe · 1h
- Aggregated Multi timeframe MACD RSI CCI StochRSI MA Linear Trading StrategyPine Script · Multi-timeframe · 1m
- Multi Timeframe Adaptive Market Regime Quantitative Trading StrategyPine Script · Multi-timeframe · 1m