Strategy vault / Multi-timeframe
Multi Timeframe RSI Trading Strategy
The Multi-Timeframe RSI Trading Strategy is a comprehensive trading tool that utilizes the Relative Strength Index (RSI) across three different timeframes: 15-minute (M15), 1-hour (H1), and 4-hour (H4). This strategy…
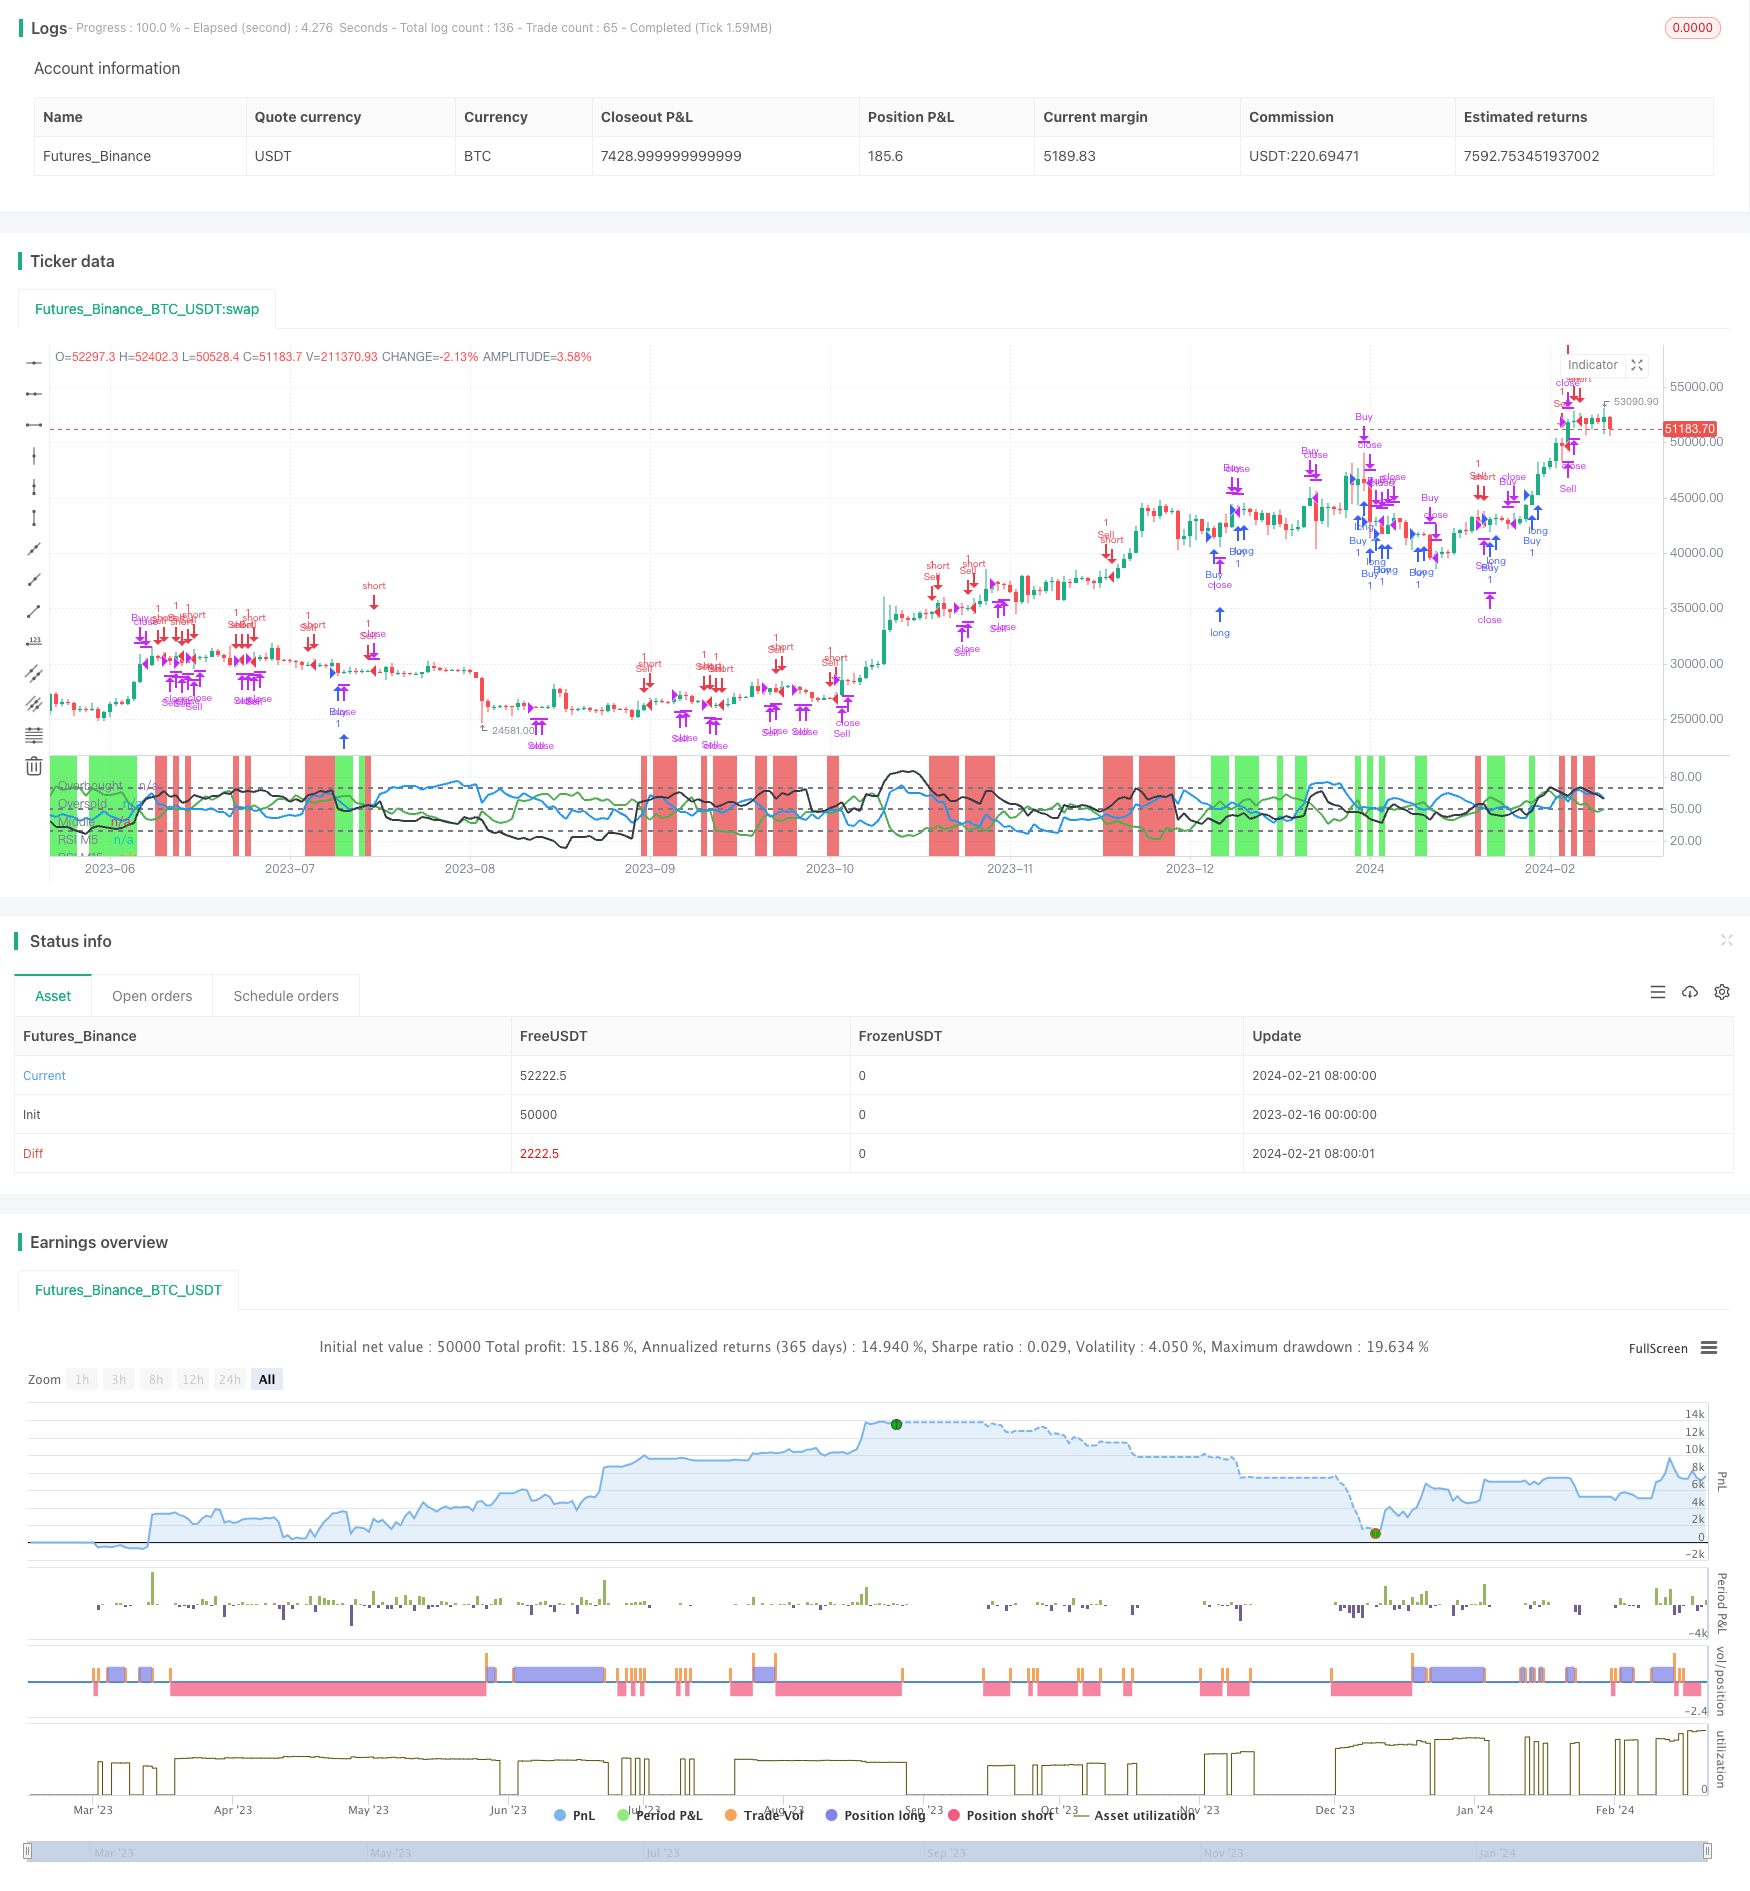
Overview
The Multi-Timeframe RSI Trading Strategy is a comprehensive trading tool that utilizes the Relative Strength Index (RSI) across three different timeframes: 15-minute (M15), 1-hour (H1), and 4-hour (H4). This strategy helps traders identify momentum and trend shifts by comparing RSI values across these timeframes.
Strategy Logic
The core logic of this strategy is to calculate RSI on 15-minute (M15), 1-hour (H1) and 4-hour (H4) timeframes and compare the RSI readings across these three timeframes. Specifically, it follows these principles:
A buy signal is generated when the RSI on M15 is greater than H1, and H1 is greater than H4, with the condition that H4 RSI is above 30 to avoid oversold conditions.
A sell signal occurs when the RSI on H1 is less than H4, and M15 RSI is less than H1, with the condition that H4 RSI is below 70 to avoid overbought conditions.
It suggests closing buy positions when the RSI on M15 crosses below the RSI on H1.
It recommends closing sell positions when the RSI on M15 crosses above the RSI on H1.
Advantages
Compared to single timeframe RSI, this strategy has the following advantages:
Multi-timeframe analysis provides more reliable trading signals. Comparing RSI across different periods filters out some noisy signals.
Intuitive visualizations. The strategy plots each timeframe's RSI in distinct colors for clearer decision making.
Dynamic entry/exit mechanism. The strategy automatically generates buy and sell signals based on RSI configuration changes.
Customizable overbought/oversold levels. Traders can adjust RSI periods and threshold levels based on their trading style and risk tolerance.
Risk Analysis
The strategy also carries some risks, mainly:
RSI can generate false signals. It may produce frequent crossovers in ranging markets.
Noise from shorter timeframes may be amplified in multi-timeframe judgments.
Economic news and major events increase market volatility, affecting indicator reliability.
To mitigate risks, thorough backtesting, parameter optimization, and additional signal filtering tools are recommended. Traders should also be mindful of high-impact economic event calendars to avoid openings during such times.
Enhancement Opportunities
There is room for further enhancing this strategy:
Incorporate more timeframes to construct a multi-layer RSI trading system, e.g. adding daily or weekly RSI analysis.
Test different RSI parameter settings to find optimal configurations.
Combine with other indicators for signal verification, e.g. Volume, MACD etc.
Add stop loss strategies to effectively control single trade loss amount.
Conclusion
The Multi-Timeframe RSI Strategy generates more stable and efficient trading signals by comparing cross-period RSI configurations. Compared to single timeframe RSI, it has advantages like noise filtering and intuitive visualizations. As a technical indicator based strategy, it still carries some inherent risks and would need proper optimization and tuning to minimize those risks. Overall, it provides new ideas for RSI application and is worth further research and usage by quantitative traders.
Source Pine Script
/*backtest
start: 2023-02-16 00:00:00
end: 2024-02-22 00:00:00
period: 1d
basePeriod: 1h
exchanges: [{"eid":"Futures_Binance","currency":"BTC_USDT"}]
*/

//@version=5
strategy("Multi-Timeframe RSI Strategy", overlay=false)

// Lấy dữ liệu RSI từ các biểu đồ khác nhau
rsiM15 = request.security(syminfo.tickerid, "15", ta.rsi(close, 14))
rsiH1 = request.security(syminfo.tickerid, "60", ta.rsi(close, 14))
rsiH4 = request.security(syminfo.tickerid, "240", ta.rsi(close, 14))

// Vẽ đường RSI
plot(rsiM15, title="RSI M5", color=color.green, linewidth=2)
plot(rsiH1, title="RSI M15", color=color.blue, linewidth=2)
plot(rsiH4, title="RSI H1", color=color.black, linewidth=2)

// Điều kiện mua và bán
buyCondition = rsiM15 > rsiH1 and rsiH1 > rsiH4 and rsiH4 > 30
sellCondition = rsiH1 < rsiH4 and rsiM15 < rsiH1 and rsiH4 <70

// Điều kiện đóng lệnh
closeBuyCondition = rsiM15 < rsiH1
closeSellCondition = rsiM15 > rsiH1

// Vẽ đường Overbought và Oversold
hline(70, "Overbought", color=color.gray, linewidth=2)
hline(30, "Oversold", color=color.gray, linewidth=2)
hline(50, "Middle", color=color.gray, linewidth=2)

// Màu nền cho điều kiện mua và bán
bgcolor(buyCondition ? color.new(#0ce714, 40) : sellCondition ? color.new(#e21b1b, 40) : na)

// Đưa ra các quyết định mua hoặc bán
if (buyCondition)
    strategy.entry("Buy", strategy.long)
if (sellCondition)
    strategy.entry("Sell", strategy.short)

// Điều kiện đóng lệnh
if (closeBuyCondition)
    strategy.close("Buy")
if (closeSellCondition)
    strategy.close("Sell")
    //@version=5


// Tạo các cảnh báo
alertcondition(buyCondition, title="Mua Signal", message="Mua Signal")
alertcondition(sellCondition, title="Bán Signal", message="Bán Signal")
Published by ChaoZhang on the FMZ strategy square · last modified 2024-02-23. Collected in the Quant Trading Vault. Unvalidated research: re-test with your own data and costs before trusting it.
Build this with AgenKit
A spec is not a trading system. Paste this into your coding agent and AgenKit runs a specialist team — architecture, test-first build, risk gates, review — with paper trading on by default.
/agenkit build a production-grade trading bot with a backtest engine, risk controls and paper trading by default from strategies/Multi-Timeframe-RSI-Trading-Strategy.md- npx agenkit install engineering-kit in your project
- Paste the command into your agent and approve each phase
- Get tests, backtest, risk controls and a paper-trading switch
Understand it first
Before you run this, read the lesson behind the idea and how to backtest it honestly. Specs like this one are the survivors of an unknown number of trials; deflate their results accordingly.
Related specs
- EMA RSI and MACD Based Multi Timeframe Trading StrategyPine Script · Multi-timeframe · 1h
- Low Pyramid Risk Tracking StrategyPine Script · Multi-timeframe · 1d
- Multi Timeframe RSI SRSI Trading StrategyPine Script · Multi-timeframe · 1d
- Multi timeframe RSI and Moving Average Trading StrategyPine Script · Multi-timeframe · 1h
- Aggregated Multi timeframe MACD RSI CCI StochRSI MA Linear Trading StrategyPine Script · Multi-timeframe · 1m
- Multi Timeframe Adaptive Market Regime Quantitative Trading StrategyPine Script · Multi-timeframe · 1m