Strategy vault / Trend following
Multi Timeframe Volume and Trend Confluence Trading Strategy
This is a complex multi-indicator trading strategy that combines Volume Weighted Average Price (AVWAP), Fixed Range Volume Profile (FRVP), Exponential Moving Average (EMA), Relative Strength Index (RSI), Average…
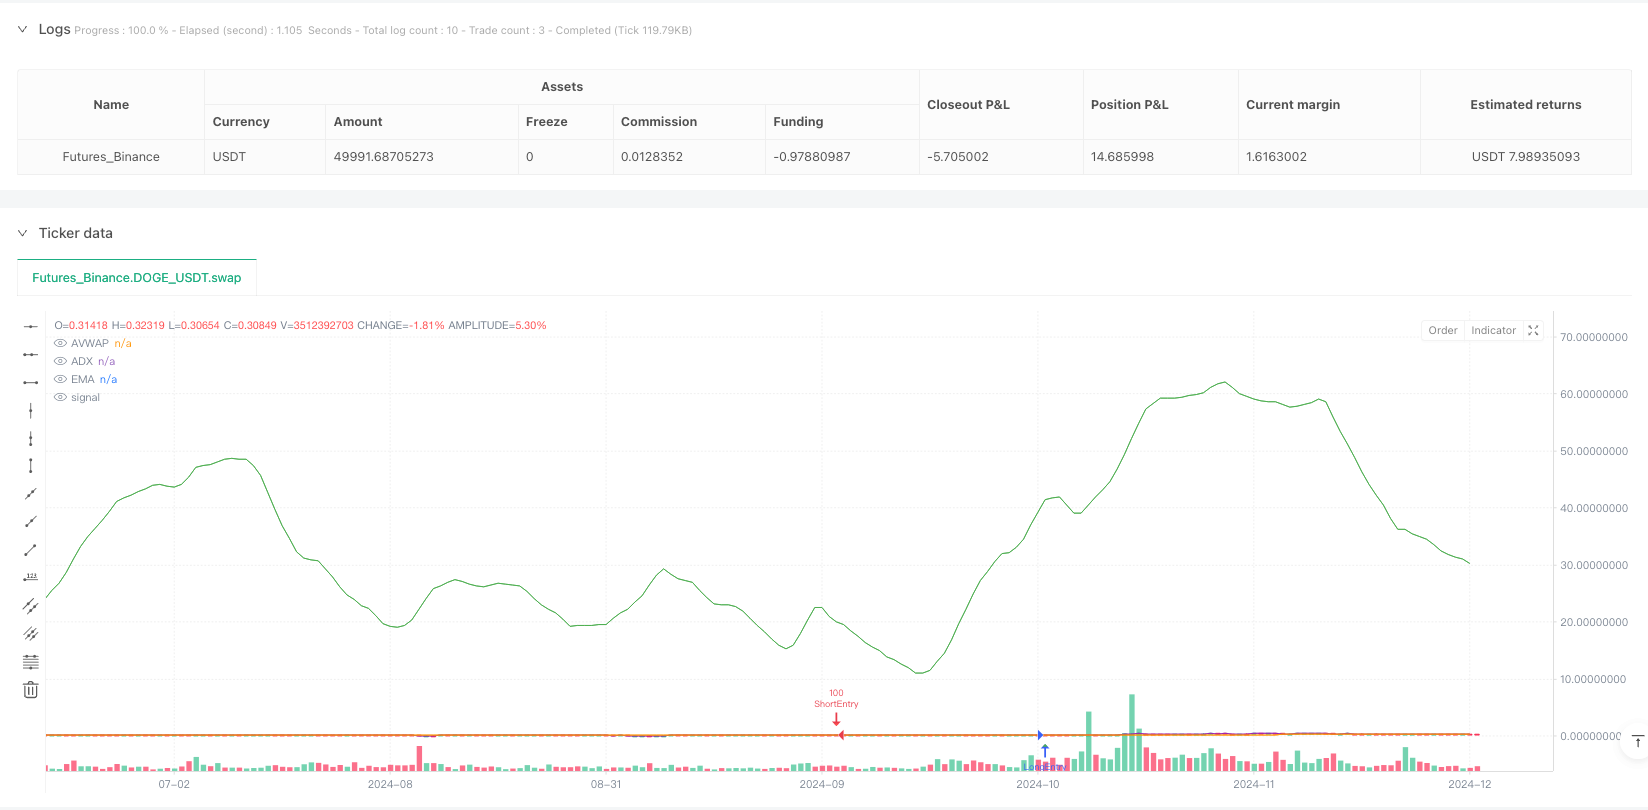
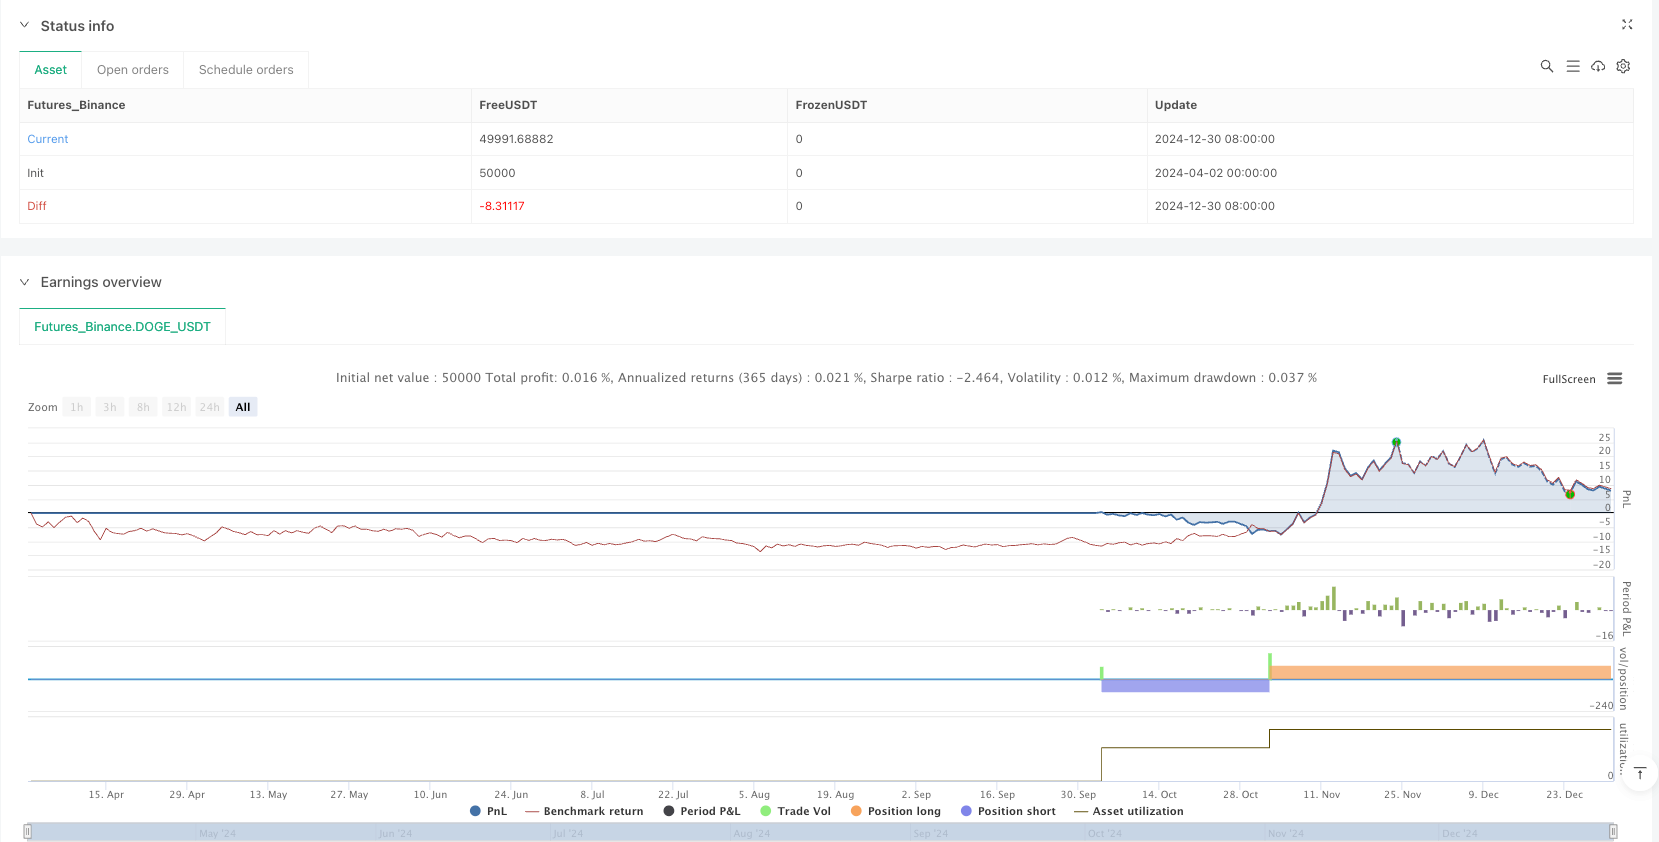
Overview
This is a complex multi-indicator trading strategy that combines Volume Weighted Average Price (AVWAP), Fixed Range Volume Profile (FRVP), Exponential Moving Average (EMA), Relative Strength Index (RSI), Average Directional Index (ADX), and Moving Average Convergence Divergence (MACD) to identify high-probability trading opportunities through indicator confluence.
Strategy Principle
The strategy determines entry signals through multiple conditions:
- Price crossing with AVWAP
- Price position relative to EMA
- RSI strength assessment
- MACD trend momentum
- ADX trend strength confirmation
- Volume filter
The strategy focuses on Asian, London, and New York trading sessions, which typically have better liquidity and more reliable trading signals. Entry logic includes both long and short modes, with a gradient take-profit and stop-loss mechanism.
Strategy Advantages
- Multi-indicator combination improving signal accuracy
- Dynamic volume filtering to avoid low-liquidity trades
- Flexible take-profit and stop-loss strategy
- Optimization based on different trading sessions
- Dynamic risk management mechanism
- Visualization signals to assist decision-making
Strategy Risks
- Increased signal complexity due to multiple indicators
- Potential overfitting in backtesting data
- Potential performance instability under different market conditions
- Trading costs and slippage may affect actual returns
Strategy Optimization Directions
- Introduce machine learning algorithms for dynamic parameter adjustment
- Increase trading session adaptability
- Optimize take-profit and stop-loss strategies
- Add more filtering conditions
- Develop a universal strategy model across different instruments
Summary
This is a highly customized and multi-dimensional trading strategy that attempts to improve trading signal quality and accuracy by integrating multiple technical indicators and trading session characteristics. The strategy demonstrates the complexity of indicator confluence and dynamic risk management in quantitative trading.
Source Pine Script
/*backtest
start: 2024-04-02 00:00:00
end: 2024-12-31 00:00:00
period: 1d
basePeriod: 1d
exchanges: [{"eid":"Futures_Binance","currency":"DOGE_USDT"}]
*/

//@version=6
strategy("FRVP + AVWAP by Grok", overlay=true, initial_capital=10000, default_qty_type=strategy.percent_of_equity, default_qty_value=100)

// User Inputs
frvpLength = input.int(20, title="FRVP Length", minval=1)
emaLength = input.int(75, title="EMA Length", minval=1) // Adjusted for stronger trend confirmation
rsiLength = input.int(14, title="RSI Length", minval=1)
adxThreshold = input.int(20, title="ADX Strength Threshold", minval=0, maxval=100)
volumeMultiplier = input.float(1.0, title="Volume Multiplier", minval=0.1)

// Stop Loss & Take Profit for XAUUSD
stopLossPips = 25 // 25 pips SL for Asian, London, NY Sessions
takeProfit1Pips = 35 // TP1 at 35 pips
takeProfit2Pips = 80 // Final TP at 80 pips

// Stop-Loss & Take-Profit Multipliers (XAUUSD: 1 pip = 0.1 points on most platforms)
stopMultiplier = float(stopLossPips) * 0.1
tp1Multiplier = float(takeProfit1Pips) * 0.1
tp2Multiplier = float(takeProfit2Pips) * 0.1

// Indicators
avwap = ta.vwap(close)  // Volume Weighted Average Price (VWAP)
ema = ta.ema(close, emaLength)     // Exponential Moving Average
rsi = ta.rsi(close, rsiLength)     // Relative Strength Index
macdLine = ta.ema(close, 12) - ta.ema(close, 26)  // MACD Line
signalLine = ta.ema(macdLine, 9)   // MACD Signal Line
atr = ta.atr(14)                   // Average True Range

// Average Directional Index (ADX)
adxSmoothing = 14
[diplus, diminus, adx] = ta.dmi(14, adxSmoothing)  // Corrected syntax for ta.dmi()

// Volume Profile (FRVP - Fixed Range Volume Profile Midpoint)
highestHigh = ta.highest(high, frvpLength)
lowestLow = ta.lowest(low, frvpLength)
frvpMid = (highestHigh + lowestLow) / 2  // Midpoint of the range

// Detect Trading Sessions
currentHour = hour(time, "UTC")  // Renamed to avoid shadowing built-in 'hour'
isAsianSession = currentHour >= 0 and currentHour < 8
isLondonSession = currentHour >= 8 and currentHour < 16
isNYSession = currentHour >= 16 and currentHour < 23

// Entry Conditions
longCondition = ta.crossover(close, avwap) and close > ema and rsi > 30 and macdLine > signalLine and adx > adxThreshold
shortCondition = ta.crossunder(close, avwap) and close < ema and rsi < 70 and macdLine < signalLine and adx > adxThreshold

// Volume Filter
avgVolume = ta.sma(volume, 20)     // 20-period Simple Moving Average of volume
volumeFilter = volume > avgVolume * volumeMultiplier  // Trade only when volume exceeds its moving average

// Trade Execution with SL/TP for Sessions
if (longCondition and volumeFilter and (isAsianSession or isLondonSession or isNYSession))
    strategy.entry("LongEntry", strategy.long, qty=100)
    strategy.exit("LongTP1", from_entry="LongEntry", limit=close + tp1Multiplier)
    strategy.exit("LongExit", from_entry="LongEntry", stop=close - stopMultiplier, limit=close + tp2Multiplier)

if (shortCondition and volumeFilter and (isAsianSession or isLondonSession or isNYSession))
    strategy.entry("ShortEntry", strategy.short, qty=100)
    strategy.exit("ShortTP1", from_entry="ShortEntry", limit=close - tp1Multiplier)
    strategy.exit("ShortExit", from_entry="ShortEntry", stop=close + stopMultiplier, limit=close - tp2Multiplier)

// Plotting for Debugging and Visualization
plot(avwap, "AVWAP", color=color.purple, style=plot.style_line, offset=0)
plot(ema, "EMA", color=color.orange, style=plot.style_line, offset=0)
// plot(rsi, "RSI", color=color.yellow, style=plot.style_histogram, offset=0)  // Better in a separate pane
// plot(macdLine, "MACD Line", color=color.blue, style=plot.style_histogram, offset=0)  // Better in a separate pane
// plot(signalLine, "Signal Line", color=color.red, style=plot.style_histogram, offset=0)  // Better in a separate pane
plot(adx, "ADX", color=color.green, style=plot.style_line, offset=0)

// Optional: Plot entry/exit signals for visualization
plotshape(longCondition and volumeFilter ? close : na, title="Long Signal", location=location.belowbar, color=color.green, style=shape.triangleup, size=size.tiny)
plotshape(shortCondition and volumeFilter ? close : na, title="Short Signal", location=location.abovebar, color=color.red, style=shape.triangledown, size=size.tiny)Published by ianzeng123 on the FMZ strategy square · last modified 2025-04-02. Collected in the Quant Trading Vault. Unvalidated research: re-test with your own data and costs before trusting it.
Build this with AgenKit
A spec is not a trading system. Paste this into your coding agent and AgenKit runs a specialist team — architecture, test-first build, risk gates, review — with paper trading on by default.
/agenkit build a production-grade trading bot with a backtest engine, risk controls and paper trading by default from strategies/Multi-Timeframe-Volume-and-Trend-Confluence-Trading-Strategy.md- npx agenkit install engineering-kit in your project
- Paste the command into your agent and approve each phase
- Get tests, backtest, risk controls and a paper-trading switch
Understand it first
Before you run this, read the lesson behind the idea and how to backtest it honestly. Specs like this one are the survivors of an unknown number of trials; deflate their results accordingly.
Related specs
- Fixed Range Volume Profile And Anchored VWAP Trend Identification Strategy With Dynamic Stop LossPine Script · Trend following · 1h
- Intelligent Multi Dimensional Adaptive Trend Trading SystemPine Script · Trend following · 1h
- Indicator Verification Automated Trading StrategyPine Script · Trend following · 10m
- Trend Following Strategy Based on Moving Average 439858Pine Script · Trend following · 1d
- Dual EMA Crossover Trend Following Strategy with ATR and ADX FiltersPine Script · Trend following · 1d
- Five Minute Triple Confirmation Trend Trading Strategy with Risk Management SystemPine Script · Trend following · 1m