Myo_LS_D Quantitative Strategy
The Myo LS D quantitative strategy is a dual-track tracking stop-profit strategy based on long and short positions. The strategy combines multiple indicators such as moving averages, price breakthroughs, and…
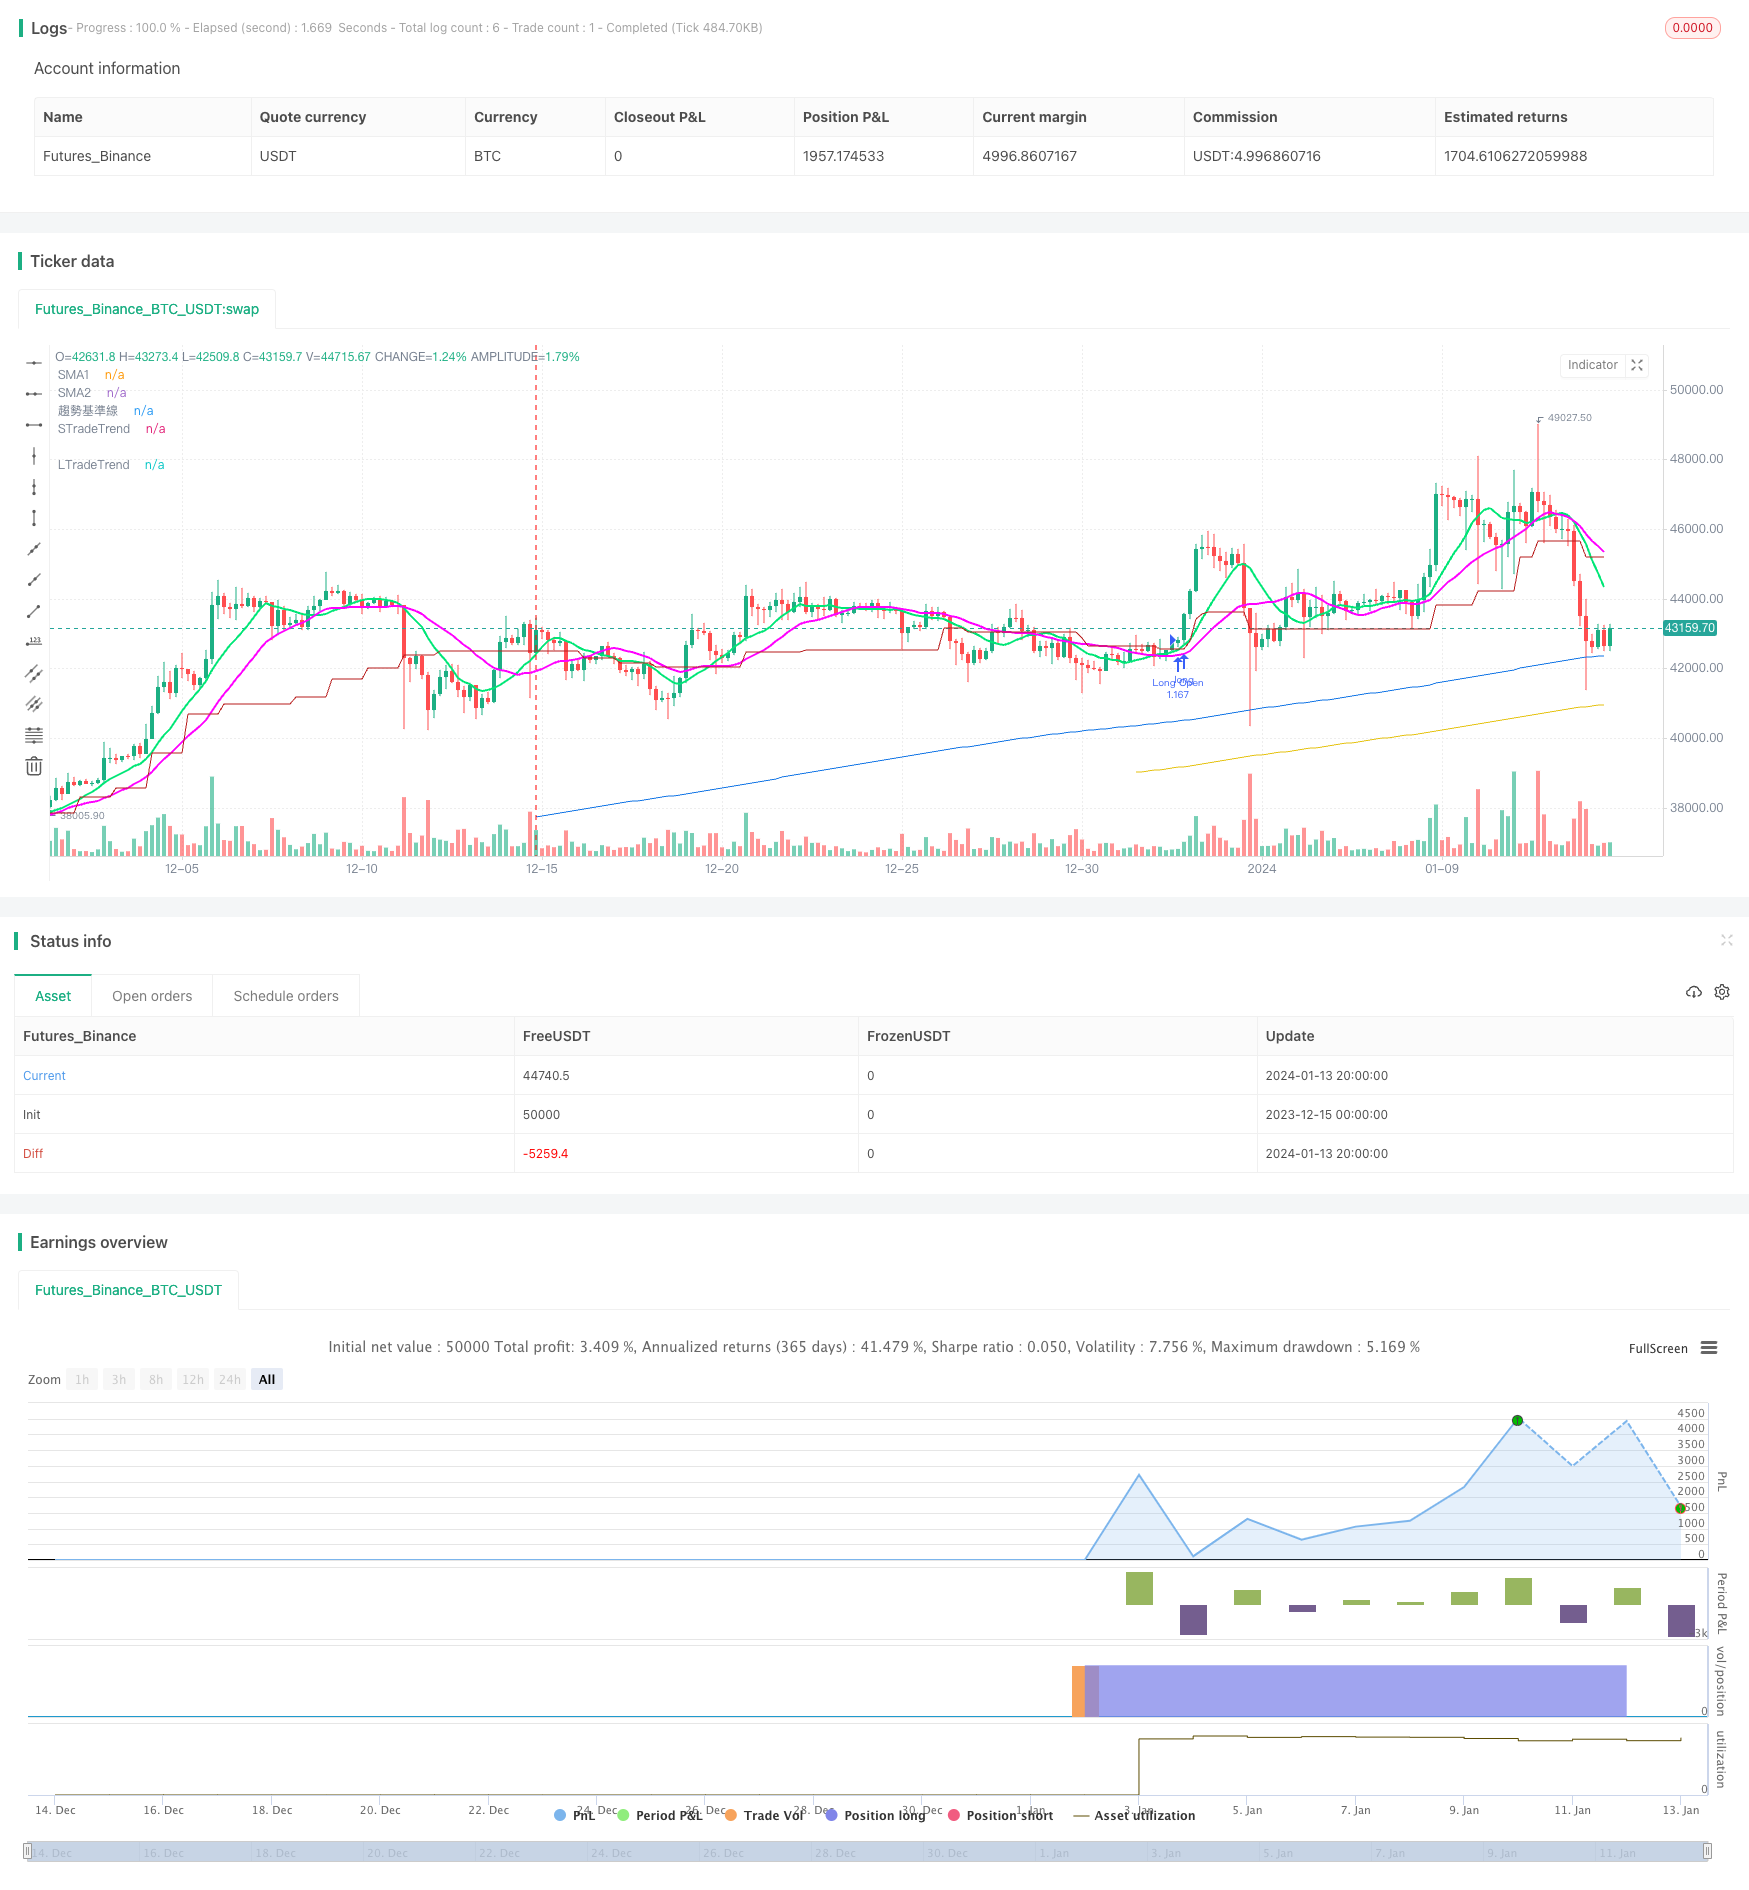
Overview
The Myo_LS_D quantitative strategy is a dual-track tracking stop-profit strategy based on long and short positions. The strategy combines multiple indicators such as moving averages, price breakthroughs, and risk-return ratios to build trading signals. It achieves a high win rate and profit rate on the premise of accurate trend judgment.
Principle
The strategy consists mainly of a trend judgment module, long position module, short position module, tracking stop profit module, etc.
The trend judgment module uses the Donchain channel to determine the overall trend direction. The prerequisite for going long is an upward trend, while going short requires a downward trend.
The long position module takes into account factors such as new highs, lows, long moving average positions, etc. The short position module considers new highs, lows, short moving average positions and other factors. This ensures the opening of positions when breaking through critical price points upwards or downwards.
The tracking stop profit module uses two SMA moving averages of different cycles to track price changes in real time. When the price breaks through the moving average line, the position is closed for profit. This kind of real-time tracking can maximize profits from the trend.
Stop loss setting considers enlarged stop loss to keep the stop loss point far away from the support level to avoid being knocked out.
Advantage Analysis
The biggest advantage of this strategy is the separate long and short position building and tracking stop profit strategy. Specifically, it is mainly embodied in:
Separate long and short positions can maximize profit opportunities by capturing one-sided trend trading opportunities.
Tracking stop profit can obtain higher profit margin through real-time adjustment. Compared with traditional stop profit methods, income can be significantly improved.
Enlarged stops can reduce the probability of being knocked out and reduce the risk of losses.
Risk and Solutions
The main risks of this strategy are concentrated in the following points:
Incorrect trend judgment may result in contrarian positions and losses. Optimization can be achieved by appropriately adjusting Donchain parameters or adding other indicators for judgment.
Tracking stop profit is too aggressive and may prematurely stop profit without being able to sustain gains. Optimization can be achieved by appropriately increasing the spacing between stop profit moving averages.
The stop loss range is too small, which may increase the probability of being knocked out. Appropriately expanding the stop loss magnitude can mitigate risks.
Optimization Directions
The main optimization directions for this strategy are:
Optimize the trend judgment module to improve judgment accuracy. Consider combining more indicators such as MACD.
Adjust the tracking stop profit method to further expand profit space. For example, moving stop profit lines in proportion.
Expanding the stop loss range or considering shrinkage stops can further reduce the probability of being knocked out.
Different varieties have different parameters. Optimal parameter combinations can be obtained through training to further improve strategy returns.
Summary
In general, the Myo_LS_D strategy is a relatively mature and stable dual-track tracking stop-profit quantitative strategy. It has obvious advantages and controllable risks. It is one of the quantitative solutions worth holding for the long term. Future optimizations can enable continuous performance improvement to make it an even more superior quantitative strategy.
Parameters
| Name | Default | What it controls |
|---|---|---|
| v_input_int_1 | 100 | Stop loss length for long positions |
| v_input_int_2 | 100 | Stop loss length for short positions |
| v_input_int_3 | 0 | Long position trailing take-profit SMA length1: 10 | 5 | 20 | 40 | 60 | 80 |
| v_input_int_4 | 0 | Long position trailing take-profit SMA length2: 20 | 10 | 5 | 40 | 60 | 80 |
| v_input_int_5 | 0 | Short position trailing take-profit SMA length1: 5 | 10 | 20 | 40 | 60 | 80 |
| v_input_int_6 | 0 | Short position trailing take-profit SMA length2: 10 | 5 | 20 | 40 | 60 | 80 |
| v_input_int_7 | 0 | Long trend line: 400 | 200 | 300 | 100 | 500 |
| v_input_int_8 | 0 | Short trend line: 300 | 200 | 100 | 400 | 500 |
| v_input_int_9 | 20 | Number of candlesticks for short-term moving average |
| v_input_int_10 | 60 | Number of candlesticks for mid-term moving average |
| v_input_int_11 | 120 | Number of candlesticks for long-term moving average |
| v_input_int_12 | 8 | Trend baseline |
| v_input_int_13 | 26 | Short baseline |
Source Pine Script
/*backtest
start: 2023-12-15 00:00:00
end: 2024-01-14 00:00:00
period: 4h
basePeriod: 15m
exchanges: [{"eid":"Futures_Binance","currency":"BTC_USDT"}]
*/

// This source code is subject to the terms of the Mozilla Public License 2.0 at https://mozilla.org/MPL/2.0/
// © agresiynin

//@version=5
// ©Myo_Pionex
strategy(
 title                  =   "Myo_simple strategy_LS_D",
 shorttitle             =   "Myo_LS_D",
 overlay                =   true )


// var
lowest_price = ta.lowest(low, 200)
highest_price = ta.highest(high, 200)
min_800 = ta.lowest(low, 800)
max_800 = ta.highest(high, 800)
tp_target_L = min_800 + (max_800 - min_800) * math.rphi
tp_target_S = max_800 - (max_800 - min_800) * math.rphi
sl_length_L = input.int(100, "Stop loss length for long positions", minval = 50, maxval = 300, step = 50)
sl_length_S = input.int(100, "Stop loss length for short positions", minval = 50, maxval = 300, step = 50)
sl_L = lowest_price * (1 - 0.005)
sl_S = highest_price * (1 + 0.005)
rrr_L = tp_target_L - sl_L / sl_L
rrr_S = ta.lowest(low, 800) + ta.highest(high, 800) - ta.lowest(low, 800) * math.rphi / ta.highest(high, 200) + 0.005 * ta.highest(high, 200) - ta.lowest(low, 200) - 0.005 * ta.lowest(low, 200)
smalen1 = input.int(10, "Long position trailing take-profit SMA length1", options = [5, 10, 20, 40, 60, 80])
smalen2 = input.int(20, "Long position trailing take-profit SMA length2", options = [5, 10, 20, 40, 60, 80])
smalen1_S = input.int(5, "Short position trailing take-profit SMA length1", options = [5, 10, 20, 40, 60, 80])
smalen2_S = input.int(10, "Short position trailing take-profit SMA length2", options = [5, 10, 20, 40, 60, 80])
TrendLength_L = input.int(400, "Long trend line", options = [100, 200, 300, 400, 500])
TrendLength_S = input.int(300, "Short trend line", options = [100, 200, 300, 400, 500])
SMA1 = ta.sma(close, smalen1)
SMA2 = ta.sma(close, smalen2)
SMA1_S = ta.sma(close, smalen1_S)
SMA2_S = ta.sma(close, smalen2_S)
shortlength = input.int(20, "Number of candlesticks for short-term moving average")
midlength = input.int(60, "Number of candlesticks for mid-term moving average")
longlength = input.int(120, "Number of candlesticks for long-term moving average")
ShortAvg = math.sum(close, shortlength)/shortlength
MidAvg = math.sum(close, midlength)/midlength
LongAvg = math.sum(close, longlength)/longlength

// Trend
basePeriods = input.int(8, minval=1, title="Trend baseline")
basePeriods_Short = input.int(26, "Short baseline")
donchian(len) => math.avg(ta.lowest(len), ta.highest(len))
baseLine = donchian(basePeriods)
baseLine_Short = donchian(basePeriods_Short)
trend = request.security(syminfo.tickerid, "D", baseLine)
isUptrend = false
isDowntrend = false
baseLine_D = request.security(syminfo.tickerid, "D", baseLine)
plot(baseLine_D, color=#B71C1C, title="Trend baseline")
if close[0] > baseLine_D
    isUptrend := true
if close[0] < baseLine_Short
    isDowntrend := true
// Long
// Condition
// entry
con_a = low > lowest_price ? 1 : 0
con_b = high > highest_price ? 1 : 0
con_c = close[0] > ta.sma(close, TrendLength_L) ? 1 : 0
con_d = isUptrend ? 1 : 0
con_e = rrr_L > 3 ? 1 : 0
con_a1 = close[0] > ShortAvg[shortlength] ? 1 : 0
con_b1 = close[0] > MidAvg[midlength] ? 1 : 0

// close
con_f = ta.crossunder(close, SMA1) and ta.crossunder(close, SMA2) ? 1 : 0
con_g = close < ta.lowest(low, sl_length_L)[1] * (1 - 0.005) ? 1 : 0

// exit
con_h = tp_target_L

// Main calculation
LongOpen = false
AddPosition_L = false

if con_a + con_b + con_c + con_e + con_a1 + con_b1 >= 4 and con_d >= 1
    LongOpen := true
// Short
// Condition
// entry
con_1 = high < highest_price ? 1 : 0
con_2 = low < lowest_price ? 1 : 0
con_3 = close[0] < ta.sma(close, TrendLength_S) ? 1 : 0
con_4 = isDowntrend ? 1 : 0
con_5 = rrr_S > 3 ? 1 : 0
con_11 = close[0] < ShortAvg[shortlength] ? 1 : 0
con_12 = close[0] < MidAvg[midlength] ? 1 : 0

// close
con_6 = ta.crossover(close, SMA1_S) and ta.crossover(close, SMA2_S) ? 1 : 0
con_7 = close > ta.highest(high, sl_length_S)[1] * (1 + 0.005) ? 1 : 0

// exit
con_8 = tp_target_S

// Main calculation
ShortOpen = false
AddPosition_S = false

if con_1 + con_2 + con_3 + con_4 + con_5 + con_11 + con_12 >= 5
    ShortOpen := true

//
// execute
//
strategy.initial_capital = 50000
if strategy.position_size == 0
    if LongOpen
        strategy.entry("Long Open" , strategy.long , comment= "Long Open " + str.tostring(close[0]), qty=strategy.initial_capital/close[0])

if strategy.position_size > 0
    if (con_f > 0 or con_g > 0 or ShortOpen) and close <= baseLine_D
        strategy.close_all(comment="Close Long " + str.tostring(close[0]))

if strategy.position_size == 0
    if ShortOpen
        strategy.entry("Short Open" , strategy.short , comment= "Short Open " + str.tostring(close[0]), qty=strategy.initial_capital/close[0])

if strategy.position_size < 0
    if (con_6 > 0 or con_7 > 0 or LongOpen) and close >= baseLine_D
        strategy.close_all(comment="Close Short " + str.tostring(close[0]))


plot(ta.sma(close, TrendLength_L), color=#e5c212, title="LTradeTrend")
plot(ta.sma(close, TrendLength_S), color=#1275e5, title="STradeTrend")
plot(SMA1, "SMA1", color = color.lime, linewidth = 2)
plot(SMA2, "SMA2", color = color.rgb(255, 0, 255), linewidth = 2)Published by ChaoZhang on the FMZ strategy square · last modified 2024-01-15. Collected in the Quant Trading Vault. Unvalidated research: re-test with your own data and costs before trusting it.
Build this with AgenKit
A spec is not a trading system. Paste this into your coding agent and AgenKit runs a specialist team — architecture, test-first build, risk gates, review — with paper trading on by default.
/agenkit build a production-grade trading bot with a backtest engine, risk controls and paper trading by default from strategies/Myo_LS_D-Quantitative-Strategy.md- npx agenkit install engineering-kit in your project
- Paste the command into your agent and approve each phase
- Get tests, backtest, risk controls and a paper-trading switch
Understand it first
Before you run this, read the lesson behind the idea and how to backtest it honestly. Specs like this one are the survivors of an unknown number of trials; deflate their results accordingly.
Related specs
- Donchian Channel and Larry Williams Large Trade Index StrategyPine Script · Breakout · 1m
- Momentum Breakout Trading Strategy 435896Pine Script · Breakout · 1d
- Multi Indicator Trend Breakout Strategy with Dynamic Stop LossPine Script · Breakout · 1d
- The Octagon Cloud Tracing StrategyPine Script · Breakout · 1d
- Trend Breakout Trading Strategy Based on Donchian Channel and Moving AveragePine Script · Breakout · 1d
- Trend Following Strategy with MACD and Donchian ChannelPine Script · Breakout · 1h