NoroBands Momentum Position Strategy
This strategy combines Noro's bands theory with quantitative techniques to form a momentum breakout strategy. It generates trading signals by calculating moving averages, RSI, bands, color bars and other indicators…
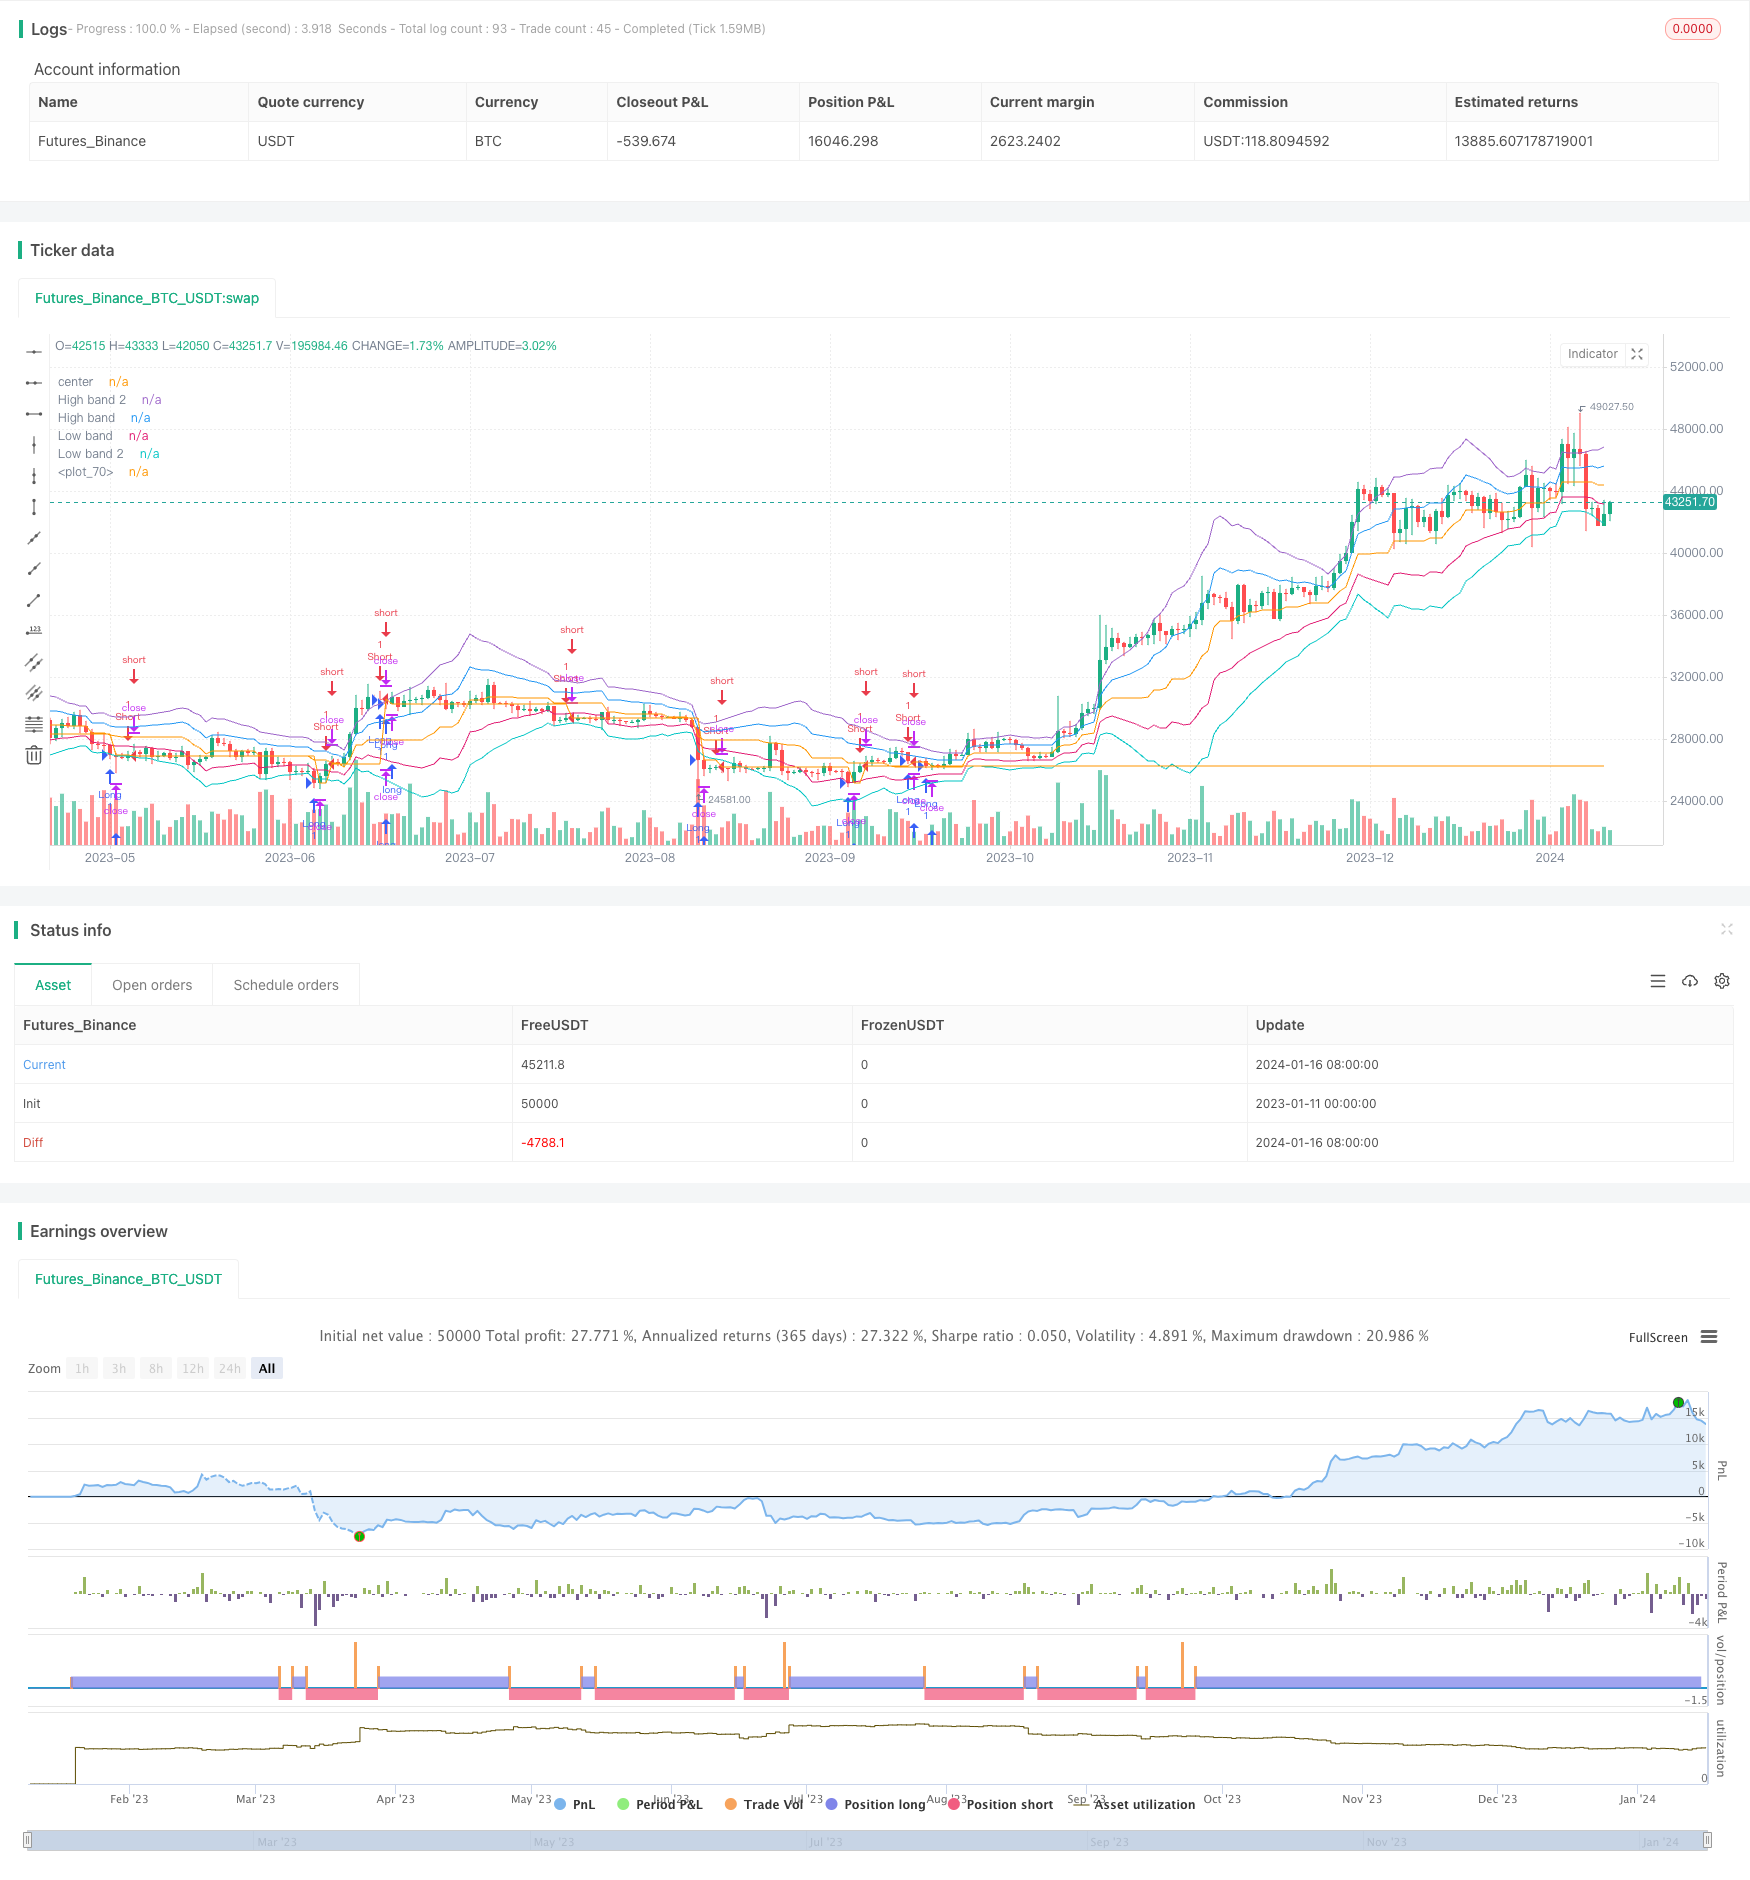
Overview
This strategy combines Noro's bands theory with quantitative techniques to form a momentum breakout strategy. It generates trading signals by calculating moving averages, RSI, bands, color bars and other indicators to implement band breakout trading.
Strategy Logic
- Calculate upper and lower bands using average true range. Price breaking through upper band indicates long signal while breaking lower band gives short signal.
- Use RSI indicator to determine overbought and oversold zones. RSI below 30 suggests long while above 70 suggests short.
- Breaking max and min prices shows price momentum direction.
- Color bars indicate bullish or bearish markets. Green means bull market for long while red means bear market for short.
- Combine moving average to identify divergence for trade signals.
Advantages
- Multiple indicators combination improves accuracy.
- Combining bands theory and quantitative techniques makes the strategy more effective.
- Blending momentum breakout and mean reversion trading expands profit room.
- High extensibility to adjust parameters according to markets.
Risks
- Parameters need constant optimization and testing.
- Fails to respond timely to long-short switches, causing losses probably.
- High trading frequency, affected easily by fees and slippage.
- Parameters should be adjusted timely to suit different cycles.
Optimization
- Multi-timeframe validation to find best parameter combination.
- Add stop loss to reduce single loss.
- Larger position management to improve profit efficiency.
- Combine deep learning for auto parameter optimization.
Summary
This strategy combines typical quantitative indicators to achieve effective profit through momentum and mean reversion indicators. It also uses average true range theory to locate reasonable entry points. A good example of combining theory and techniques. With parameters optimization and risk control improvement, it will become a efficient and stable quantitative strategy.
Parameters
| Name | Default | What it controls |
|---|---|---|
| v_input_1 | true | Long |
| v_input_2 | true | Short |
| v_input_3 | 20 | Period |
| v_input_4 | true | Use ColorBar |
| v_input_5 | true | Use CryptoBottom |
| v_input_6 | true | Use RSI |
| v_input_7 | true | Use min/max |
| v_input_8 | true | Use pyramiding |
| v_input_9 | false | Show Bands |
| v_input_10 | false | Show Background |
| v_input_11 | false | Show Locomotive |
| v_input_12 | false | Show Avg.price line |
Source Pine Script
/*backtest
start: 2023-01-11 00:00:00
end: 2024-01-17 00:00:00
period: 1d
basePeriod: 1h
exchanges: [{"eid":"Futures_Binance","currency":"BTC_USDT"}]
*/


//@version=2
strategy("Noro's Bands Strategy v1.5", shorttitle = "NoroBands str 1.5", overlay=true)

//Settings
needlong = input(true, defval = true, title = "Long")
needshort = input(true, defval = true, title = "Short")
len = input(20, defval = 20, minval = 2, maxval = 200, title = "Period")
color = input(true, defval = true, title = "Use ColorBar")
usecb = input(true, defval = true, title = "Use CryptoBottom")
usersi = input(true, defval = true, title = "Use RSI")
usemm = input(true, defval = true, title = "Use min/max")
usepyr = input(true, defval = true, title = "Use pyramiding")
needbb = input(false, defval = false, title = "Show Bands")
needbg = input(false, defval = false, title = "Show Background")
needlo = input(false, defval = false, title = "Show Locomotive")
needpy = input(false, defval = false, title = "Show Avg.price line")
src = close

//Fast RSI
fastup = rma(max(change(src), 0), 2)
fastdown = rma(-min(change(src), 0), 2)
fastrsi = fastdown == 0 ? 100 : fastup == 0 ? 0 : 100 - (100 / (1 + fastup / fastdown))

//CryptoBottom
mac = sma(close, 10)
lencb = abs(close - mac)
sma = sma(lencb, 100)
max = max(open, close)
min = min(open, close)

//PriceChannel
lasthigh = highest(src, len)
lastlow = lowest(src, len)
center = (lasthigh + lastlow) / 2

//dist
dist = abs(src - center)
distsma = sma(dist, len)
hd = center + distsma
ld = center - distsma
hd2 = center + distsma * 2
ld2 = center - distsma * 2

//Trend
trend = close < ld and high < hd ? -1 : close > hd and low > ld ? 1 : trend[1]

//Lines
colo = needbb == false ? na : black
plot(hd2, color = colo, linewidth = 1, transp = 0, title = "High band 2")
plot(hd, color = colo, linewidth = 1, transp = 0, title = "High band")
plot(center, color = colo, linewidth = 1, transp = 0, title = "center")
plot(ld, color = colo, linewidth = 1, transp = 0, title = "Low band")
plot(ld2, color = colo, linewidth = 1, transp = 0, title = "Low band 2")

//Background
col = needbg == false ? na : trend == 1 ? lime : red
bgcolor(col, transp = 80)

//Signals
up = trend == 1 and ((close < open or color == false) or close < hd) and (min < min[1] or usemm == false) and (close < strategy.position_avg_price or usepyr == false or strategy.position_size <= 0) ? 1 : 0
dn = trend == -1 and ((close > open or color == false) or close > ld) and (max > max[1] or usemm == false) and (close > strategy.position_avg_price or usepyr == false or strategy.position_size >= 0) ? 1 : 0
up2 = close < open and lencb > sma * 3 and min < min[1] and fastrsi < 10 and (close < strategy.position_avg_price or usepyr == false or strategy.position_size <= 0) ? 1 : 0 //CryptoBottom
//dn2 = close > open and len > sma * 3 and max > max[1] and fastrsi > 90 ? 1 : 0 //CryptoBottom
up3 = fastrsi < 5 and usersi == true and (close < strategy.position_avg_price or usepyr == false or strategy.position_size <= 0) ? 1 : 0
//dn3 = fastrsi > 95 and usersi = true ? 1 : 0

//Avg Price
colpy = needpy == false ? na : black
plot(strategy.position_avg_price, color = colpy)

up4 = close < strategy.position_avg_price and usepyr == true and strategy.position_size >= 0 ? 1 : 0
dn4 = close > strategy.position_avg_price and usepyr == true and strategy.position_size <= 0 ? 1 : 0

//Locomotive
uploco = trend == 1 and close < open and min < min[1] and close < center ? 1 : 0
plotarrow(needlo == true and uploco == 1 ? 1 : 0, colorup = black, colordown = black, transp = 0)

longCondition = up == 1 or (up2 == 1 and usecb == true) or (up3 == 1 and usersi == true) or up4 == 1
if (longCondition)
    strategy.entry("Long", strategy.long, needlong == false ? 0 : na)

shortCondition = dn == 1 or dn4 == 1
if (shortCondition)
strategy.entry("Short", strategy.short, needshort == false ? 0 : na)Published by ChaoZhang on the FMZ strategy square · last modified 2024-01-18. Collected in the Quant Trading Vault. Unvalidated research: re-test with your own data and costs before trusting it.
Build this with AgenKit
A spec is not a trading system. Paste this into your coding agent and AgenKit runs a specialist team — architecture, test-first build, risk gates, review — with paper trading on by default.
/agenkit build a production-grade trading bot with a backtest engine, risk controls and paper trading by default from strategies/NoroBands-Momentum-Position-Strategy.md- npx agenkit install engineering-kit in your project
- Paste the command into your agent and approve each phase
- Get tests, backtest, risk controls and a paper-trading switch
Understand it first
Before you run this, read the lesson behind the idea and how to backtest it honestly. Specs like this one are the survivors of an unknown number of trials; deflate their results accordingly.
Related specs
- KST EMA Momentum Trend Following StrategyPine Script · Momentum · 1d
- Multi EMA Trend Momentum Trading Strategy with Risk Management SystemPine Script · Momentum · 1h
- Multi Indicator Trend Momentum Trading Strategy with Dynamic Risk Management SystemPine Script · Momentum · 1h
- Dual SMA Momentum StrategyPine Script · Momentum · 1d
- Multi Indicator Dynamic Momentum Cross StrategyPine Script · Momentum · 1d
- Multi Indicator Trend Momentum Trading Strategy An Optimized Quantitative Trading System Based on Bollinger Bands Fibonacci and ATRPine Script · Momentum · 1h