Strategy vault / Trend following
OBV and CCI Indicators Based Trend Following Strategy
This strategy is a trend following strategy based on OBV and CCI indicators. It uses OBV indicator to judge market trend and capital flow, and then uses CCI indicator for filtering to generate trading signals. When…
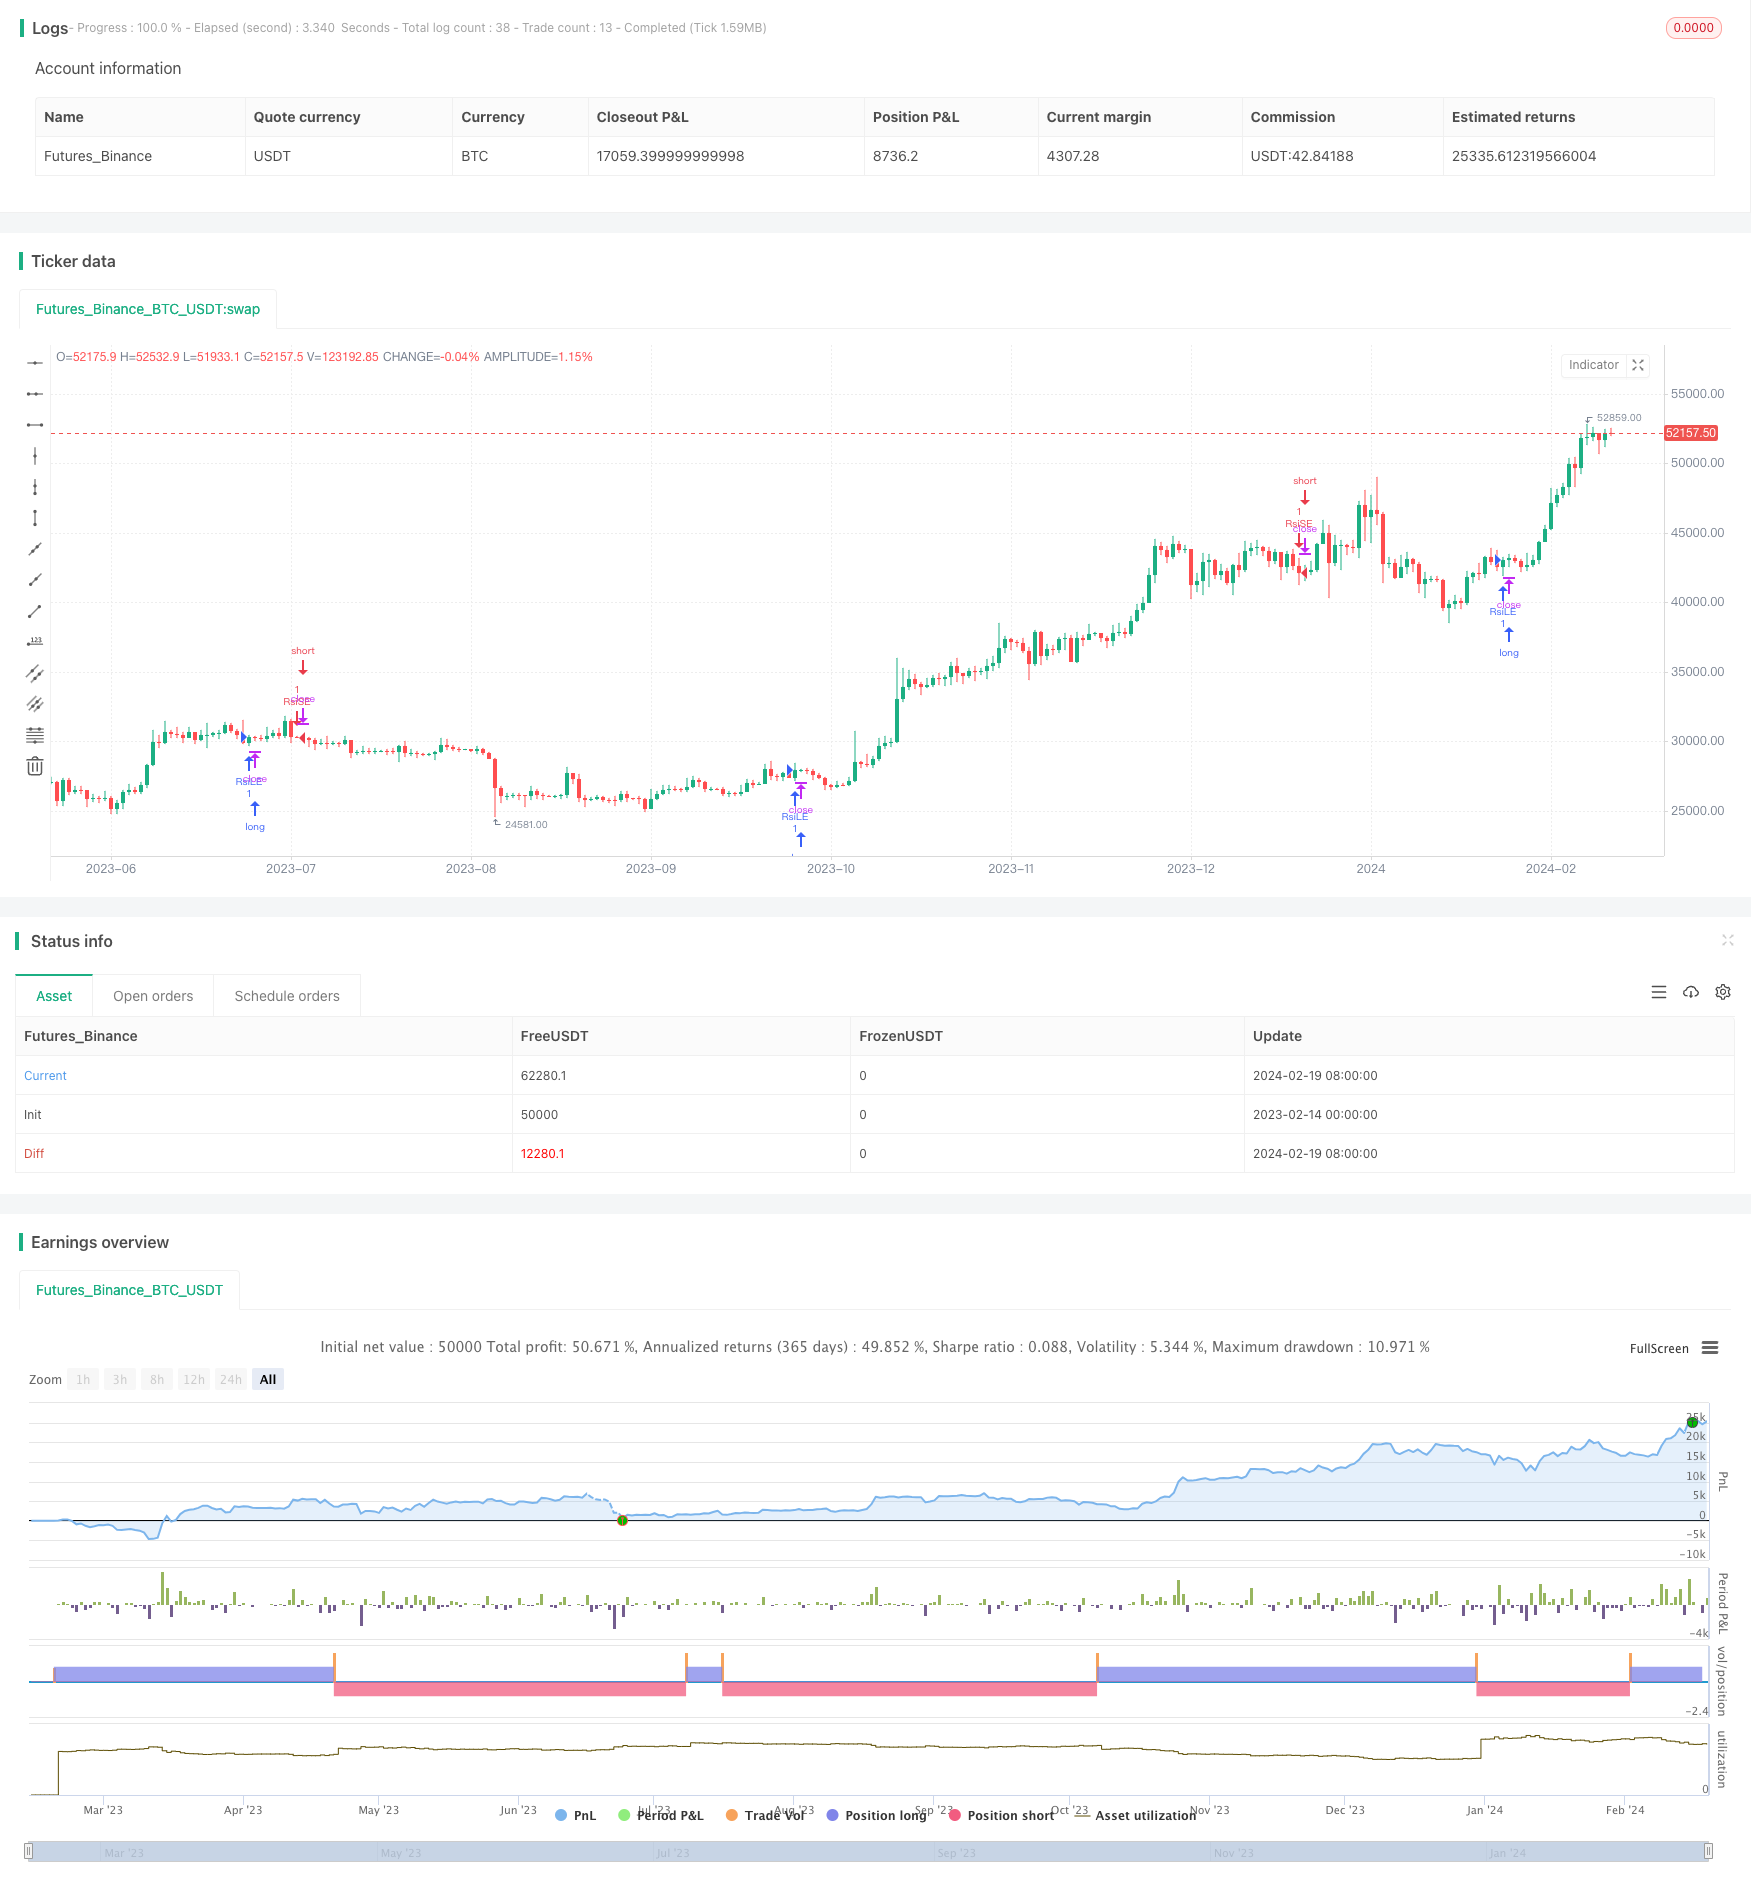
Overview
This strategy is a trend following strategy based on OBV and CCI indicators. It uses OBV indicator to judge market trend and capital flow, and then uses CCI indicator for filtering to generate trading signals. When both OBV and CCI indicators confirm the current uptrend, go long; when both indicators confirm the current downtrend, go short.
Strategy Logic
The strategy mainly relies on OBV and CCI two indicators. OBV indicator can reflect the capital flow in the market. When OBV is green, it means the current trend is capital inflow; when OBV is red, it means the current trend is capital outflow. The CCI indicator is used as a filter. By setting a threshold, when CCI is above threshold, it is considered a bull market; when CCI is below threshold, it is considered a bear market.
For entry signals, if last period OBV value is green (capital inflow) and CCI is above threshold (in a bull market), meanwhile OBV line crosses above its EMA line, a buy signal is generated.
For exit signals, if last period OBV value is red (capital outflow) and CCI is below threshold (in a bear market), meanwhile OBV line crosses below its EMA line, a sell signal is generated.
So by judging the major trend using OBV, filtering with CCI indicator, and combining them using EMA crossovers to generate concrete trading signals, the strategy realizes trend following.
Advantage Analysis
The main advantages of this strategy are:
Using OBV to determine market capital flow and trend direction, avoiding short-term market noise interference;
Leveraging CCI indicator for filtering, making trading signals more reliable;
Using EMA crossovers to generate high quality concrete trading points;
The rules are clear and simple, easy to understand and implement.
Risk Analysis
There are also some potential risks for this strategy:
Possibility of OBV and CCI indicators generating wrong signals;
Frequent trading signals, easy to overtrade;
May be trapped during retracements;
Poor parameter tuning leading to bad strategy performance.
To control these risks, methods like parameter optimization, adjusting trading frequency, setting stop loss and using filters can be applied.
Optimization Directions
The strategy can be optimized from the following aspects:
Evaluate the impact of different parameters and find the optimal parameter combination;
Set trading frequency limit to avoid over trading;
Add stop loss mechanism to control single trade loss;
Add other indicators as filters to improve signal quality;
Optimize entry and exit logic to make trading signals more reliable.
Summary
In summary, this is a basic trend following strategy that can effectively track price trends and avoid noise interference. But there are still some risks, requiring improvements like parameter optimization, stop loss, trading frequency control etc. If parameters are set scientifically, significant backtest performance improvement can be achieved. The strategy suits more advanced quant traders for learning and practicing.
Parameters
| Name | Default | What it controls |
|---|---|---|
| v_input_1 | 20 | CCI Length |
| v_input_2 | false | CCI threshold for OBV coding |
| v_input_3 | 13 | EMA length |
Source Pine Script
/*backtest
start: 2023-02-14 00:00:00
end: 2024-02-20 00:00:00
period: 1d
basePeriod: 1h
exchanges: [{"eid":"Futures_Binance","currency":"BTC_USDT"}]
*/

//author: SudeepBisht
//@version=3
strategy("SB_CCI coded OBV Strategy", overlay=true)

src = close
length = input(20, minval=1, title="CCI Length")
threshold=input(0, title="CCI threshold for OBV coding")
lengthema=input(13, title="EMA length")
obv(src) =>
    cum(change(src) > 0 ? volume : change(src) < 0 ? -volume : 0*volume)

o=obv(src)
c=cci(src, length)
col=c>=threshold?green:red
chk=col==green?1:0
ema_line=ema(o,lengthema)

//plot(o, color=c>=threshold?green:red, title="OBV_CCI coded", linewidth=2)
//plot(ema(o,lengthema), color=orange, linewidth=2)


if (not na(ema_line))
    if (crossover(o, ema_line) and chk[1]==1)
        strategy.entry("RsiLE", strategy.long, comment="RsiLE")
    if (crossunder(o, ema_line) and chk[1]==0)
        strategy.entry("RsiSE", strategy.short, comment="RsiSE")
Published by ChaoZhang on the FMZ strategy square · last modified 2024-02-21. Collected in the Quant Trading Vault. Unvalidated research: re-test with your own data and costs before trusting it.
Build this with AgenKit
A spec is not a trading system. Paste this into your coding agent and AgenKit runs a specialist team — architecture, test-first build, risk gates, review — with paper trading on by default.
/agenkit build a production-grade trading bot with a backtest engine, risk controls and paper trading by default from strategies/OBV-and-CCI-Indicators-Based-Trend-Following-Strategy.md- npx agenkit install engineering-kit in your project
- Paste the command into your agent and approve each phase
- Get tests, backtest, risk controls and a paper-trading switch
Understand it first
Before you run this, read the lesson behind the idea and how to backtest it honestly. Specs like this one are the survivors of an unknown number of trials; deflate their results accordingly.
Related specs
- EMA SMA Multi Indicator Comprehensive Trend Following StrategyPine Script · Trend following · 1h
- Multi Period Trend Following with Volume Confirmation StrategyPine Script · Trend following · 5d
- Supertrend Advance StrategyPine Script · Trend following · 5m
- TSI and CCI Hull Moving Average Trend Tracking StrategyPine Script · Trend following · 1d
- Trend Following Strategy Based on OBV and MA Crossover SignalsPine Script · Trend following · 1d
- Trend Tracking Strategy Based on Multi factor Model with Adaptive Trailing StoplossPine Script · Trend following · 1d