OBV SMA Crossover with RSI Filter Multi Dimensional Momentum Trading Strategy
This strategy is a multi-dimensional momentum trading system that combines On-Balance Volume (OBV), Simple Moving Average (SMA), and Relative Strength Index (RSI). It captures market momentum by monitoring crossover…
Overview
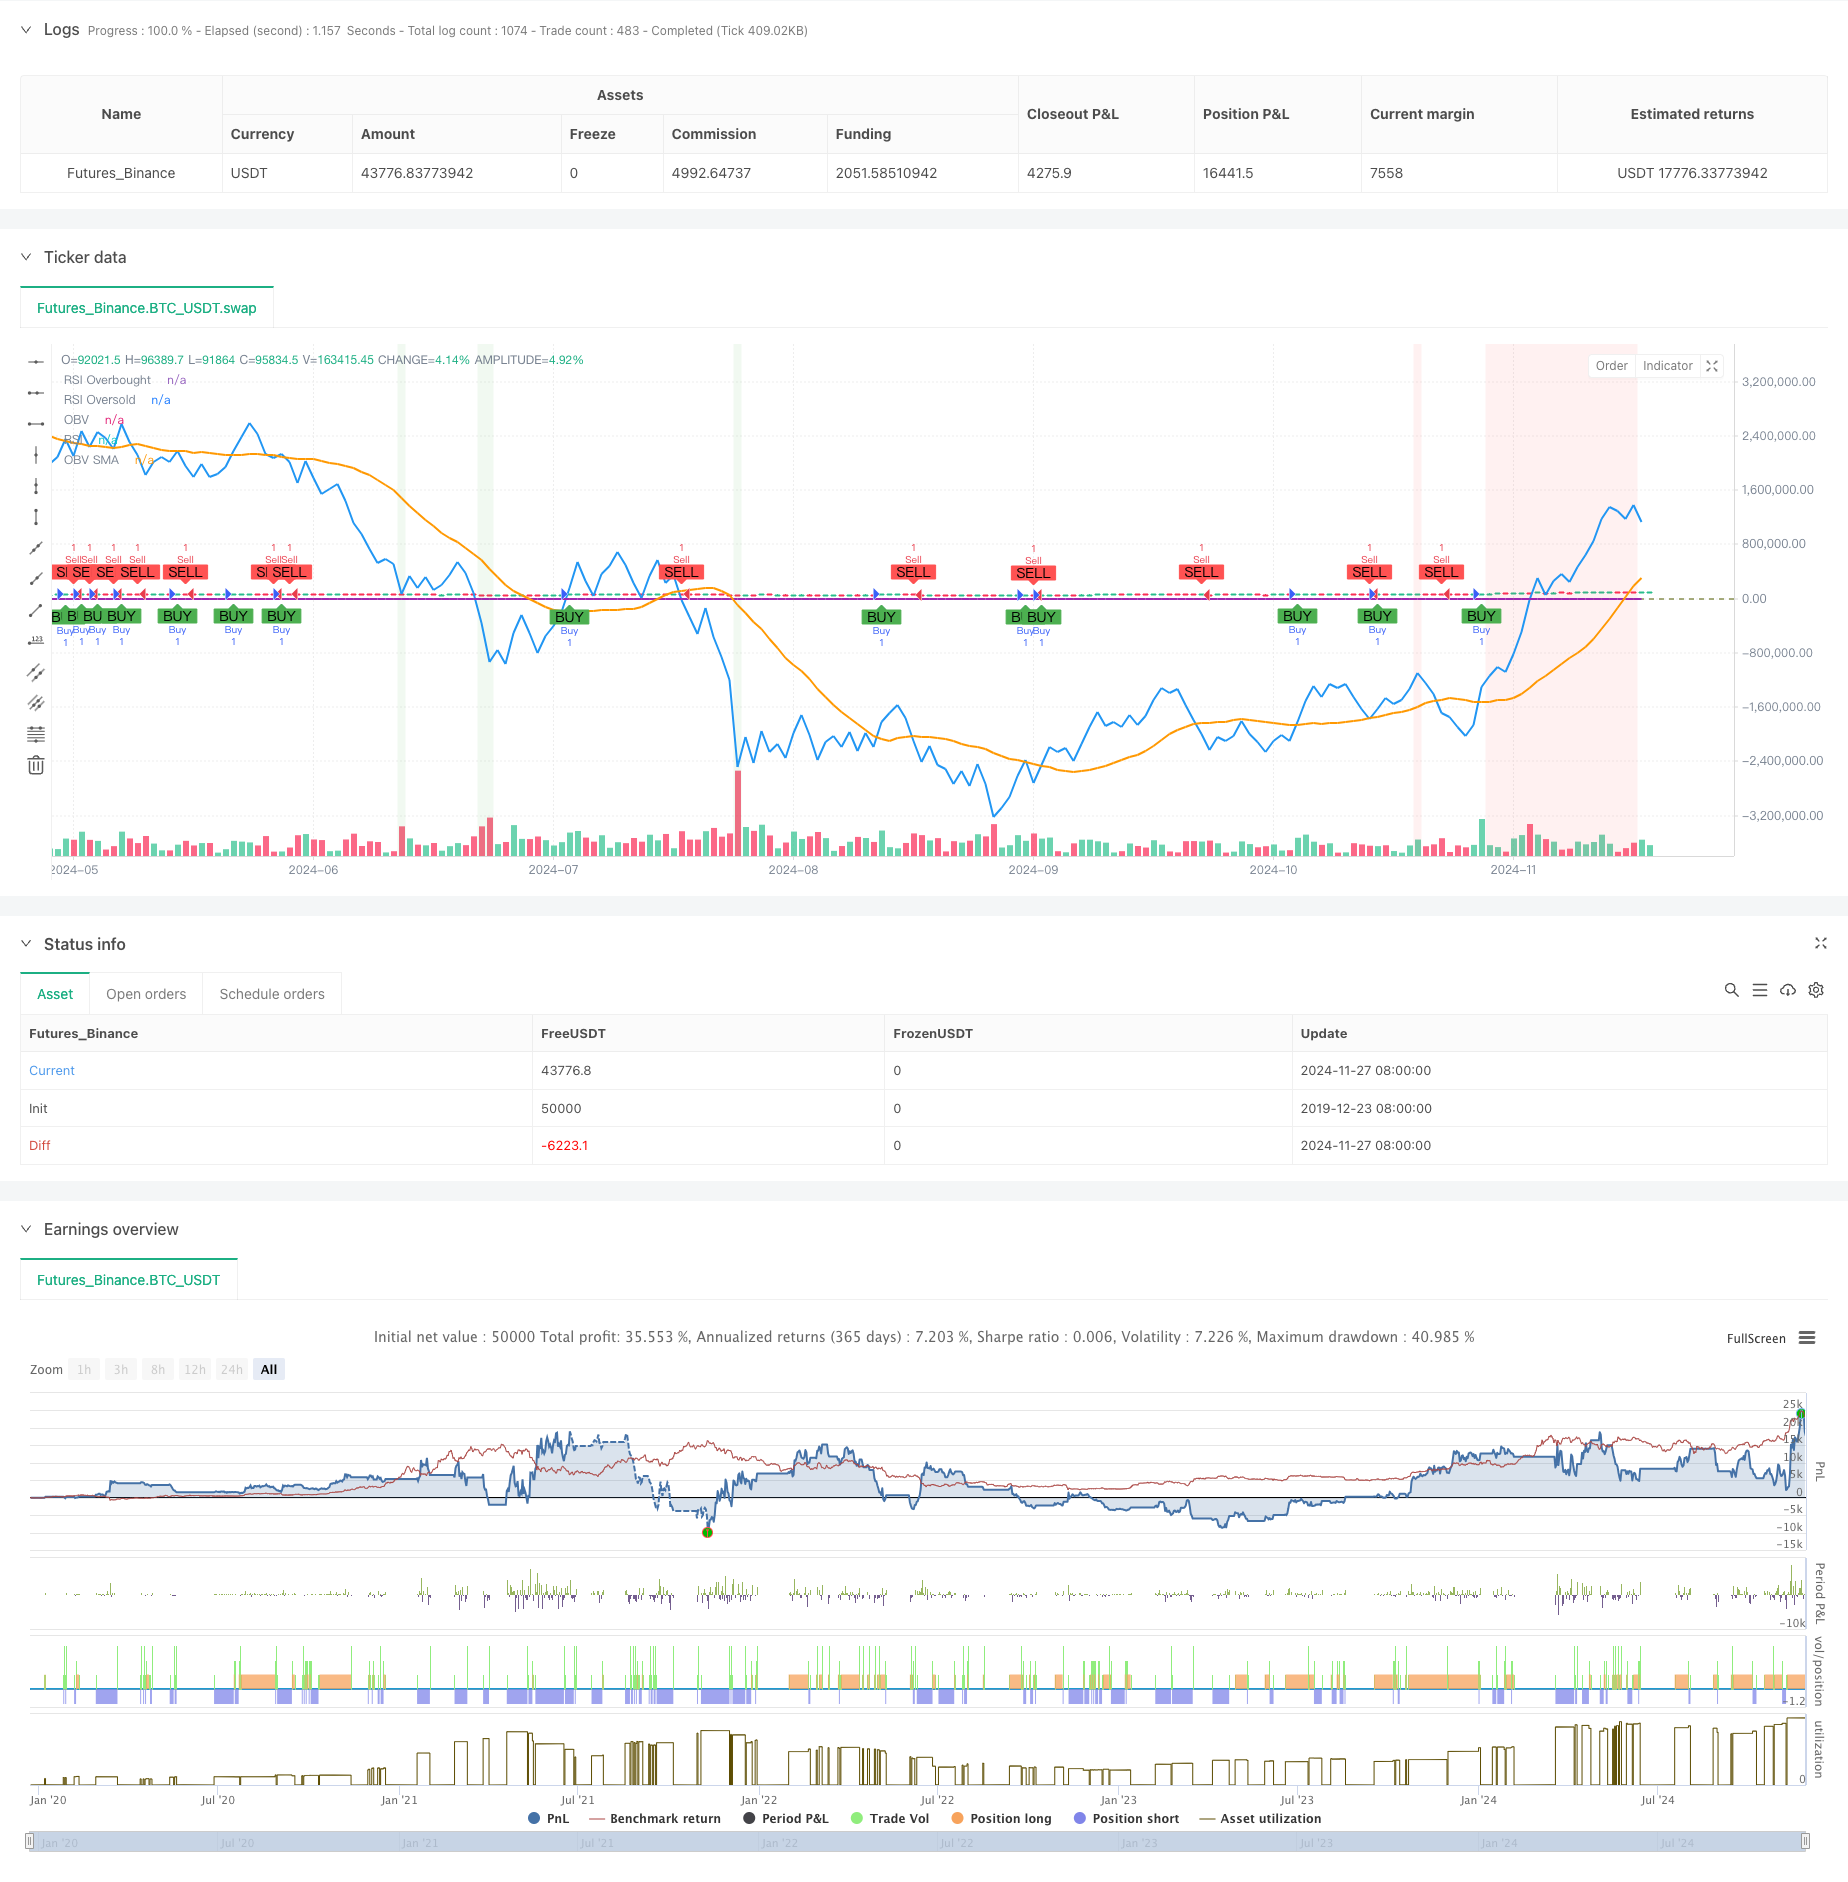
This strategy is a multi-dimensional momentum trading system that combines On-Balance Volume (OBV), Simple Moving Average (SMA), and Relative Strength Index (RSI). It captures market momentum by monitoring crossover signals between OBV and its moving average, while using RSI as a filter to avoid excessive trend chasing. The strategy also incorporates percentage-based stop-loss and take-profit mechanisms to achieve balanced risk-reward management.
Strategy Principles
The core logic is built on three dimensions:
- OBV indicator measures cumulative volume sentiment by calculating the accumulated volume based on price movement direction to reflect market buying and selling power.
- The 20-period moving average of OBV serves as a baseline. Long signals are triggered when OBV crosses above its moving average with RSI below 70, while short signals are triggered when OBV crosses below with RSI above 30.
- RSI implementation serves as a filter to prevent trading in overbought/oversold areas, effectively reducing false breakout risks.
The strategy employs fixed percentage stop-loss (2%) and take-profit (4%) levels, creating a symmetric risk management framework that helps maintain a stable risk-reward ratio.
Strategy Advantages
- Multi-dimensional signal confirmation reduces the impact of false signals
- Organic integration of volume, price momentum, and overbought/oversold indicators
- Clear risk management framework with fixed stop-loss and profit targets
- Simple and clear strategy logic, easy to understand and maintain
- Excellent visualization design with clear trading signals and indicator display
Strategy Risks
- May trigger frequent stop-losses in high volatility markets
- Fixed percentage stops may not suit all market conditions
- RSI filtering conditions might miss important trend initiations
- OBV indicators may generate misleading signals in low liquidity environments
- Strategy doesn't account for market cyclical characteristics
Strategy Optimization Directions
- Introduce adaptive stop-loss mechanisms, such as ATR-based or volatility-adjusted stops
- Add trend filters, such as long-period moving averages for main trend direction
- Optimize RSI parameters, consider dynamic adjustment of overbought/oversold thresholds
- Add volume screening conditions to ensure signals trigger with valid volume support
- Consider time filters to avoid high volatility periods
- Implement position management mechanisms for dynamic position adjustment
Summary
This is a well-designed multi-dimensional momentum trading strategy that builds a complete trading system by combining the advantages of technical indicators. The core strength lies in its multi-layered signal confirmation mechanism and standardized risk management framework. While there are potential risks, the suggested optimization directions can further enhance the strategy's robustness and adaptability. The strategy's practical value is mainly reflected in its clear logic, ease of implementation, and maintenance. Traders are advised to thoroughly test performance under different market conditions and optimize parameters according to specific needs before live deployment.
Source Pine Script
/*backtest
start: 2019-12-23 08:00:00
end: 2024-11-28 00:00:00
period: 1d
basePeriod: 1d
exchanges: [{"eid":"Futures_Binance","currency":"BTC_USDT"}]
*/

//@version=5
strategy("OBV Strategy with SMA, RSI, SL and TP (Improved Visualization)", overlay=true)

// حساب OBV يدويًا
obv = ta.cum(math.sign(close - close[1]) * volume)

// إعداد المتوسط المتحرك البسيط لـ OBV
lengthOBV = input(20, title="OBV SMA Length")
obvSMA = ta.sma(obv, lengthOBV)

// إعداد مؤشر RSI
lengthRSI = input(14, title="RSI Length")
rsi = ta.rsi(close, lengthRSI)

// إعدادات وقف الخسارة وجني الأرباح
stopLossPerc = input(2.0, title="Stop Loss %") / 100   // 2% وقف خسارة
takeProfitPerc = input(4.0, title="Take Profit %") / 100   // 4% جني أرباح

// حساب مستوى وقف الخسارة وجني الأرباح
longStopLoss = close * (1 - stopLossPerc)
longTakeProfit = close * (1 + takeProfitPerc)
shortStopLoss = close * (1 + stopLossPerc)
shortTakeProfit = close * (1 - takeProfitPerc)

// إعداد شروط الشراء
longCondition = ta.crossover(obv, obvSMA) and rsi < 70
if (longCondition)
    strategy.entry("Buy", strategy.long)
    strategy.exit("Take Profit/Stop Loss", "Buy", stop=longStopLoss, limit=longTakeProfit)

// إعداد شروط البيع
shortCondition = ta.crossunder(obv, obvSMA) and rsi > 30
if (shortCondition)
    strategy.entry("Sell", strategy.short)
    strategy.exit("Take Profit/Stop Loss", "Sell", stop=shortStopLoss, limit=shortTakeProfit)

// رسم OBV والمؤشرات الأخرى على الرسم البياني
plot(obv, title="OBV", color=color.blue, linewidth=2) // رسم OBV بخط أزرق عريض
plot(obvSMA, title="OBV SMA", color=color.orange, linewidth=2) // رسم SMA بخط برتقالي

// رسم إشارات الشراء والبيع على الرسم البياني
plotshape(series=longCondition, title="Buy Signal", location=location.belowbar, color=color.green, style=shape.labelup, text="BUY")
plotshape(series=shortCondition, title="Sell Signal", location=location.abovebar, color=color.red, style=shape.labeldown, text="SELL")

// رسم RSI في نافذة منفصلة بوضوح أكبر
hline(70, "RSI Overbought", color=color.red, linestyle=hline.style_dashed)
hline(30, "RSI Oversold", color=color.green, linestyle=hline.style_dashed)
plot(rsi, title="RSI", color=color.purple, linewidth=2)

// إضافة منطقة RSI بالألوان
bgcolor(rsi > 70 ? color.new(color.red, 90) : rsi < 30 ? color.new(color.green, 90) : na)
Published by ChaoZhang on the FMZ strategy square · last modified 2024-11-29. Collected in the Quant Trading Vault. Unvalidated research: re-test with your own data and costs before trusting it.
Build this with AgenKit
A spec is not a trading system. Paste this into your coding agent and AgenKit runs a specialist team — architecture, test-first build, risk gates, review — with paper trading on by default.
/agenkit build a production-grade trading bot with a backtest engine, risk controls and paper trading by default from strategies/OBV-SMA-Crossover-with-RSI-Filter-Multi-Dimensional-Momentum-Trading-Strategy.md- npx agenkit install engineering-kit in your project
- Paste the command into your agent and approve each phase
- Get tests, backtest, risk controls and a paper-trading switch
Understand it first
Before you run this, read the lesson behind the idea and how to backtest it honestly. Specs like this one are the survivors of an unknown number of trials; deflate their results accordingly.
Related specs
- Multi Indicator Comprehensive Analysis Quantitative Trading Strategy Trend Momentum and Volatility Collaborative Prediction ModelPine Script · Momentum · 3m
- Multi Indicator Adaptive Momentum Crossover Trading SystemPine Script · Momentum · 1h
- Volume MA based Adaptive Pyramiding Dynamic Stop Loss and Take Profit Trading StrategyPine Script · Momentum · 1d
- KST EMA Momentum Trend Following StrategyPine Script · Momentum · 1d
- Multi EMA Trend Momentum Trading Strategy with Risk Management SystemPine Script · Momentum · 1h
- Multi Indicator Trend Momentum Trading Strategy with Dynamic Risk Management SystemPine Script · Momentum · 1h