Strategy vault / Mean reversion
Oma and Apollo Dual Rail Trading Strategy
This strategy combines two mainstream technical indicators: the Oma indicator and the Apollo indicator to implement dual-rail trading of long and short positions. Its basic idea is to find short-term pullback…
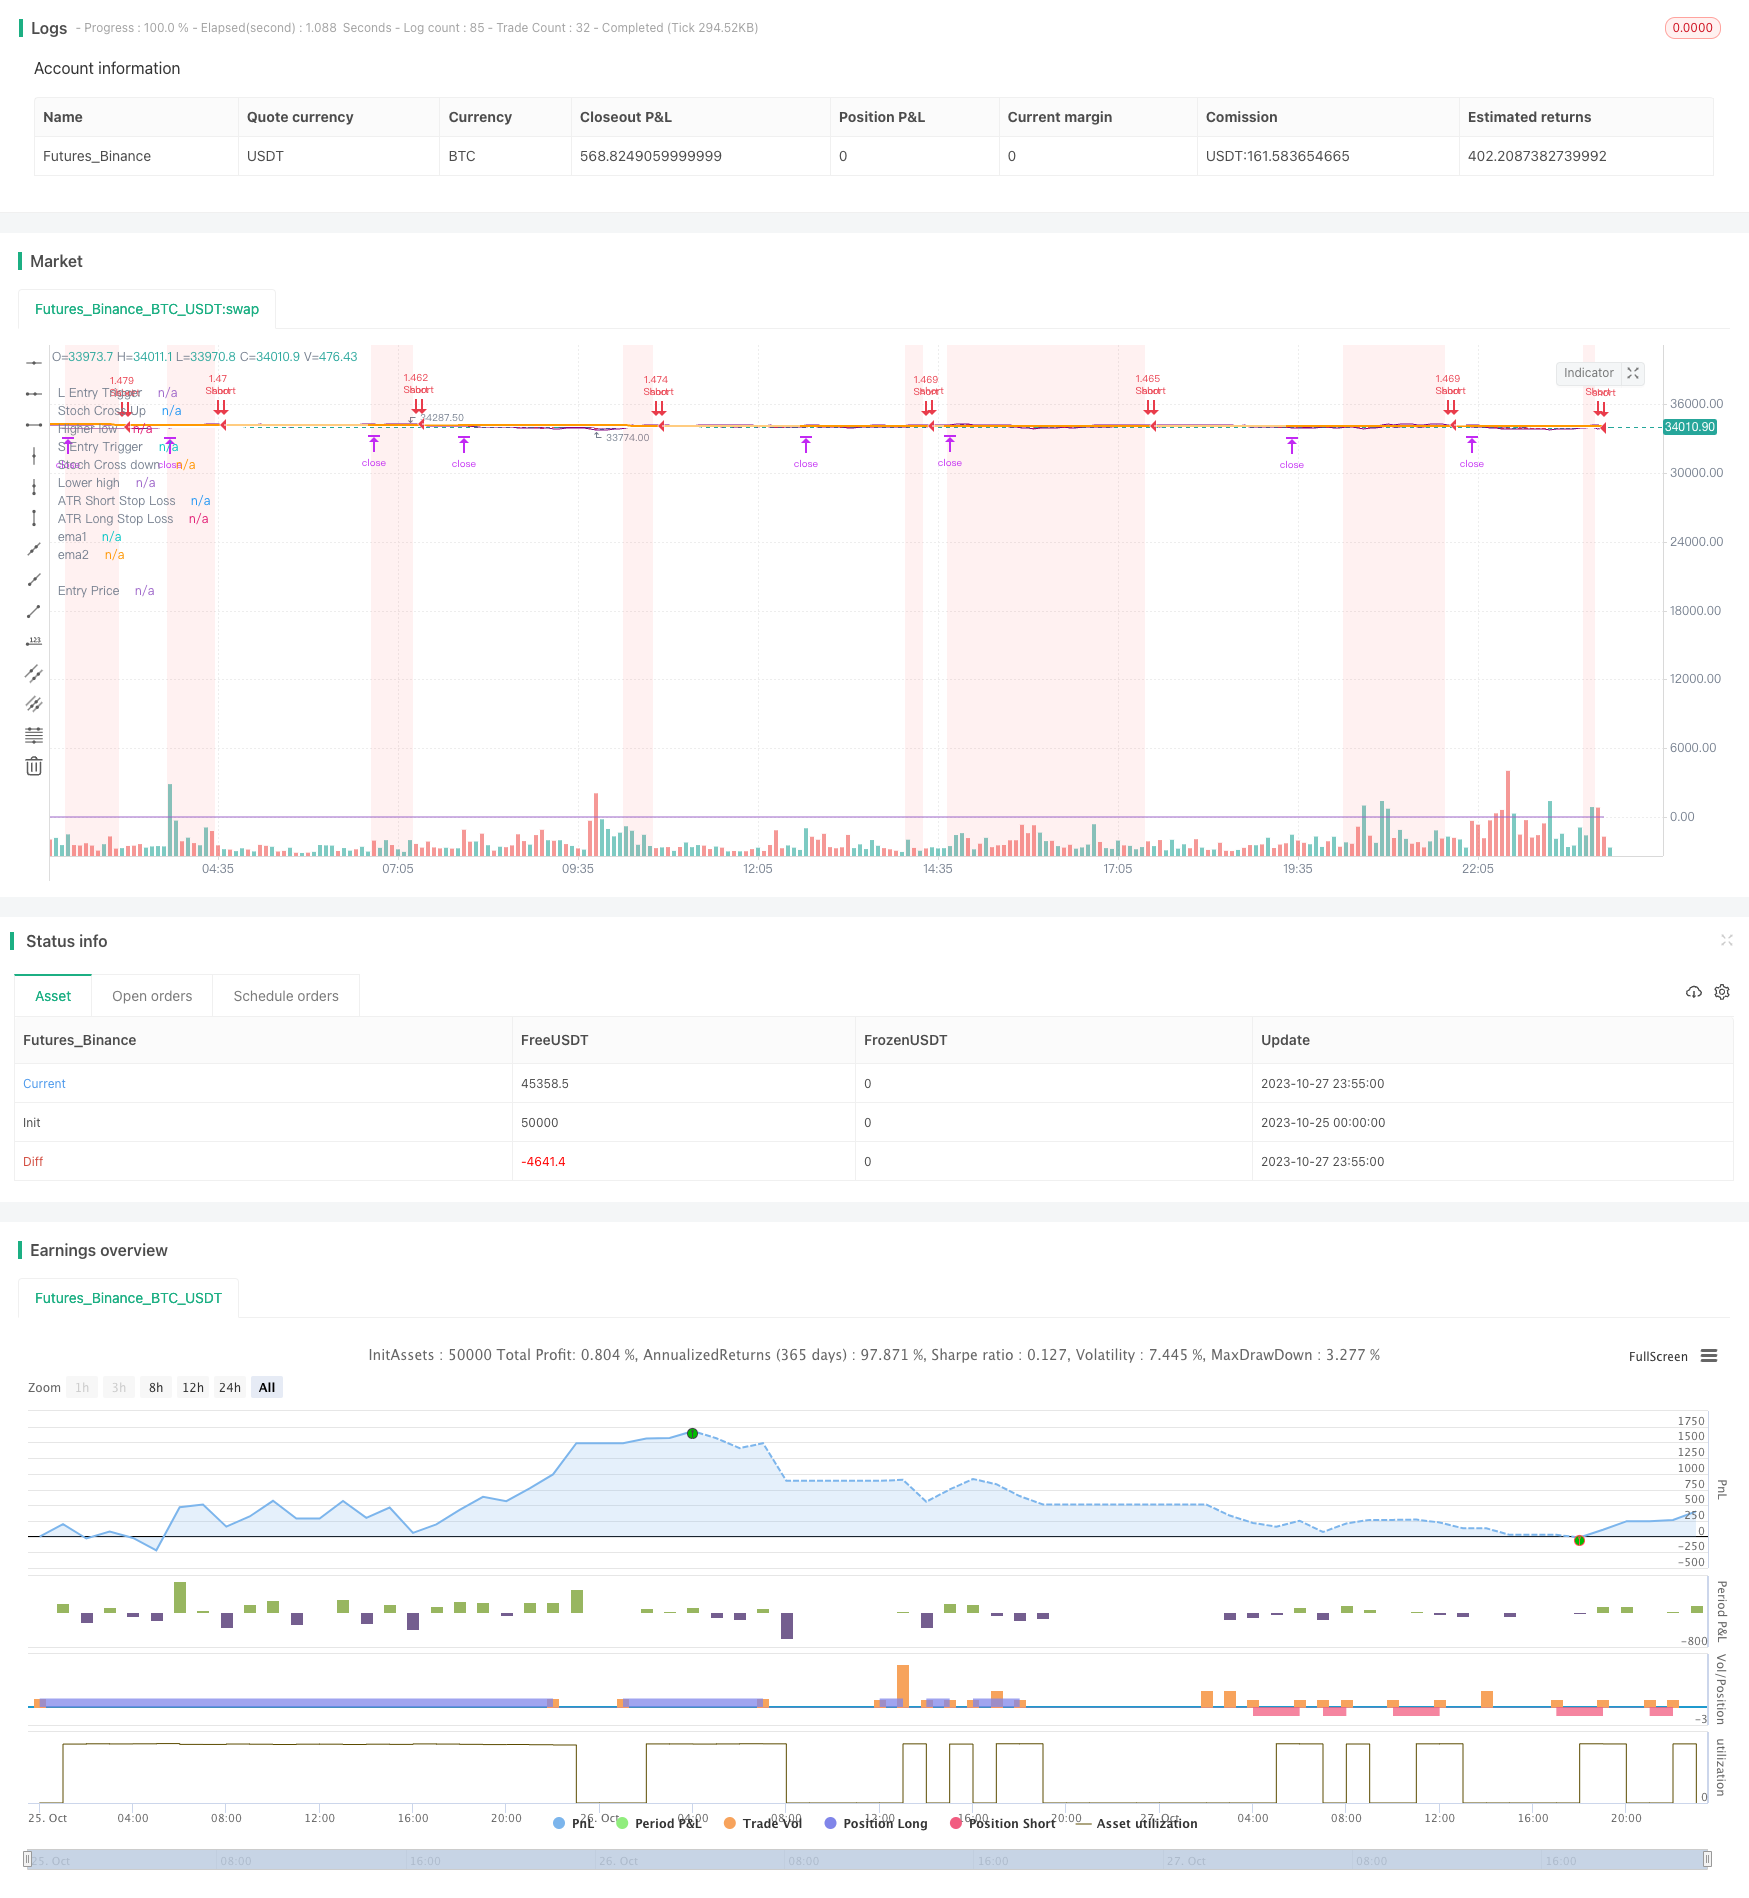
Overview
This strategy combines two mainstream technical indicators: the Oma indicator and the Apollo indicator to implement dual-rail trading of long and short positions. Its basic idea is to find short-term pullback opportunities when the medium-long term trend is judged to be bullish in order to establish long positions. When the medium-long term trend is judged to be bearish, it looks for opportunities in short-term rebounds to establish short positions.
Strategy Principle
This strategy uses 50-day and 200-day moving averages to determine the medium-long term trend. The 50-day line above the 200-day line indicates a bullish trend, and vice versa for a bearish trend.
Next, the strategy uses the Oma indicator to locate short-term price reversal opportunities. The Oma indicator includes %K and %D lines, which are the results of the RSI indicator smoothed by a simple moving average. When %K breaks below %D from the overbought area (above 80), it indicates the price is turning from an overbought state to a pullback down; when %K breaks above %D from the oversold area (below 20), it indicates the price is rebounding up from the oversold area, which presents a long opportunity.
In addition, to further filter false signals, this strategy also incorporates the Apollo indicator. The Apollo indicator displays the extreme points of the %D values of the K line. When %K forms a new low, it means the rebound strength is relatively weak. When it forms a new high, it means the rebound strength is relatively strong. Combined with the signals from the Oma indicator, this can further improve the accuracy of entry.
Specifically, in an uptrend, this strategy will check the new high point information at the same time when the Oma indicator shows an opportunity below the overbought area, to confirm the strength of the bounce. In a downtrend, when the Oma indicator shows a short opportunity crossing up from the oversold area, this strategy will check the new low point information at the same time to confirm the weakening of the rebound strength.
Through the above process, this strategy takes full advantage of the strengths of medium-long term trend judgment and short-term reversal indicators to build a steady dual-rail trading system.
Advantages of the Strategy
The strategy combines trend trading and countertrend trading by using both trend judgment and reversal indicators, forming a stable hybrid trading framework.
By double indicator filtering, the false signal ratio can be reduced and the reliability of signals improved.
The strategy parameters are relatively simple, easy to understand and optimize, suitable for quantitative trading.
The performance of the strategy is robust, with good win rate and risk-reward ratio characteristics.
By adopting dual rails for long and short, trading opportunities can be obtained continuously without being limited to a single direction.
Risks of the Strategy
As a reversal strategy, consecutive losses may occur when the trend changes.
The strategy requires relatively high emotional control from the trader, who needs to withstand a certain level of drawdown.
Some parameters such as moving average periods involve a certain subjectivity and need to be determined through backtesting and optimization.
Both the Oma and Apollo indicators have some sensitivity to abnormal fluctuations, and may fail in extreme market conditions.
This strategy is more suitable for range-bound volatile markets, and may underperform in strong trending markets.
Risks can be mitigated by appropriately adjusting the moving average period to introduce trend filtering, and adding stop loss/take profit. When the market becomes strongly trending, consider suspending the strategy to avoid trading in that environment.
Optimization Directions
Test different parameter combinations to obtain better parameter settings, e.g. using EWMA smoothing moving averages.
Add Volume or BV indicators to judge divergence which can help verify signal reliability.
Add volatility indices like VIX as monitoring indicators, to reduce position size when the market is in panic.
Optimize stop loss/take profit strategies, such as adopting dynamic ATR stop loss.
Introduce machine learning algorithms to dynamically optimize parameter settings.
Add multifactor models to improve signal quality.
Summary
Overall, this is a stable and efficient quantitative trading strategy. It combines trend judgment and reversal indicators, and adopts dual verification using the Oma and Apollo indicators, which can effectively uncover short-term price reversal opportunities. Compared to using purely trend or reversal systems, this strategy form is more robust with superior drawdown control, and is a recommended quantitative trading strategy. Of course, users also need to be aware of the risks involved, and use parameter optimization, stop loss/take profit, market regime identification etc. to control risks and achieve the best performance.
Parameters
| Name | Default | What it controls |
|---|---|---|
| v_input_1 | 2011 | (?Backtesting window)Start Year |
| v_input_int_1 | true | Start Month |
| v_input_int_2 | true | Start Day |
| v_input_2 | 2050 | Finish Year |
| v_input_int_3 | 12 | Finish Month |
| v_input_int_4 | 31 | Finish Day |
| v_input_int_5 | 50 | (?EMA)EMA Length 1 |
| v_input_int_6 | 200 | EMA Length 2 |
| v_input_int_7 | 3 | (?Stochastic RSI)K |
| v_input_int_8 | 3 | D |
| v_input_int_9 | 14 | RSI Length |
| v_input_int_10 | 14 | Stochastic Length |
| v_input_int_11 | 14 | (?ATR Stoploss Finder)Length |
| v_input_string_1 | 0 | Smoothing: EMA | SMA | RMA | WMA |
| v_input_float_1 | 0.7 | Multiplier |
| v_input_3_high | 0 | Source for upper band: high | close | low | open | hl2 | hlc3 | hlcc4 | ohlc4 |
| v_input_4_low | 0 | Source for lower band: low | high | close | open | hl2 | hlc3 | hlcc4 | ohlc4 |
| v_input_bool_1 | true | Show ATR Bands |
| v_input_color_1 | purple | Long ATR SL |
| v_input_color_2 | purple | Short ATR SL |
| v_input_float_2 | 2 | (?Profit Target)Reward to Risk ratio (X times SL) |
Source Pine Script
/*backtest
start: 2023-10-25 00:00:00
end: 2023-10-28 00:00:00
period: 5m
basePeriod: 1m
exchanges: [{"eid":"Futures_Binance","currency":"BTC_USDT"}]
*/

// This source code is subject to the terms of the Mozilla Public License 2.0 at https://mozilla.org/MPL/2.0/
// © PtGambler

//@version=5
strategy("2 EMA + Stoch RSI + ATR [Pt]", shorttitle = "2EMA+Stoch+ATR", overlay=true, initial_capital = 10000, default_qty_type = strategy.percent_of_equity, default_qty_value = 100, calc_on_order_fills = false, max_bars_back = 500)

// ********************************** Trade Period / Strategy Setting **************************************
startY = input(title='Start Year', defval=2011, group = "Backtesting window")
startM = input.int(title='Start Month', defval=1, minval=1, maxval=12, group = "Backtesting window")
startD = input.int(title='Start Day', defval=1, minval=1, maxval=31, group = "Backtesting window")
finishY = input(title='Finish Year', defval=2050, group = "Backtesting window")
finishM = input.int(title='Finish Month', defval=12, minval=1, maxval=12, group = "Backtesting window")
finishD = input.int(title='Finish Day', defval=31, minval=1, maxval=31, group = "Backtesting window")
timestart = timestamp(startY, startM, startD, 00, 00)
timefinish = timestamp(finishY, finishM, finishD, 23, 59)

// ******************************************************************************************

group_ema = "EMA"
group_stoch = "Stochastic RSI"
group_atr = "ATR Stoploss Finder"

// ----------------------------------------- 2 EMA -------------------------------------

ema1_len = input.int(50, "EMA Length 1", group = group_ema)
ema2_len = input.int(200, "EMA Length 2", group = group_ema)

ema1 = ta.ema(close, ema1_len)
ema2 = ta.ema(close, ema2_len)

plot(ema1, "ema1", color.white, linewidth = 2)
plot(ema2, "ema2", color.orange, linewidth = 2)

ema_bull = ema1 > ema2
ema_bear = ema1 < ema2


// -------------------------------------- Stochastic RSI -----------------------------

smoothK = input.int(3, "K", minval=1, group = group_stoch)
smoothD = input.int(3, "D", minval=1, group = group_stoch)
lengthRSI = input.int(14, "RSI Length", minval=1, group = group_stoch)
lengthStoch = input.int(14, "Stochastic Length", minval=1, group = group_stoch)
src = close
rsi1 = ta.rsi(src, lengthRSI)
k = ta.sma(ta.stoch(rsi1, rsi1, rsi1, lengthStoch), smoothK)
d = ta.sma(k, smoothD)

var trigger_stoch_OB = k > 80
var trigger_stoch_OS = k < 20

stoch_crossdown = ta.crossunder(k, d)
stoch_crossup = ta.crossover(k, d)

P_hi = ta.pivothigh(k,1,1)
P_lo = ta.pivotlow(k,1,1)

previous_high = ta.valuewhen(P_hi, k, 1)
previous_low = ta.valuewhen(P_lo, k, 1)
recent_high = ta.valuewhen(P_hi, k, 0)
recent_low = ta.valuewhen(P_lo, k, 0)

// --------------------------------------- ATR stop loss finder ------------------------

length = input.int(title='Length', defval=14, minval=1, group = group_atr)
smoothing = input.string(title='Smoothing', defval='EMA', options=['RMA', 'SMA', 'EMA', 'WMA'], group = group_atr)
m = input.float(0.7, 'Multiplier', step = 0.1, group = group_atr)
src1 = input(high, "Source for upper band", group = group_atr)
src2 = input(low, "Source for lower band", group = group_atr)

showatr = input.bool(true, 'Show ATR Bands', group = group_atr)
collong = input.color(color.purple, 'Long ATR SL', inline='1', group = group_atr)
colshort = input.color(color.purple, 'Short ATR SL', inline='2', group = group_atr)

ma_function(source, length) =>
    if smoothing == 'RMA'
        ta.rma(source, length)
    else
        if smoothing == 'SMA'
            ta.sma(source, length)
        else
            if smoothing == 'EMA'
                ta.ema(source, length)
            else
                ta.wma(source, length)

a = ma_function(ta.tr(true), length) * m
up = ma_function(ta.tr(true), length) * m + src1
down = src2 - ma_function(ta.tr(true), length) * m

p1 = plot(showatr ? up : na, title='ATR Short Stop Loss', color=colshort)
p2 = plot(showatr ? down : na, title='ATR Long Stop Loss', color=collong)

// ******************************* Profit Target / Stop Loss *********************************************

RR = input.float(2.0, "Reward to Risk ratio (X times SL)", step = 0.1, group = "Profit Target")

var L_PT = 0.0
var S_PT = 0.0
var L_SL = 0.0
var S_SL = 0.0

BSLE = ta.barssince(strategy.opentrades.entry_bar_index(0) == bar_index)

if strategy.position_size > 0 and BSLE == 1
    L_PT := close + (close-down)*RR
    L_SL := L_SL[1]
    S_PT := close - (up - close)*RR
    S_SL := up
else if strategy.position_size < 0 and BSLE == 1
    S_PT := close - (up - close)*RR
    S_SL := S_SL[1]
    L_PT := close + (close-down)*RR
    L_SL := down
else if strategy.position_size != 0
    L_PT := L_PT[1]
    S_PT := S_PT[1]
else
    L_PT := close + (close-down)*RR
    L_SL := down
    S_PT := close - (up - close)*RR
    S_SL := up

entry_line = plot(strategy.position_size != 0 ? strategy.opentrades.entry_price(0) : na, "Entry Price", color.white, linewidth = 1, style = plot.style_linebr)

L_PT_line = plot(strategy.position_size > 0 and BSLE > 0 ? L_PT : na, "L PT", color.green, linewidth = 2, style = plot.style_linebr)
S_PT_line = plot(strategy.position_size < 0 and BSLE > 0 ? S_PT : na, "S PT", color.green, linewidth = 2, style = plot.style_linebr)

L_SL_line = plot(strategy.position_size > 0 and BSLE > 0 ? L_SL : na, "L SL", color.red, linewidth = 2, style = plot.style_linebr)
S_SL_line = plot(strategy.position_size < 0 and BSLE > 0 ? S_SL : na, "S SL", color.red, linewidth = 2, style = plot.style_linebr)

fill(L_PT_line, entry_line, color = color.new(color.green,90))
fill(S_PT_line, entry_line, color = color.new(color.green,90))
fill(L_SL_line, entry_line, color = color.new(color.red,90))
fill(S_SL_line, entry_line, color = color.new(color.red,90))


// ---------------------------------- strategy setup ------------------------------------------------------

var L_entry_trigger1 = false
var S_entry_trigger1 = false

L_entry_trigger1 := ema_bull and close < ema1 and k < 20 and strategy.position_size == 0
S_entry_trigger1 := ema_bear and close > ema1 and k > 80 and strategy.position_size == 0

L_entry1 = L_entry_trigger1[1] and stoch_crossup and recent_low > previous_low
S_entry1 = S_entry_trigger1[1] and stoch_crossdown and recent_high < previous_high

//debugging
plot(L_entry_trigger1[1]?1:0, "L Entry Trigger")
plot(stoch_crossup?1:0, "Stoch Cross Up")
plot(recent_low > previous_low?1:0, "Higher low")

plot(S_entry_trigger1[1]?1:0, "S Entry Trigger")
plot(stoch_crossdown?1:0, "Stoch Cross down")
plot(recent_high < previous_high?1:0, "Lower high")

if L_entry1
    strategy.entry("Long", strategy.long)

if S_entry1
    strategy.entry("Short", strategy.short)

strategy.exit("Exit Long", "Long", limit = L_PT, stop = L_SL, comment_profit = "Exit Long, PT hit", comment_loss = "Exit Long, SL hit")
strategy.exit("Exit Short", "Short", limit = S_PT, stop = S_SL, comment_profit = "Exit Short, PT hit", comment_loss = "Exit Short, SL hit")

//resetting triggers
L_entry_trigger1 := L_entry_trigger1[1] ? L_entry1 or ema_bear or S_entry1 ? false : true : L_entry_trigger1
S_entry_trigger1 := S_entry_trigger1[1] ? S_entry1 or ema_bull or L_entry1 ? false : true : S_entry_trigger1

//Trigger zones
bgcolor(L_entry_trigger1 ? color.new(color.green ,90) : na)
bgcolor(S_entry_trigger1 ? color.new(color.red,90) : na)Published by ChaoZhang on the FMZ strategy square · last modified 2023-11-02. Collected in the Quant Trading Vault. Unvalidated research: re-test with your own data and costs before trusting it.
Build this with AgenKit
A spec is not a trading system. Paste this into your coding agent and AgenKit runs a specialist team — architecture, test-first build, risk gates, review — with paper trading on by default.
/agenkit build a production-grade trading bot with a backtest engine, risk controls and paper trading by default from strategies/Oma-and-Apollo-Dual-Rail-Trading-Strategy.md- npx agenkit install engineering-kit in your project
- Paste the command into your agent and approve each phase
- Get tests, backtest, risk controls and a paper-trading switch
Understand it first
Before you run this, read the lesson behind the idea and how to backtest it honestly. Specs like this one are the survivors of an unknown number of trials; deflate their results accordingly.
Related specs
- Advanced Momentum EMA Trend Following with RSI Overbought Oversold Trading StrategyPine Script · Mean reversion · 1d
- Dynamic Adaptive Multi Timeframe Trend Following and Range Reversal Hybrid StrategyPine Script · Mean reversion · 2d
- 3EMA with Stochastic RSI StrategyPine Script · Mean reversion · 1h
- Multi Indicator Weighted Smart Trading StrategyPine Script · Mean reversion · 2d
- Bollinger Bands Trend Reversal StrategyPine Script · Mean reversion · 10m
- Dual Moving Average Stochastic StrategyPine Script · Mean reversion · 1d