Strategy vault / Mean reversion
Oscillation Tracking Short term Strategy
This strategy uses the changes in the highest and lowest prices of K-lines to judge the direction and intensity of market oscillation, and combines moving average to judge the overall trend to implement short-term…
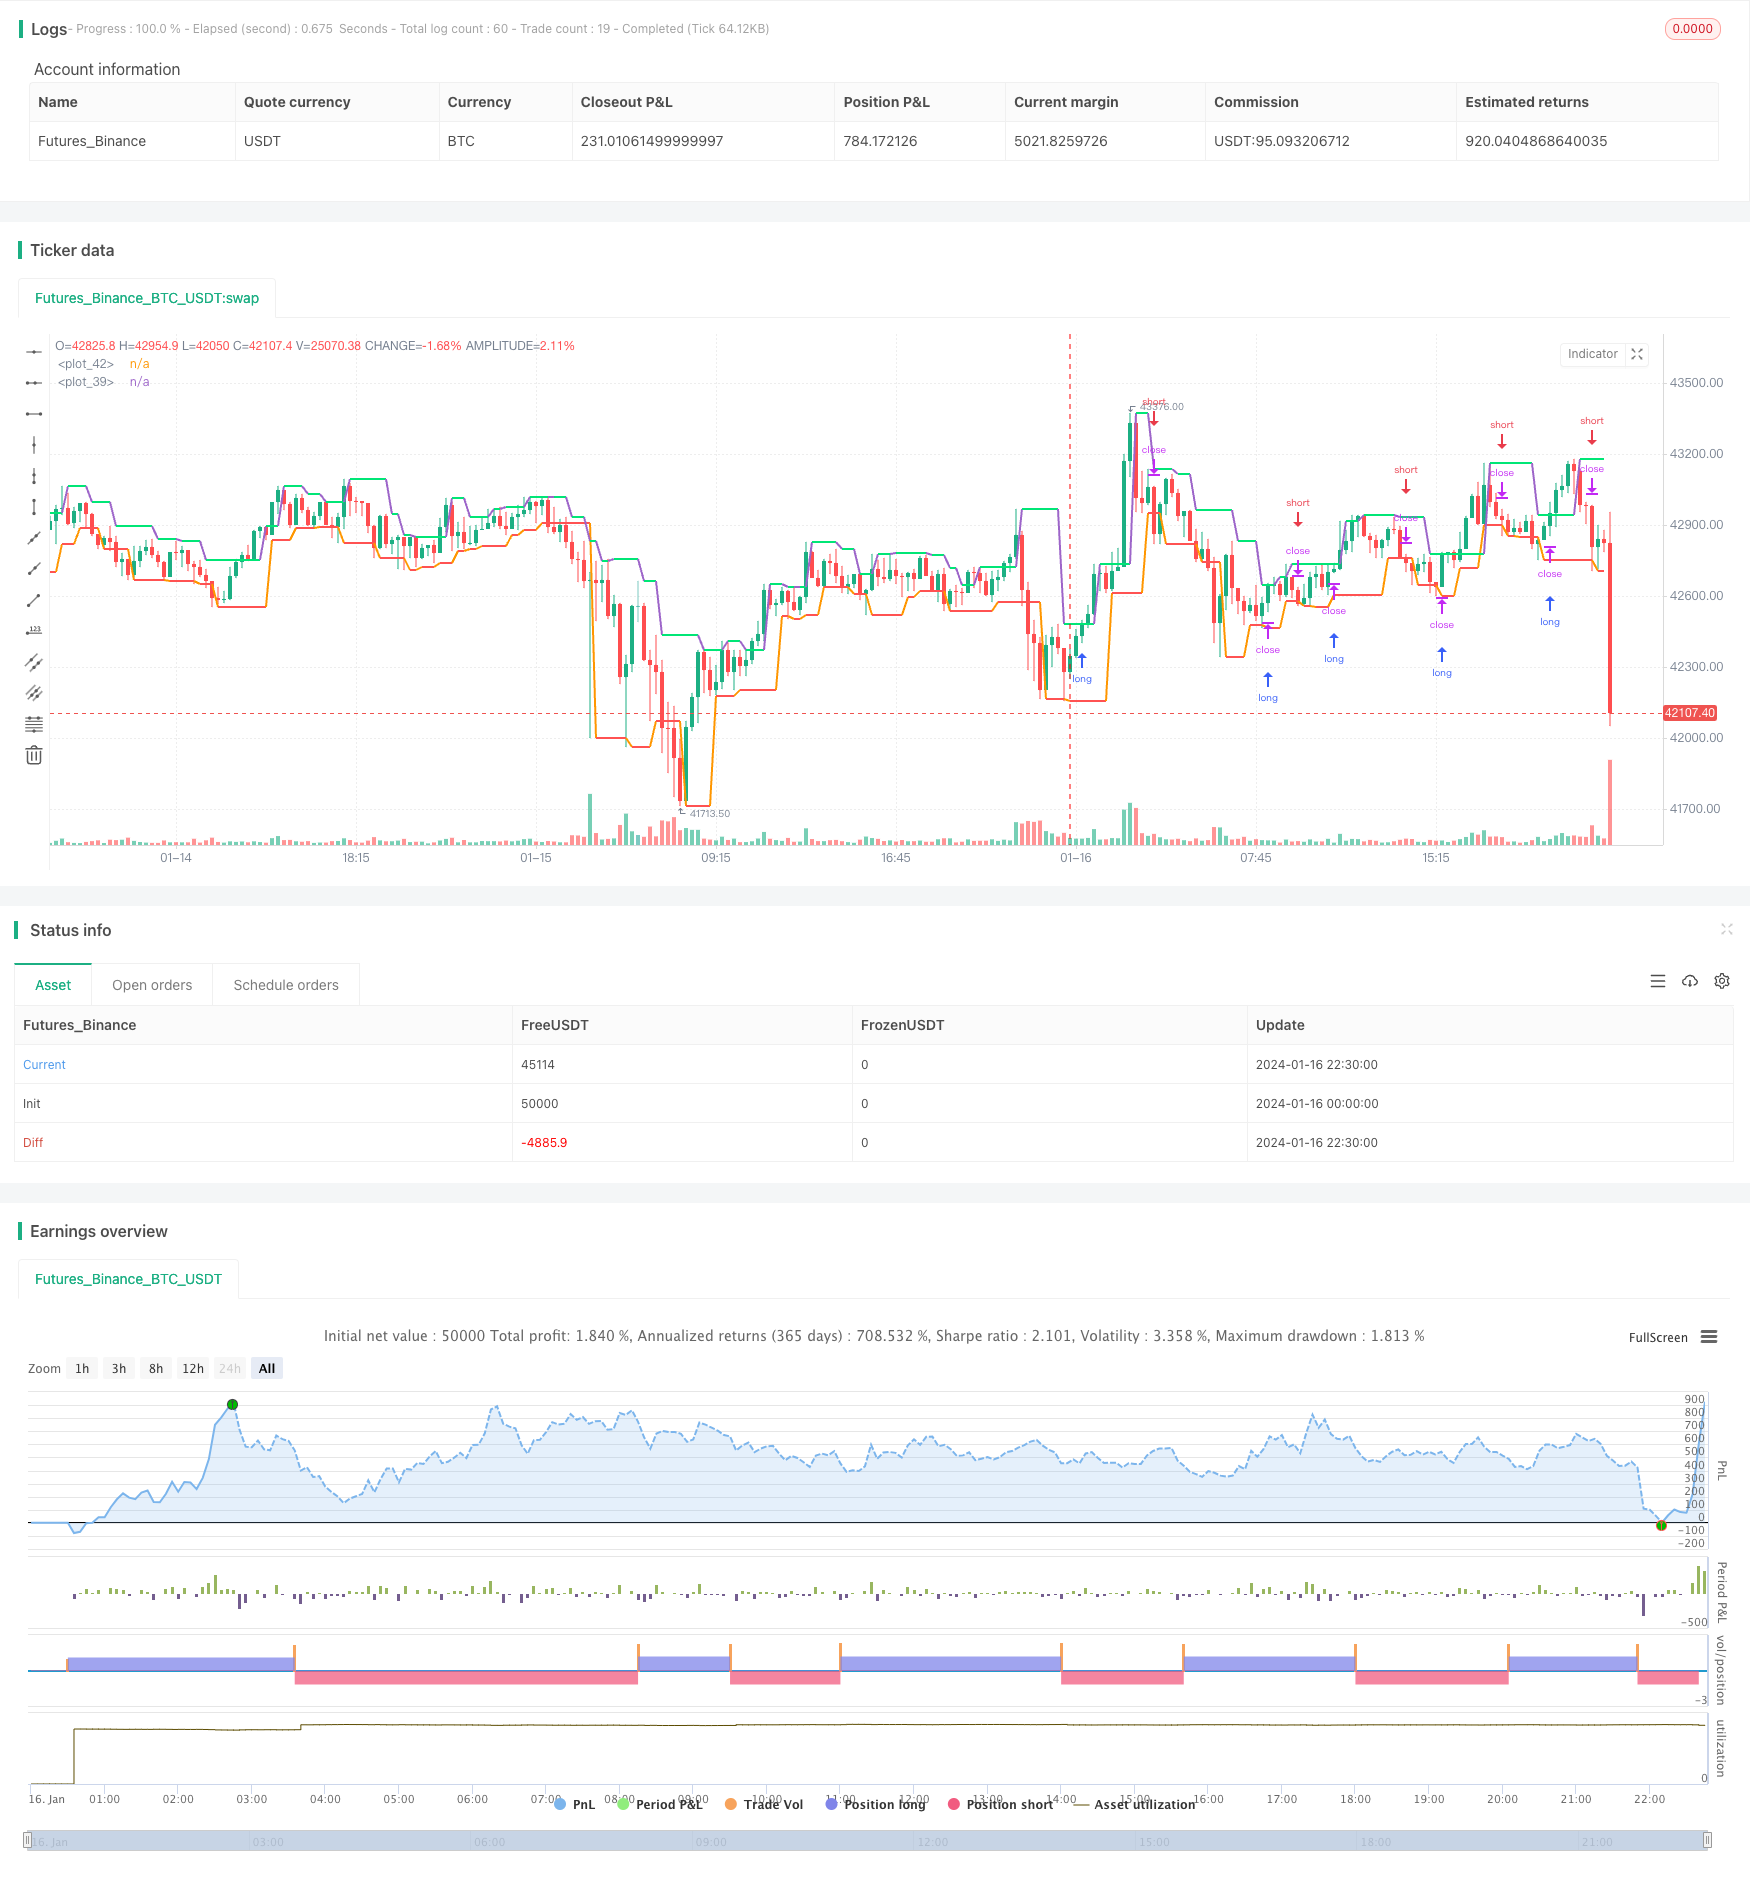
Overview
This strategy uses the changes in the highest and lowest prices of K-lines to judge the direction and intensity of market oscillation, and combines moving average to judge the overall trend to implement short-term operations. It is mainly suitable for varieties with obvious oscillations.
Strategy Principle
This strategy first judges the changes in the highest and lowest prices of K-lines relative to the previous K-line. If the highest price rises, it is recorded as 1. If the lowest price falls, it is recorded as -1, otherwise it is recorded as 0. Then calculate the mean value of changes in the highest and lowest prices within a certain cycle to judge the direction and intensity of market oscillation.
At the same time, the strategy records the highest and lowest prices in the most recent cycle. When the moving average determines a trend reversal, combined with the recorded prices to determine key price levels to form stop loss and take profit levels.
The entry direction is determined by the moving average. Go long above the upper rail and go short below the lower rail. The stop loss and take profit levels are formed by judging the key price levels.
Advantage Analysis
The biggest advantage of this strategy is to make full use of the characteristics of short-term fluctuations to make profits. By determining the stop loss and take profit based on key price levels, the strategy runs under clear rules. At the same time, it combines trend judgment to filter out unfavorable markets and avoid unnecessary losses.
Risk Analysis
The main risks this strategy faces are:
No profit if the market is not fluctuating.
Unnecessary losses caused by prices breaking through the stop loss level. The stop loss range can be appropriately expanded.
Wrong judgment of the trend may miss opportunities or make operations in the opposite direction. The moving average parameters can be adjusted accordingly.
Optimization Directions
This strategy can be optimized in the following aspects:
Adjust the moving average cycle to adapt to the characteristics of different varieties.
Optimize the stop profit and stop loss range to balance profit and loss.
Add other indicators for judgment to avoid wrong operations.
Add automatic stop loss to control maximum loss.
Summary
In general, this strategy is one that takes advantage of short-term fluctuations. It makes full use of the small price movements to make profits. At the same time, it strictly controls risks and cuts losses in a timely manner when the trend is unfavorable. It is suitable for investors who pursue stable returns with relatively prudent attitude. With appropriate parameter adjustments, it can achieve good results in fluctuating markets.
Parameters
| Name | Default | What it controls |
|---|---|---|
| v_input_1 | true | Long |
| v_input_2 | true | Short |
| v_input_3 | 100 | Capital, % |
| v_input_4 | false | Correction, % |
| v_input_5 | true | bars |
| v_input_6 | false | revers |
| v_input_7 | true | Show Levels |
| v_input_8 | false | Show Background |
| v_input_9 | false | Show Arrows |
| v_input_10 | 1900 | From Year |
| v_input_11 | 2100 | To Year |
| v_input_12 | true | From Month |
| v_input_13 | 12 | To Month |
| v_input_14 | true | From day |
| v_input_15 | 31 | To day |
Source Pine Script
/*backtest
start: 2024-01-16 00:00:00
end: 2024-01-16 22:45:00
period: 15m
basePeriod: 5m
exchanges: [{"eid":"Futures_Binance","currency":"BTC_USDT"}]
*/

//Noro
//2018

//@version=3
strategy(title = "Noro's ZZ-3 Strategy", shorttitle = "ZZ-3 str", overlay = true, default_qty_type = strategy.percent_of_equity, default_qty_value = 100, pyramiding = 0)

//Settings
needlong = input(true, defval = true, title = "Long")
needshort = input(true, defval = true, title = "Short")
capital = input(100, defval = 100, minval = 1, maxval = 10000, title = "Capital, %")
corr = input(0.0, title = "Correction, %")
bars = input(1, minval = 1)
revers = input(false, defval = false, title = "revers")
showll = input(true, defval = true, title = "Show Levels")
showbg = input(false, defval = false, title = "Show Background")
showar = input(false, defval = false, title = "Show Arrows")
fromyear = input(1900, defval = 1900, minval = 1900, maxval = 2100, title = "From Year")
toyear = input(2100, defval = 2100, minval = 1900, maxval = 2100, title = "To Year")
frommonth = input(01, defval = 01, minval = 01, maxval = 12, title = "From Month")
tomonth = input(12, defval = 12, minval = 01, maxval = 12, title = "To Month")
fromday = input(01, defval = 01, minval = 01, maxval = 31, title = "From day")
today = input(31, defval = 31, minval = 01, maxval = 31, title = "To day")

//Levels
hbar = 0
hbar := high > high[1] ? 1 : high < high[1] ? -1 : 0
lbar = 0
lbar := low > low[1] ? 1 : low < low[1] ? -1 : 0
uplevel = 0.0
dnlevel = 0.0
hh = highest(high, bars + 1)
ll = lowest(low, bars + 1)
uplevel := hbar == -1 and sma(hbar, bars)[1] == 1 ? hh + ((hh / 100) * corr) : uplevel[1]
dnlevel := lbar == 1 and sma(lbar, bars)[1] == -1 ? ll - ((ll / 100) * corr) : dnlevel[1]

//Lines
upcol = na
upcol := showll == false ? na : uplevel != uplevel[1] ? na : lime
plot(uplevel, color = upcol, linewidth = 2)
dncol = na
dncol := showll == false ? na : dnlevel != dnlevel[1] ? na : red
plot(dnlevel, color = dncol, linewidth = 2)

//Background
size = strategy.position_size
trend = 0
trend := size > 0 ? 1 : size < 0 ? -1 : high >= uplevel ? 1 : low <= dnlevel ? -1 : trend[1]
col = showbg == false ? na : trend == 1 ? lime : trend == -1 ? red : na
bgcolor(col)

//Arrows
longsignal = false
shortsignal = false
longsignal := size > size[1]
shortsignal := size < size[1]
plotarrow(longsignal and showar and needlong ? 1 : na, colorup = blue, colordown = blue, transp = 0)
plotarrow(shortsignal and showar and needshort ? -1 : na, colorup = blue, colordown = blue, transp = 0)

//Trading
lot = 0.0
lot := size != size[1] ? strategy.equity / close * capital / 100 : lot[1]
if uplevel > 0 and dnlevel > 0 and revers == false
    strategy.entry("Long", strategy.long, needlong == false ? 0 : lot, stop = uplevel, when=(time > timestamp(fromyear, frommonth, fromday, 00, 00) and time < timestamp(toyear, tomonth, today, 23, 59)))
    strategy.entry("Short", strategy.short, needshort == false ? 0 : lot, stop = dnlevel, when=(time > timestamp(fromyear, frommonth, fromday, 00, 00) and time < timestamp(toyear, tomonth, today, 23, 59)))
if uplevel > 0 and dnlevel > 0 and revers == true
    strategy.entry("Long", strategy.long, needlong == false ? 0 : lot, limit = dnlevel, when=(time > timestamp(fromyear, frommonth, fromday, 00, 00) and time < timestamp(toyear, tomonth, today, 23, 59)))
    strategy.entry("Short", strategy.short, needshort == false ? 0 : lot, limit = uplevel, when=(time > timestamp(fromyear, frommonth, fromday, 00, 00) and time < timestamp(toyear, tomonth, today, 23, 59)))
if time > timestamp(toyear, tomonth, today, 23, 59)
strategy.close_all()Published by ChaoZhang on the FMZ strategy square · last modified 2024-01-18. Collected in the Quant Trading Vault. Unvalidated research: re-test with your own data and costs before trusting it.
Build this with AgenKit
A spec is not a trading system. Paste this into your coding agent and AgenKit runs a specialist team — architecture, test-first build, risk gates, review — with paper trading on by default.
/agenkit build a production-grade trading bot with a backtest engine, risk controls and paper trading by default from strategies/Oscillation-Tracking-Short-term-Strategy.md- npx agenkit install engineering-kit in your project
- Paste the command into your agent and approve each phase
- Get tests, backtest, risk controls and a paper-trading switch
Understand it first
Before you run this, read the lesson behind the idea and how to backtest it honestly. Specs like this one are the survivors of an unknown number of trials; deflate their results accordingly.
Related specs
- 3 10 Oscillator Profile Flagging StrategyPine Script · Mean reversion · 1d
- A Trend Reversal Strategy Based on Moving Averages Price Patterns and VolumePine Script · Mean reversion · 1d
- Adaptive Mean Reversion Trading Strategy Based on Chande Momentum OscillatorPine Script · Mean reversion · 1d
- Adaptive Trading Strategy Combining Dynamic Trend Reversal and Stochastic IndicatorPine Script · Mean reversion · 1d
- Advanced 15 Minute Chart Trading Signal StrategyPine Script · Mean reversion · 3h
- Advanced Momentum EMA Trend Following with RSI Overbought Oversold Trading StrategyPine Script · Mean reversion · 1d