Strategy vault / Mean reversion
Oscillator Differential Moving Average Timing Strategy
This strategy calculates the difference between the fast EMA and slow EMA to form the MACD oscillator, and calculates the EMA of MACD itself to form the signal line, thereby constructing a dual filtering system. It…
Overview
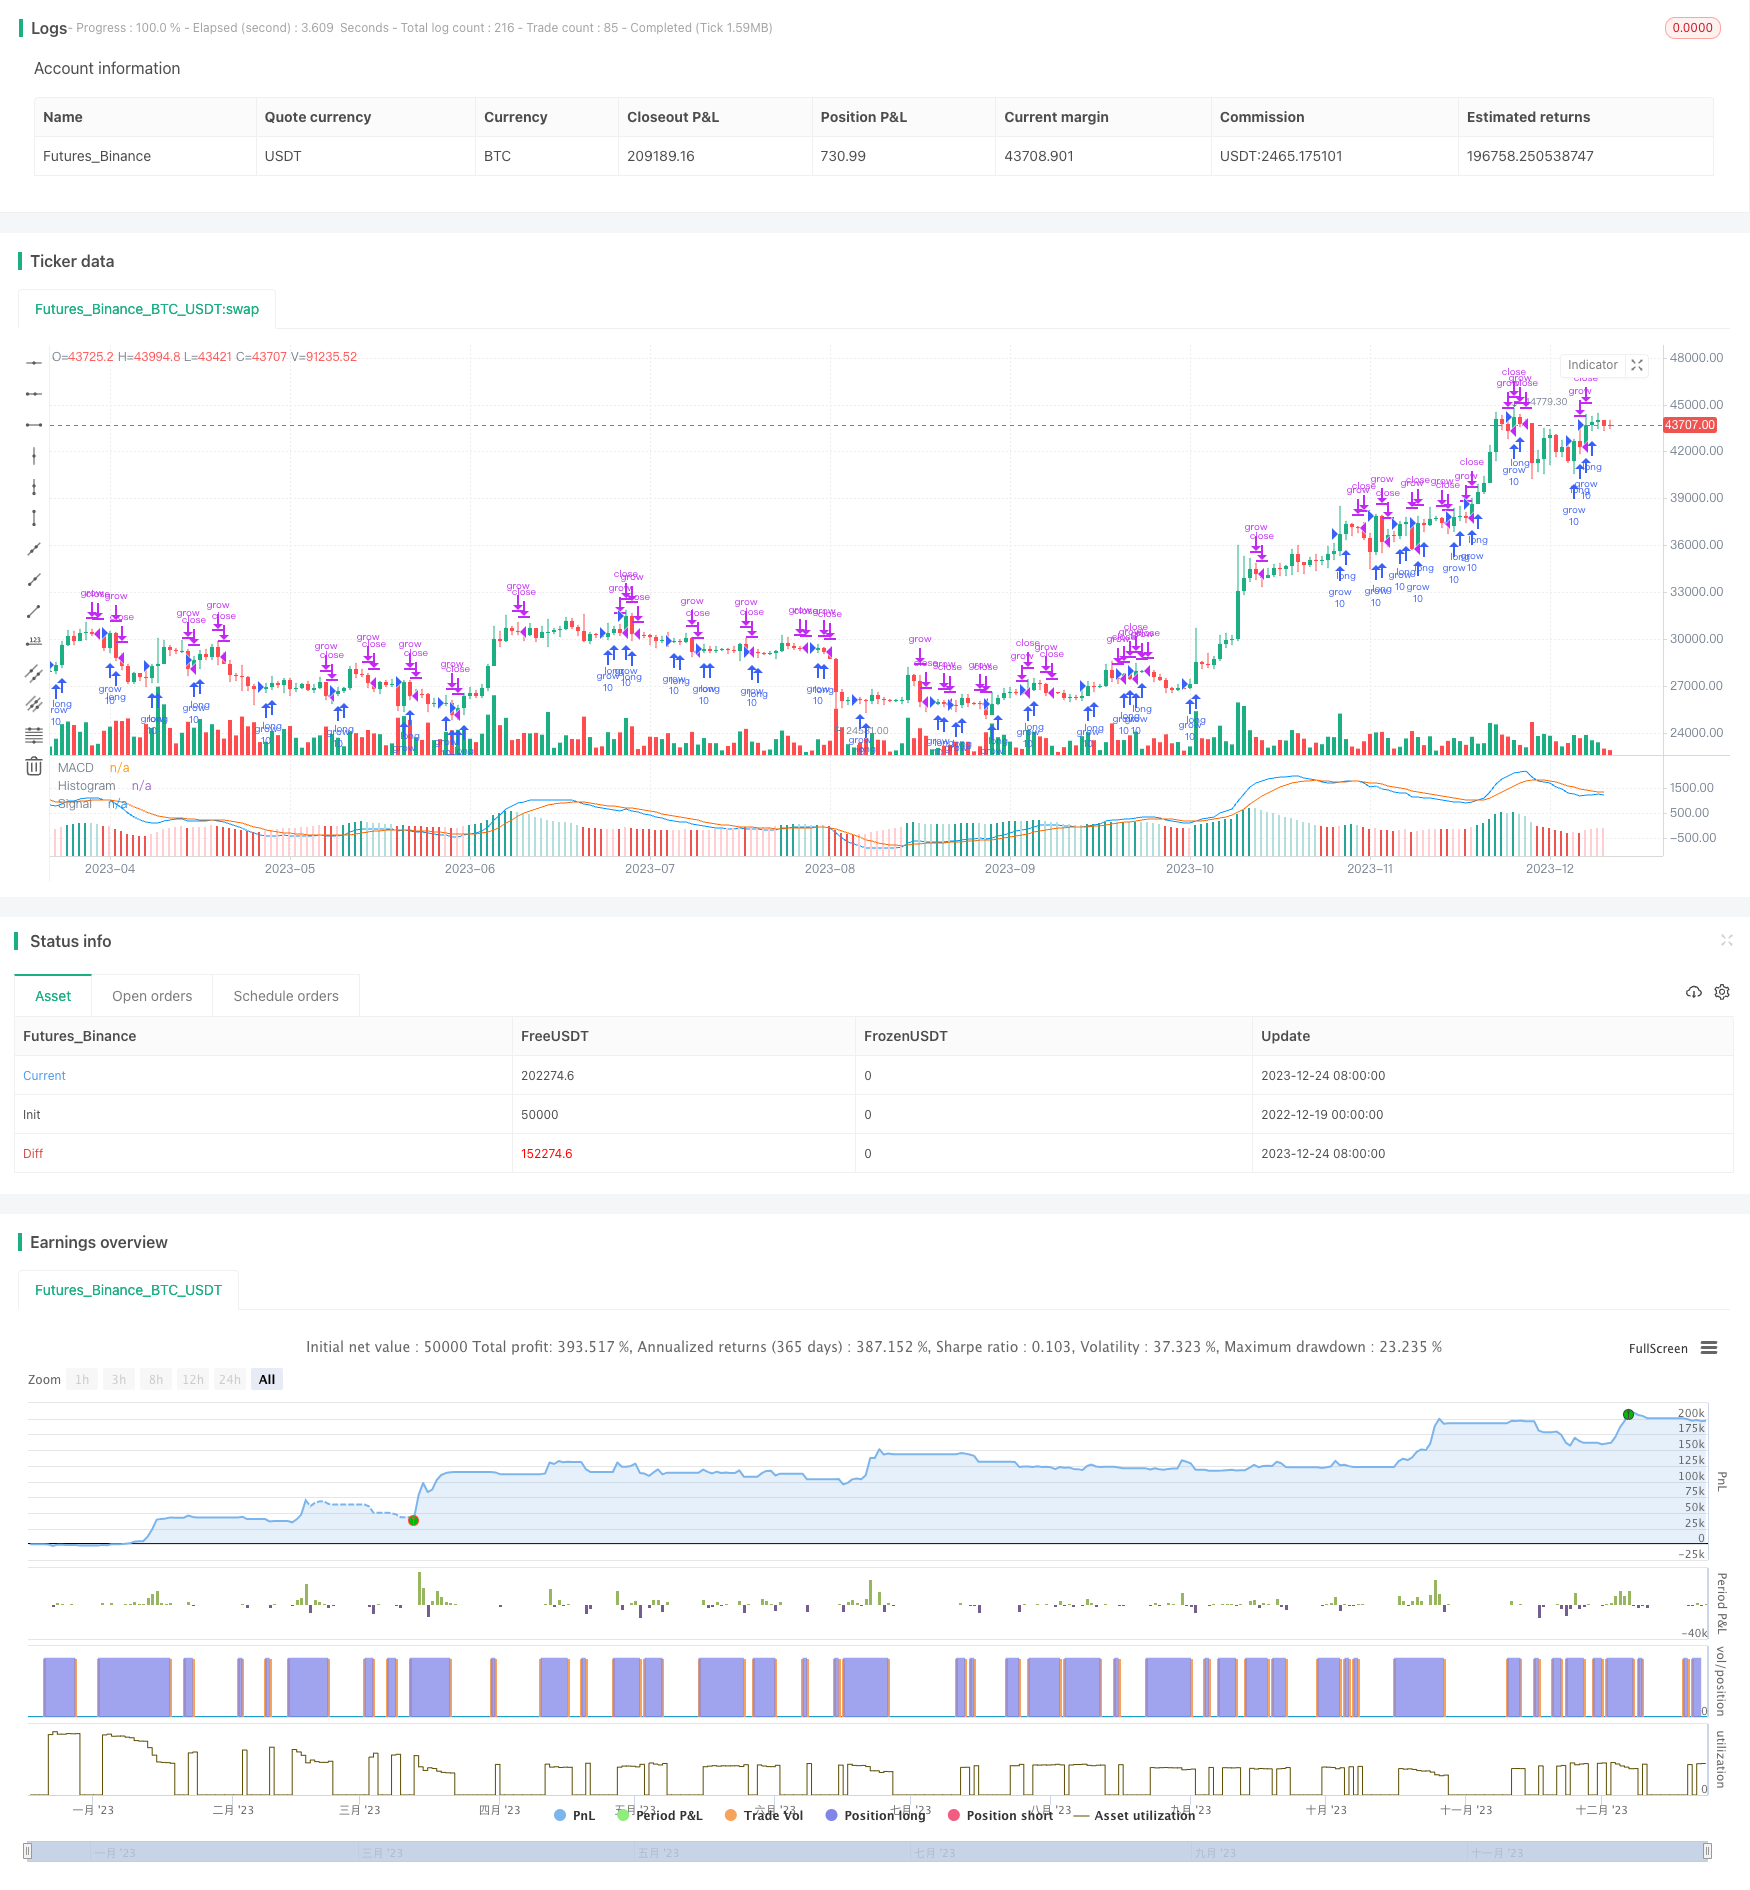
This strategy calculates the difference between the fast EMA and slow EMA to form the MACD oscillator, and calculates the EMA of MACD itself to form the signal line, thereby constructing a dual filtering system. It generates buy signals when the MACD line crosses above the signal line from below, and sell signals when the MACD line crosses below the signal line from above, profiting from short-term and medium-term price fluctuations.
Strategy Principle
The core indicator of this strategy is the MACD oscillator, which is calculated by subtracting the slow EMA (typically 26-day EMA) from the fast EMA (typically 12-day EMA). The fast EMA is more sensitive and can capture short-term price fluctuations. The slow EMA responds to price changes more slowly. Subtracting the two forms an oscillator that represents the difference between short-term and medium-term price cycles. The EMA (typically 9-day) of the MACD oscillator itself is then calculated to obtain the signal line. When the MACD crosses above the signal line from below, it signals that the upward momentum of the short-term trend is stronger than that of the medium-term trend, generating a buy signal. When the MACD crosses below the signal line from above, it signals that the downward momentum of the short-term trend is stronger, generating a sell signal.
The input parameters of this strategy are set to the fast line length, slow line length, price source, and signal line smoothing period, respectively. These can be adjusted according to different markets to find the optimal parameter combinations. The background color block shows the backtest timeframe. The strategy opens positions only within this timeframe.
Advantage Analysis
The MACD indicator is classic and easy to understand, effectively capturing short-to-medium-term reversal opportunities.
The dual EMA construction of the MACD system has better smoothness than single MA systems.
Relatively more adjustable parameters allow optimization across different markets.
Combining with volume indicators helps identify high quality signals.
Risk Analysis
MACD can produce more false signals in oscillating markets.
It cannot determine trends and may produce losses when crossing trends.
The limited backtest timeframe may ignore extreme market conditions.
Parameter tuning needs more market data to avoid overfitting specific market periods.
Risks can be controlled by incorporating trend indicators and stop loss mechanisms. The backtest scope and market sample space can be expanded for parameter optimization.
Optimization Directions
Test different price sources like close, median, reset prices etc.
Search for optimal parameter sets based on more historical data.
Integrate other indicators to judge signal quality, e.g. volume signals.
Incorporate trend and cycle analysis to avoid significant trend conflicts.
Conclusion
This strategy captures short-to-medium-term reversal opportunities by constructing a dual EMA filter system. It belongs to a classic and practical market timing strategy. Risks can be controlled via parameter optimization, signal filtering and stop loss means. Incorporating trend analysis tools to avoid buying peaks and selling bottoms can lead to steady profits.
Parameters
| Name | Default | What it controls |
|---|---|---|
| v_input_1 | 12 | Fast Length |
| v_input_2 | 26 | Slow Length |
| v_input_3_close | 0 | Source: close | high | low | open | hl2 | hlc3 | hlcc4 | ohlc4 |
| v_input_4 | 9 | Signal Smoothing |
| v_input_5 | false | Simple MA(Oscillator) |
| v_input_6 | false | Simple MA(Signal Line) |
| v_input_7 | 2017 | Backtest Start Year |
| v_input_8 | true | Backtest Start Month |
| v_input_9 | 2 | Backtest Start Day |
| v_input_10 | 2019 | Backtest Stop Year |
| v_input_11 | 12 | Backtest Stop Month |
| v_input_12 | 30 | Backtest Stop Day |
| v_input_13 | true | Color Background? |
Source Pine Script
/*backtest
start: 2022-12-19 00:00:00
end: 2023-12-25 00:00:00
period: 1d
basePeriod: 1h
exchanges: [{"eid":"Futures_Binance","currency":"BTC_USDT"}]
*/

//@version=4
strategy(title="MACD Histogram Backtest", shorttitle="MACD")

// Getting inputs
fast_length = input(title="Fast Length", type=input.integer, defval=12)
slow_length = input(title="Slow Length", type=input.integer, defval=26)
src = input(title="Source", type=input.source, defval=close)
signal_length = input(title="Signal Smoothing", type=input.integer, minval = 1, maxval = 50, defval = 9)
sma_source = input(title="Simple MA(Oscillator)", type=input.bool, defval=false)
sma_signal = input(title="Simple MA(Signal Line)", type=input.bool, defval=false)

// Plot colors
col_grow_above = #26A69A
col_grow_below = #FFCDD2
col_fall_above = #B2DFDB
col_fall_below = #EF5350
col_macd = #0094ff
col_signal = #ff6a00

// Calculating
fast_ma = sma_source ? sma(src, fast_length) : ema(src, fast_length)
slow_ma = sma_source ? sma(src, slow_length) : ema(src, slow_length)
macd = fast_ma - slow_ma
signal = sma_signal ? sma(macd, signal_length) : ema(macd, signal_length)
hist = macd - signal

grow = (hist[1] < hist)
fall = (hist[1] > hist) and hist >= 0
stop = (hist[1] > hist)

plot(hist, title="Histogram", style=plot.style_columns, color=(hist>=0 ? (hist[1] < hist ? col_grow_above : col_fall_above) : (hist[1] < hist ? col_grow_below : col_fall_below) ), transp=0 )
plot(macd, title="MACD", color=col_macd, transp=0)
plot(signal, title="Signal", color=col_signal, transp=0)

//Strategy Testing

// Component Code Start
// Example usage:
// if testPeriod()
//   strategy.entry("LE", strategy.long)
testStartYear = input(2017, "Backtest Start Year")
testStartMonth = input(01, "Backtest Start Month")
testStartDay = input(2, "Backtest Start Day")
testPeriodStart = timestamp(testStartYear,testStartMonth,testStartDay,0,0)

testStopYear = input(2019, "Backtest Stop Year")
testStopMonth = input(12, "Backtest Stop Month")
testStopDay = input(30, "Backtest Stop Day")
testPeriodStop = timestamp(testStopYear,testStopMonth,testStopDay,0,0)

// A switch to control background coloring of the test period
testPeriodBackground = input(title="Color Background?", type=input.bool, defval=true)
testPeriodBackgroundColor = testPeriodBackground and (time >= testPeriodStart) and (time <= testPeriodStop) ? #00FF00 : na
bgcolor(testPeriodBackgroundColor, transp=97)

testPeriod() => true
// Component Code Stop

//Entry and Close settings
if testPeriod()
    strategy.entry("grow", true, 10, when = grow, limit = close)
    strategy.close("grow", when = fall)
    strategy.close("grow", when = stop)

//if testPeriod()
//   strategy.entry("fall", false, 1000, when = fall, limit = close)
//    strategy.close("fall", when = grow)
Published by ChaoZhang on the FMZ strategy square · last modified 2023-12-26. Collected in the Quant Trading Vault. Unvalidated research: re-test with your own data and costs before trusting it.
Build this with AgenKit
A spec is not a trading system. Paste this into your coding agent and AgenKit runs a specialist team — architecture, test-first build, risk gates, review — with paper trading on by default.
/agenkit build a production-grade trading bot with a backtest engine, risk controls and paper trading by default from strategies/Oscillator-Differential-Moving-Average-Timing-Strategy.md- npx agenkit install engineering-kit in your project
- Paste the command into your agent and approve each phase
- Get tests, backtest, risk controls and a paper-trading switch
Understand it first
Before you run this, read the lesson behind the idea and how to backtest it honestly. Specs like this one are the survivors of an unknown number of trials; deflate their results accordingly.
Related specs
- Advanced 15 Minute Chart Trading Signal StrategyPine Script · Mean reversion · 3h
- BONK Multi Factor Trading StrategyPine Script · Mean reversion · 1d
- Customizable Non Repainting HTF MACD MFI Scalable Bot StrategyPine Script · Mean reversion · 1d
- Dynamic Adaptive Multi Timeframe Trend Following and Range Reversal Hybrid StrategyPine Script · Mean reversion · 2d
- MACD Cross Period Trading StrategyPine Script · Mean reversion · 1d
- MACD Double Optimization Trading StrategyPine Script · Mean reversion · 1d