Strategy vault / Machine learning
Out of the box Machine Learning Trading Strategy
This strategy utilizes machine learning methods to implement an out-of-the-box automated trading strategy. It integrates multiple indicators and models to automatically generate trading signals and make buy and sell…
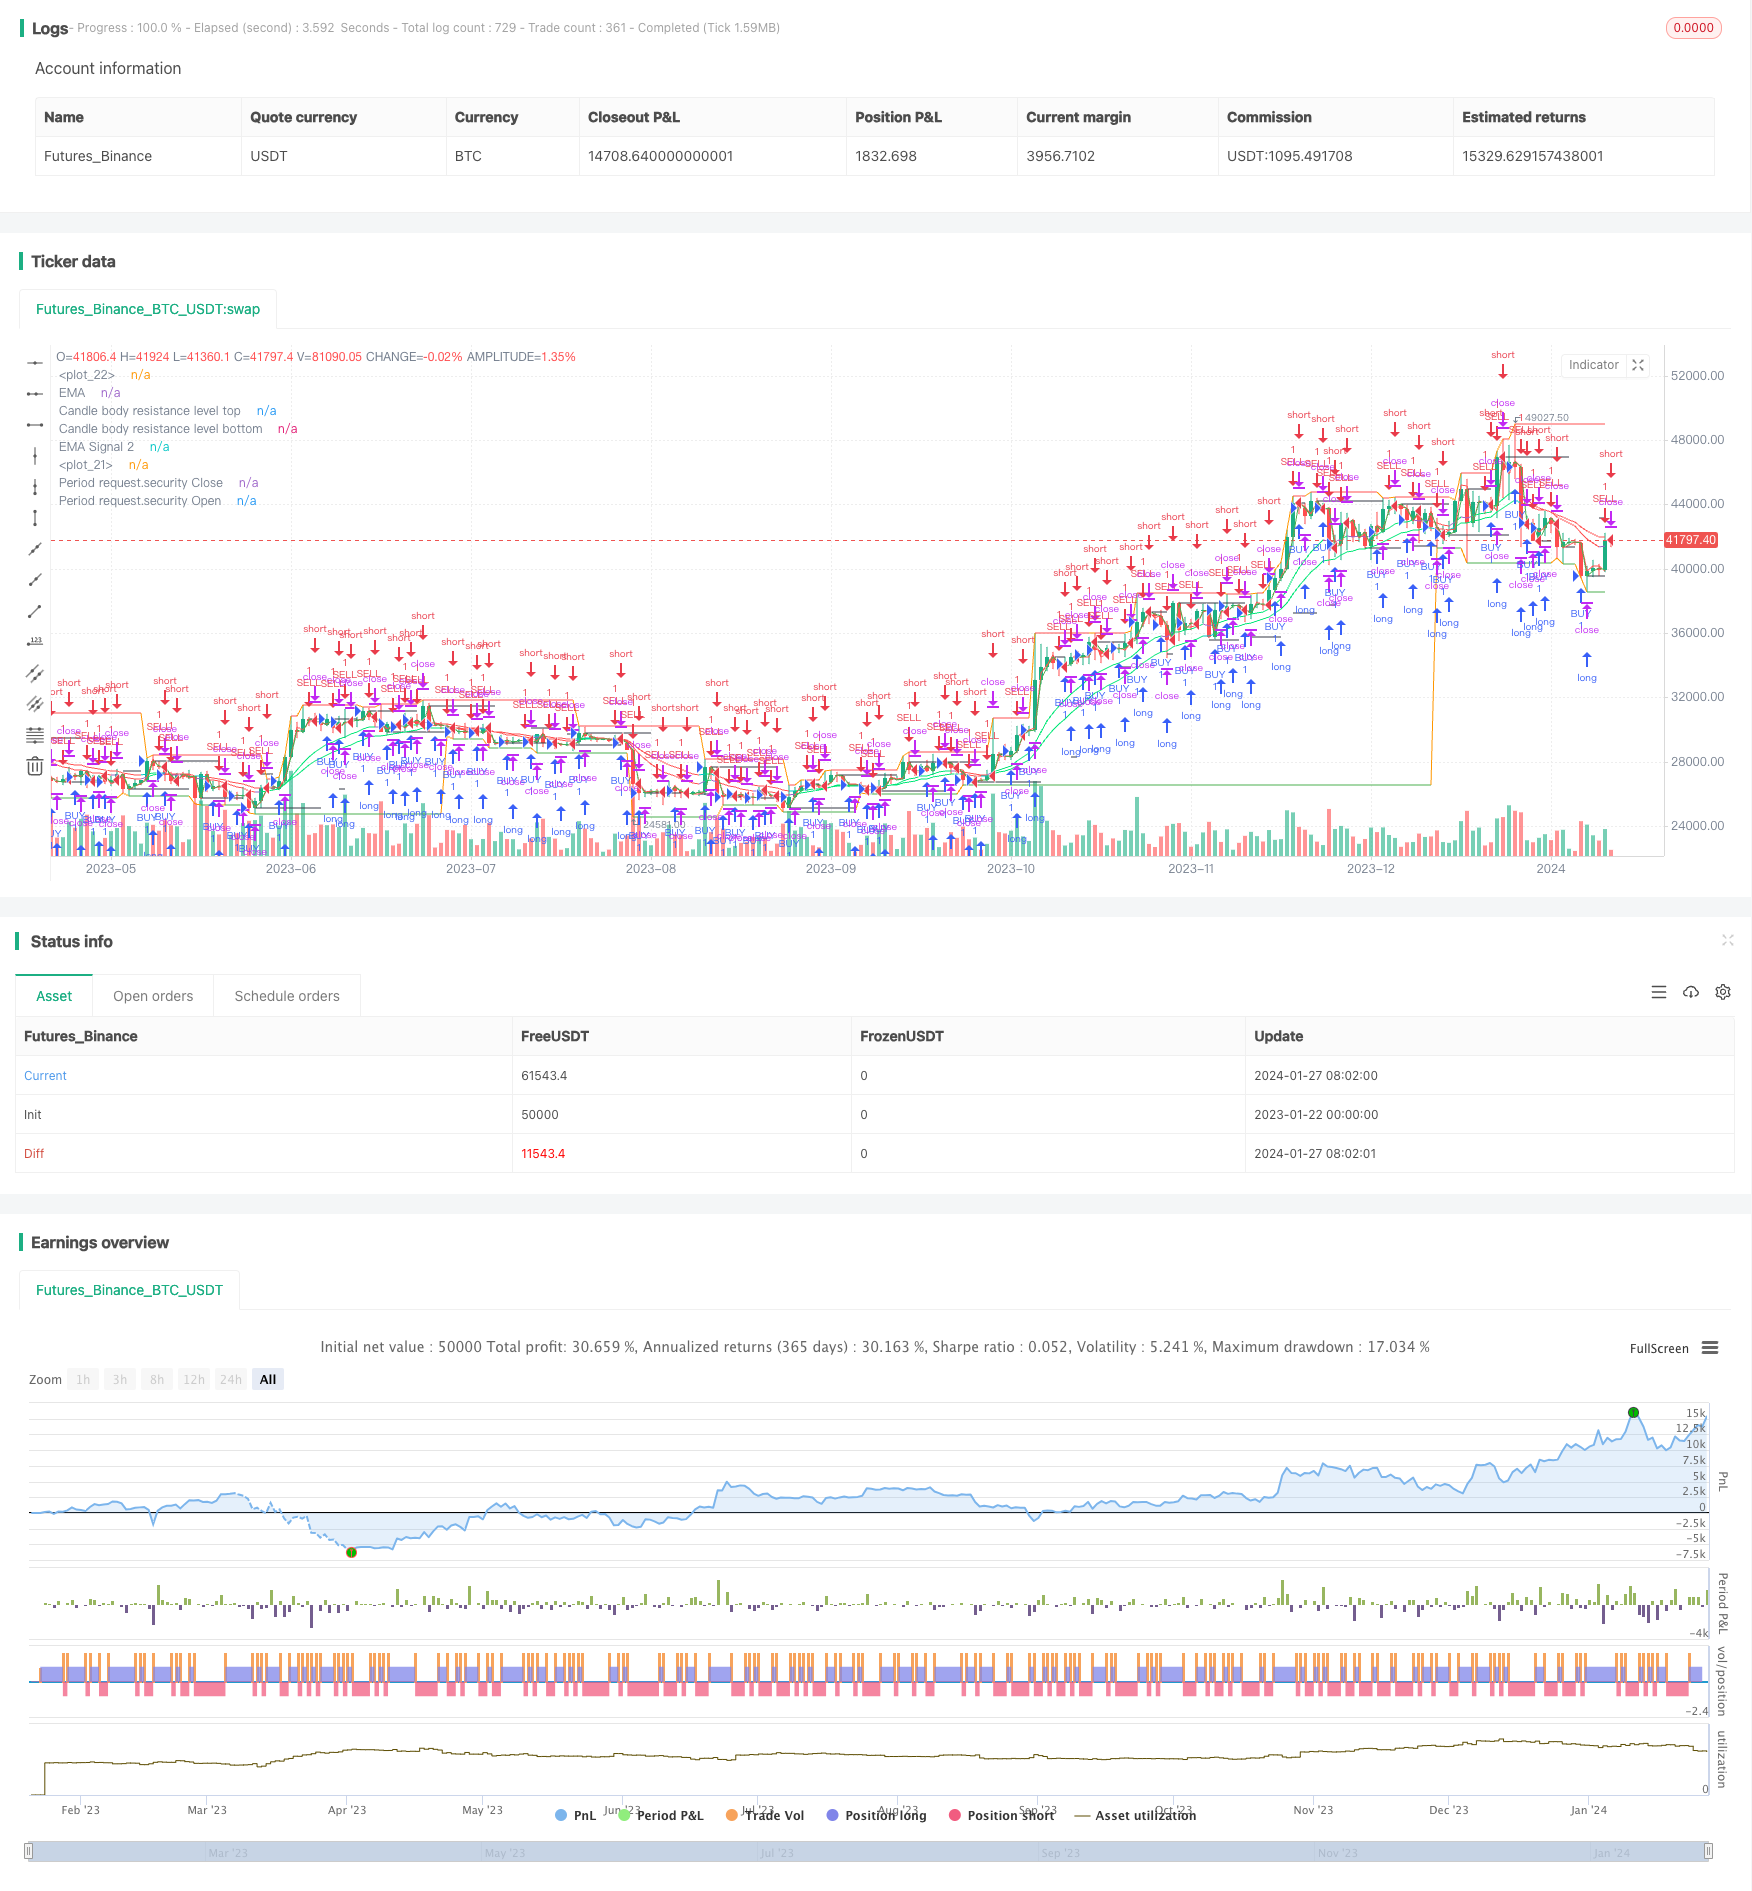
Overview
This strategy utilizes machine learning methods to implement an out-of-the-box automated trading strategy. It integrates multiple indicators and models to automatically generate trading signals and make buy and sell decisions accordingly.
Strategy Principle
This strategy is mainly based on the following key points:
- Use Hull Moving Average to determine market trend direction
- Use EMA to judge short-term and medium-term trends
- Use candle body channel to locate key SUPPORT/RESISTANCE levels
- Make decisions based on crossover between open and close prices from multi-timeframe SECURITY
Specifically, the strategy will plot the Hull MA, 13-period EMA, and 21-period EMA. Judging short-term and medium-term trend directions based on the long and short status of EMAs. Combined with Hull MA to determine longer cycle trends. This provides guidance on the general direction for subsequent trading signals.
Before adjusting positions, the strategy will refer to the highest and lowest prices in the entity channel corresponding to support and resistance levels. This avoids generating trading signals in key price areas.
Finally, the strategy invokes the 60-period open and close prices. When the close price crosses above the open price, a buy signal is generated. When it crosses below, a sell signal is generated. This completes the entire trading logic.
Advantage Analysis
The biggest advantage of this strategy is that it combines machine learning and technical analysis indicators to achieve a logical, adjustable and easy-to-use automated trading solution.
Multi-indicator combo improves signal accuracy
The strategy does not rely solely on one or two indicators, but takes into account multiple factors such as trends, support/resistance, and price breakthroughs. This greatly improves the reliability and accuracy of the signals.
Flexible parameter settings
The lengths of Hull MA, EMA periods, open/close crossover periods can be adjusted through parameters, making the strategy adaptable to different market environments.
Automated trading signals
The trading signals based on indicators and crossovers can automatically trigger buys and sells without manual judgment, reducing difficulty.
Visualized display
The charts in the strategy can clearly show market structure, trend status and key prices, intuitively displaying the basis for strategy judgment.
Risk Analysis
Although this strategy has been optimized in multiple aspects, there are still some potential risks:
Failure to track drastic price movements
In volatile markets, indicators may become ineffective or delayed, causing the strategy to fail to track price changes in time. Parameters need to be optimized to adapt to such markets.
Existence of signal error rate
Trading signals based on indicators and models, more or less, will have some false signals or missing signals. This needs to be improved by combining more auxiliary signals.
Long/Short mix risk
The strategy making both long and short positions simultaneously has the risk of losses on both sides if judgments went wrong. Strict stop loss or lower position sizing is required to control for this.
Overfit risk
Overly complex parameter settings run the risk of overfitting. The system needs to be simplified with constrained number of parameter combinations.
Optimization Directions
There is still some room for optimizing this strategy, mainly in the following aspects:
Add more indicator signals
In addition to existing indicators, more auxiliary indicators can be introduced, such as BOLL channels, KD indicators, etc, to enrich system reference.
Apply deep learning models
Use simple indicators as features to train LSTM and other deep learning models to improve signal quality.
Incorporate fundamental data
Add macroeconomic data, policy information and other fundamental factors to optimize long-cycle decisions.
Risk & position sizing
Introduce stop loss strategies, dynamically adjust position sizing based on strategy return volatility to strictly control risks.
Conclusion
This strategy integrates trends, support/resistance levels, breakouts and multiple other indicators, utilizing machine learning methods to achieve automated, ready-to-use quantitative trading solutions. It has the advantages of diverse indicator combos, tunable parameters and automated signals, while also facing tracking deviations, signal errors, long/short mix risks to some extent. There are still directions for further optimizations by incorporating more auxiliary indicators and models, combining fundamental factors, dynamically adjusting positions and so on, in order to achieve more stable, accurate and intelligent quantitative trading performance.
Parameters
| Name | Default | What it controls |
|---|---|---|
| v_input_1_close | 0 | Candle body resistance channel: close | high | low | open | hl2 | hlc3 | hlcc4 | ohlc4 |
| v_input_2 | false | Bar Channel On/Off |
| v_input_3 | 10 | Support / Resistance length: |
| v_input_4 | 13 | EMA 1 |
| v_input_5 | 21 | EMA 2 |
| v_input_6 | false | Display Hull MA Set: |
| v_input_7_close | 0 | Hull MA's Source:: close | high | low | open | hl2 | hlc3 | hlcc4 | ohlc4 |
| v_input_8 | 8 | Hull MA's Base Length: |
| v_input_9 | 5 | Hull MA's Length Scalar: |
| v_input_10 | 60 | Period |
Source Pine Script
/*backtest
start: 2023-01-22 00:00:00
end: 2024-01-28 00:00:00
period: 1d
basePeriod: 1h
exchanges: [{"eid":"Futures_Binance","currency":"BTC_USDT"}]
*/

//@version=4
strategy(title='Ali Jitu Abus', shorttitle='Ali_Jitu_Abis_Strategy', overlay=true, pyramiding=0, initial_capital=1000, currency=currency.USD)

//Candle body resistance Channel-----------------------------//
len = 34
src = input(close, title="Candle body resistance channel")
out = sma(src, len)
last8h = highest(close, 13)
lastl8 = lowest(close, 13)
bearish = cross(close,out) == 1 and falling(close, 1)
bullish = cross(close,out) == 1 and rising(close, 1)
channel2=input(false, title="Bar Channel On/Off")
ul2=plot(channel2?last8h:last8h==nz(last8h[1])?last8h:na, color=black, linewidth=1, style=linebr, title="Candle body resistance level top", offset=0)
ll2=plot(channel2?lastl8:lastl8==nz(lastl8[1])?lastl8:na, color=black, linewidth=1, style=linebr, title="Candle body resistance level bottom", offset=0)
//fill(ul2, ll2, color=black, transp=95, title="Candle body resistance Channel")

//-----------------Support and Resistance
RST = input(title='Support / Resistance length:',  defval=10)
RSTT = valuewhen(high >= highest(high, RST), high, 0)
RSTB = valuewhen(low <= lowest(low, RST), low, 0)
RT2 = plot(RSTT, color=RSTT != RSTT[1] ? na : red, linewidth=1, offset=+0)
RB2 = plot(RSTB, color=RSTB != RSTB[1] ? na : green, linewidth=1, offset=0)

//--------------------Trend colour ema------------------------------------------------//
src0 = close, len0 = input(13, minval=1, title="EMA 1")
ema0 = ema(src0, len0)
direction = rising(ema0, 2) ? +1 : falling(ema0, 2) ? -1 : 0
plot_color = direction > 0  ? lime: direction < 0 ? red : na
plot(ema0, title="EMA", style=line, linewidth=1, color = plot_color)

//-------------------- ema 2------------------------------------------------//
src02 = close, len02 = input(21, minval=1, title="EMA 2")
ema02 = ema(src02, len02)
direction2 = rising(ema02, 2) ? +1 : falling(ema02, 2) ? -1 : 0
plot_color2 = direction2 > 0  ? lime: direction2 < 0 ? red : na
plot(ema02, title="EMA Signal 2", style=line, linewidth=1, color = plot_color2)

//=============Hull MA//
show_hma = input(false, title="Display Hull MA Set:")
hma_src = input(close, title="Hull MA's Source:")
hma_base_length = input(8, minval=1, title="Hull MA's Base Length:")
hma_length_scalar = input(5, minval=0, title="Hull MA's Length Scalar:")
hullma(src, length)=>wma(2*wma(src, length/2)-wma(src, length), round(sqrt(length)))
plot(not show_hma ? na : hullma(hma_src, hma_base_length+hma_length_scalar*6), color=black, linewidth=2, title="Hull MA")

//============ signal Generator ==================================//
Period=input('60')
ch1 = request.security(syminfo.tickerid, Period, open)
ch2 = request.security(syminfo.tickerid, Period, close)
longCondition = crossover(request.security(syminfo.tickerid, Period, close),request.security(syminfo.tickerid, Period, open))
if (longCondition)
    strategy.entry("BUY", strategy.long)
shortCondition = crossunder(request.security(syminfo.tickerid, Period, close),request.security(syminfo.tickerid, Period, open))
if (shortCondition)
    strategy.entry("SELL", strategy.short)

plot(request.security(syminfo.tickerid, Period, close), color=red, title="Period request.security Close")
plot(request.security(syminfo.tickerid, Period, open), color=green, title="Period request.security Open")

///////////////////////////////////////////////////////////////////////////////////////////Published by ChaoZhang on the FMZ strategy square · last modified 2024-01-29. Collected in the Quant Trading Vault. Unvalidated research: re-test with your own data and costs before trusting it.
Build this with AgenKit
A spec is not a trading system. Paste this into your coding agent and AgenKit runs a specialist team — architecture, test-first build, risk gates, review — with paper trading on by default.
/agenkit build a production-grade trading bot with a backtest engine, risk controls and paper trading by default from strategies/Out-of-the-box-Machine-Learning-Trading-Strategy.md- npx agenkit install engineering-kit in your project
- Paste the command into your agent and approve each phase
- Get tests, backtest, risk controls and a paper-trading switch
Understand it first
Before you run this, read the lesson behind the idea and how to backtest it honestly. Specs like this one are the survivors of an unknown number of trials; deflate their results accordingly.
Related specs
- Hilo Activator Buy Sell Signals StrategyPine Script · Machine learning · 10m
- Multi Indicator Decision Tree Strategy IMACD EMA and IchimokuPine Script · Machine learning · 30m
- Multi indicator Assisted StrategyPine Script · Machine learning · 1d
- Moving Average Rebound StrategyPine Script · Machine learning · 1d
- Quantitative Trading Strategy Based on SMA and EMAPine Script · Machine learning · 3m
- Dynamic Regression Channel StrategyPine Script · Machine learning · 2h