Strategy vault / Mean reversion
Parabolic SAR Momentum Reversal Strategy
This strategy utilizes the crossover operation between the Parabolic SAR sliding value and candlestick to achieve momentum tracking and stop loss for swing trading. The strategy will establish long and short…
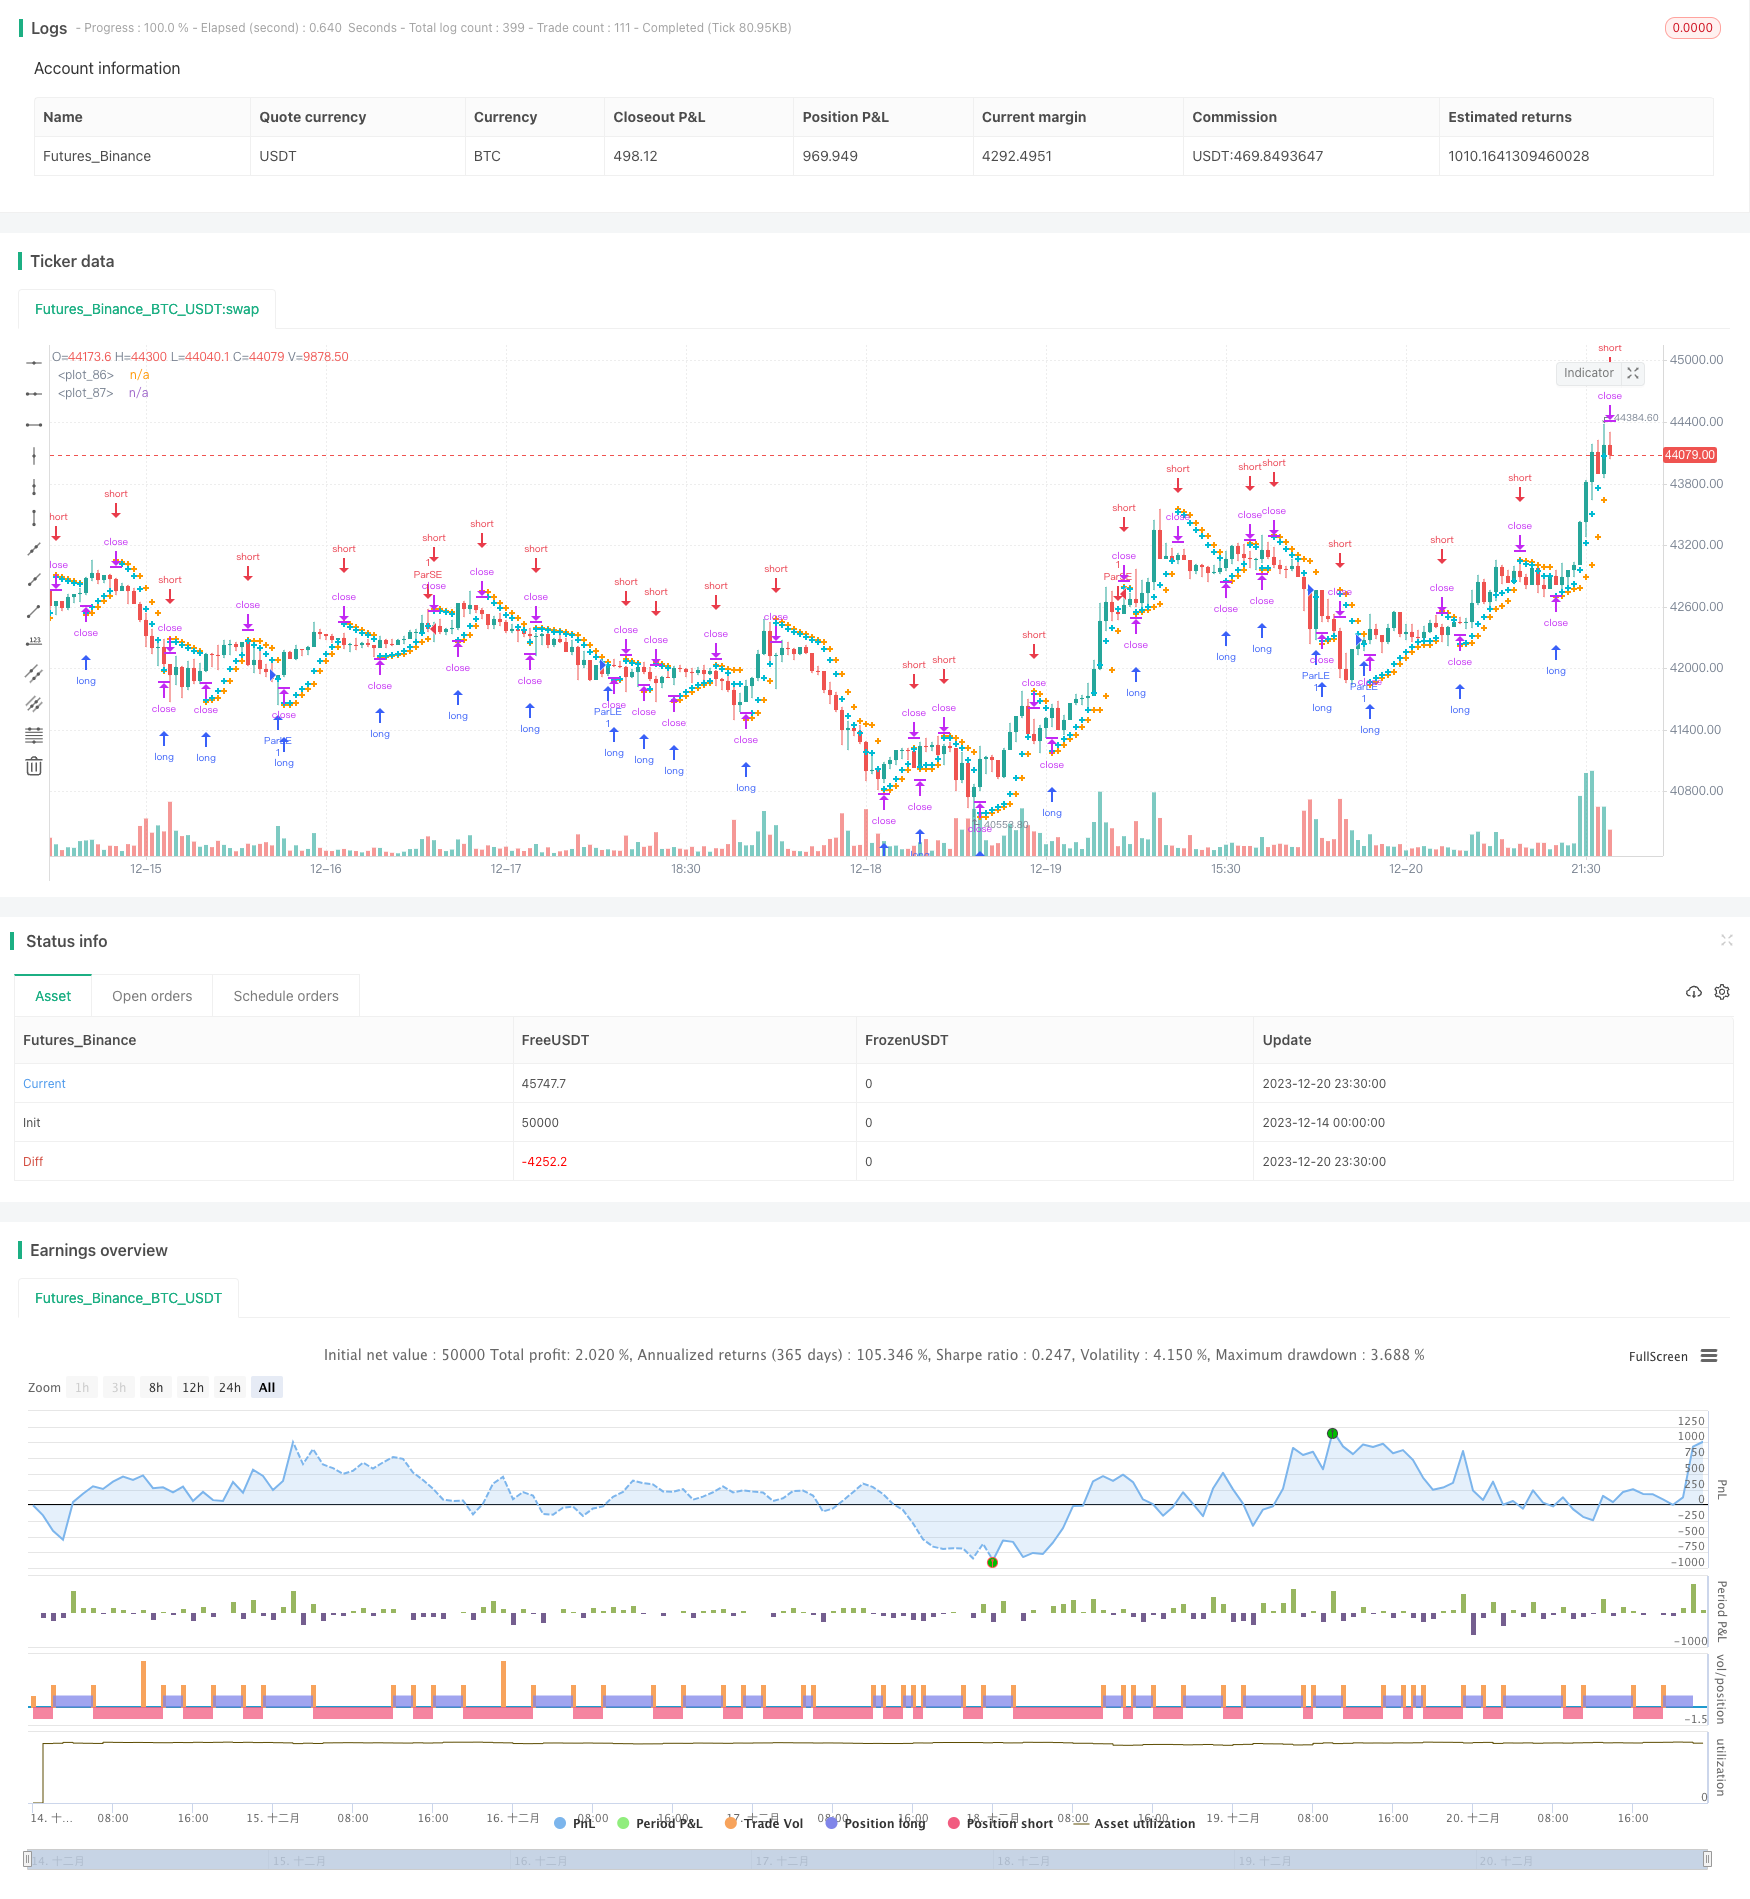
Overview
This strategy utilizes the crossover operation between the Parabolic SAR sliding value and candlestick to achieve momentum tracking and stop loss for swing trading. The strategy will establish long and short positions when the price is rising and falling. It will close out these positions to stop loss when the price reverses.
Strategy Logic
The core of this strategy relies on the Parabolic SAR indicator to determine whether the current price is in an upward or downward trend. When the Parabolic SAR indicator is below the candlestick, it means that the price is currently rising. In this case, the strategy will check at the close of each candlestick whether the Parabolic SAR value crosses above the low of the candlestick. If not, it means the upward trend continues and the strategy will establish a long position. If Parabolic SAR crosses above the low, it means the upside trend reverses downside, and the strategy will close the long position to stop loss.
On the contrary, when Parabolic SAR is above the candlestick, it means the price is currently falling. In this case, the strategy will check at the close of each candlestick whether Parabolic SAR crosses below the high of the candlestick. If not, it will establish a short position. If Parabolic SAR crosses the high, it means the downside trend reverses upside, and the strategy will close the short position to stop loss.
Through this logic, the strategy can establish positions along the price trend and realize stop loss in the first time when trend reverses, locking in profits. Meanwhile, Parabolic SAR as a momentum indicator can more accurately determine whether the trend is reversed, making the stop loss more precise.
Advantages
- Parabolic SAR is an advanced and accurate technical indicator to determine trend and reversal points, improving judgment accuracy.
- Taking advantage of momentum tracking and reversal stop loss methods can make full use of trending opportunities.
- The strict stop loss rules mean good risk control capability.
- Optimized parameters make this strategy particularly suitable for GBP/JPY with strong trend.
Risks
- Like any single indicator strategies, this strategy may suffer from Parabolic SAR's misjudgement on trend and reversals. Invalid signals may lead to unnecessary losses.
- The strategy fully depends on Parabolic SAR for entries and exits. Improper parameter settings and loose stop loss points may fail to control risks effectively.
- Any single strategy may gradually deteriorate due to changing market structure and environments. Regular backtests and optimizations are necessary.
Methods to enhance robustness include: optimizing stop loss points to make them strict enough; combining other indicators for confirmation; adjusting parameters to adapt to changing environments; selecting optimal parameter sets for different products, etc.
Optimization Directions
- Test and optimize combinations of Parabolic SAR parameters for better performance.
- Combine other indicators like MACD, KD to form a multi-indicator confirmation system, improving signal reliability.
- Test effects of different stop loss methods like trail stop loss, time stop loss, price stop loss, etc.
- Optimize parameters based on different product characteristics so that the strategy can achieve good returns across products.
Conclusion
In general, this Parabolic SAR swing strategy is quite an effective short-term trading strategy. It takes advantage of Parabolic SAR to determine trend direction and momentum changes, together with swing trading methods, to repeatedly establish long and short positions during uptrends and downtrends. The strict stop loss mechanism also gives this strategy decent risk control capability. But as a single indicator strategy, the invalidity of Parabolic SAR will have a significant impact. So this is a strategy with some strength and potential, but also has some risks. It needs backtests, optimizations and enhancements to generate stable excess returns in live trading.
Parameters
| Name | Default | What it controls |
|---|---|---|
| v_input_1 | 0.05 | start |
| v_input_2 | 0.075 | increment |
| v_input_3 | true | maximum |
| v_input_4 | true | From Day |
| v_input_5 | true | From Month |
| v_input_6 | 2000 | From Year |
| v_input_7 | 31 | To Day |
| v_input_8 | 12 | To Month |
| v_input_9 | 2020 | To Year |
Source Pine Script
/*backtest
start: 2023-12-14 00:00:00
end: 2023-12-21 00:00:00
period: 30m
basePeriod: 15m
exchanges: [{"eid":"Futures_Binance","currency":"BTC_USDT"}]
*/

//@version=4
strategy("Parabolic SAR Strategy", overlay=true)
start = input(0.05)
increment = input(0.075)
maximum = input(1)

fromDay = input(defval = 1, title = "From Day", minval = 1, maxval = 31)
fromMonth = input(defval = 1, title = "From Month", minval = 1, maxval = 12)
fromYear = input(defval = 2000, title = "From Year", minval = 1970)
 //monday and session
// To Date Inputs
toDay = input(defval = 31, title = "To Day", minval = 1, maxval = 31)
toMonth = input(defval = 12, title = "To Month", minval = 1, maxval = 12)
toYear = input(defval = 2020, title = "To Year", minval = 1970)

startDate = timestamp(fromYear, fromMonth, fromDay, 00, 00)
finishDate = timestamp(toYear, toMonth, toDay, 00, 00)
time_cond = true

var bool uptrend = na
var float EP = na
var float SAR = na
var float AF = start
var float nextBarSAR = na
if bar_index > 0
	firstTrendBar = false
	SAR := nextBarSAR
	if bar_index == 1
		float prevSAR = na
		float prevEP = na
		lowPrev = low[1]
		highPrev = high[1]
		closeCur = close
		closePrev = close[1]
		if closeCur > closePrev
			uptrend := true
			EP := high
			prevSAR := lowPrev
			prevEP := high
		else
			uptrend := false
			EP := low
			prevSAR := highPrev
			prevEP := low
		firstTrendBar := true
		SAR := prevSAR + start * (prevEP - prevSAR)
	if uptrend
		if SAR > low
			firstTrendBar := true
			uptrend := false
			SAR := max(EP, high)
			EP := low
			AF := start
	else
		if SAR < high
			firstTrendBar := true
			uptrend := true
			SAR := min(EP, low)
			EP := high
			AF := start
	if not firstTrendBar
		if uptrend
			if high > EP
				EP := high
				AF := min(AF + increment, maximum)
		else
			if low < EP
				EP := low
				AF := min(AF + increment, maximum)
	if uptrend
		SAR := min(SAR, low[1])
		if bar_index > 1
			SAR := min(SAR, low[2])
	else
		SAR := max(SAR, high[1])
		if bar_index > 1
			SAR := max(SAR, high[2])
	nextBarSAR := SAR + AF * (EP - SAR)
	if barstate.isconfirmed and time_cond
		if uptrend
			strategy.entry("ParSE", strategy.short, stop=nextBarSAR, comment="ParSE")
			strategy.cancel("ParLE")
		else
			strategy.entry("ParLE", strategy.long, stop=nextBarSAR, comment="ParLE")
			strategy.cancel("ParSE")
plot(SAR, style=plot.style_cross, linewidth=3, color=color.orange)
plot(nextBarSAR, style=plot.style_cross, linewidth=3, color=color.aqua)
//plot(strategy.equity, title="equity", color=color.red, linewidth=2, style=plot.style_areabr)Published by ChaoZhang on the FMZ strategy square · last modified 2023-12-22. Collected in the Quant Trading Vault. Unvalidated research: re-test with your own data and costs before trusting it.
Build this with AgenKit
A spec is not a trading system. Paste this into your coding agent and AgenKit runs a specialist team — architecture, test-first build, risk gates, review — with paper trading on by default.
/agenkit build a production-grade trading bot with a backtest engine, risk controls and paper trading by default from strategies/Parabolic-SAR-Momentum-Reversal-Strategy.md- npx agenkit install engineering-kit in your project
- Paste the command into your agent and approve each phase
- Get tests, backtest, risk controls and a paper-trading switch
Understand it first
Before you run this, read the lesson behind the idea and how to backtest it honestly. Specs like this one are the survivors of an unknown number of trials; deflate their results accordingly.
Related specs
- Dual Rail Parabolic SAR Bollinger Bands StrategyPine Script · Mean reversion
- Dynamic PSAR Stock Fluctuation Tracking StrategyPine Script · Mean reversion · 10m
- Parabolic SAR Divergence Trading StrategyPine Script · Mean reversion · 1d
- Parabolic SAR Trailing Stop Loss StrategyPine Script · Mean reversion · 3h
- Combining Simple Moving Average and Adaptive Moving Average StrategyPine Script · Mean reversion · 5m
- Multi Dimensional Technical Indicator Cross Confirmation Buy Signal Optimization StrategyPine Script · Mean reversion · 1d