Strategy vault / Mean reversion
Parabolic SAR Trend Tracking Stop Loss Reversal Strategy
The Parabolic SAR Trend Tracking Stop Loss Reversal Strategy is a strategy that uses the Parabolic SAR indicator to identify trends and enter counter trend positions when the trend reverses. The strategy also…
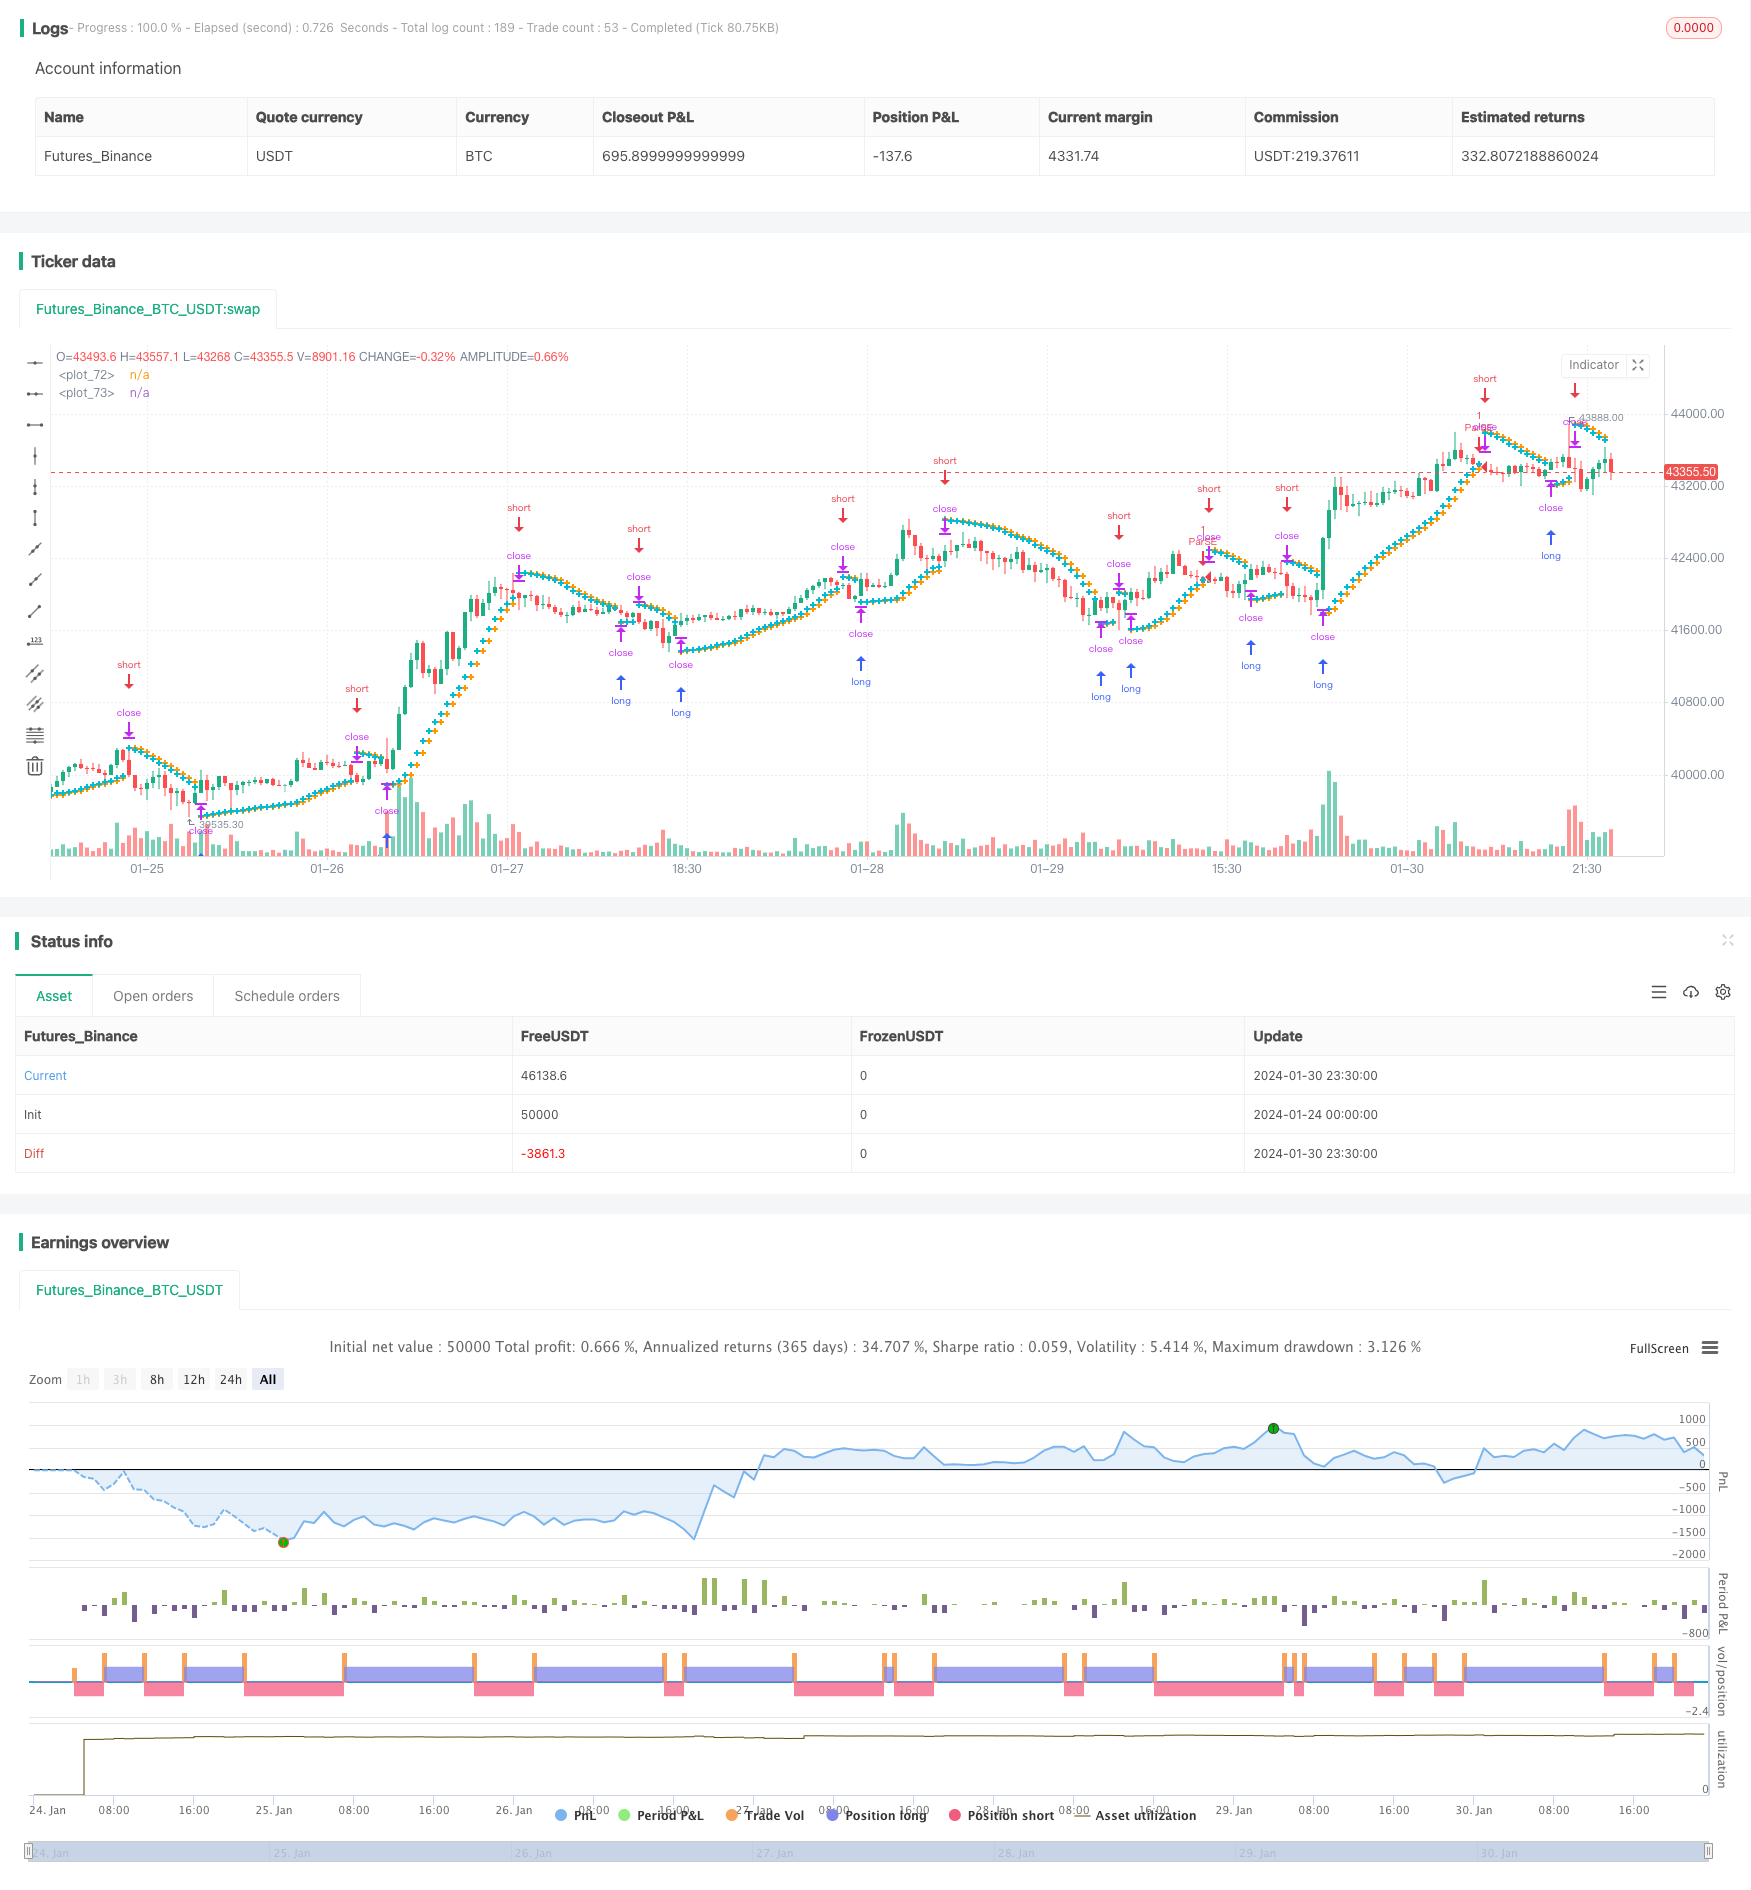
Overview
The Parabolic SAR Trend Tracking Stop Loss Reversal Strategy is a strategy that uses the Parabolic SAR indicator to identify trends and enter counter trend positions when the trend reverses. The strategy also incorporates stop loss and take profit mechanisms to control risk.
Strategy Logic
The strategy uses the Parabolic SAR indicator to judge the current market trend. Parabolic SAR stands for "Parabolic Stop and Reverse". Its indicator lines form a series of parabolas on the price chart, and these parabola points represent potential reversal points.
When the SAR points are falling and below the price, it represents a bullish trend; when the SAR points are rising and above the price, it represents a bearish trend. The strategy judges the current trend direction based on the SAR points' location.
Specifically, when SAR points show an uptrend and are above prices, the strategy will go short; when SAR points show a downtrend and are below prices, the strategy will go long. That is entering counter trend positions when SAR points indicate trend reversal.
In addition, the strategy also sets stop loss and take profit mechanisms. When going long, it may set a stop loss price to limit losses; at the same time, it may set a take profit price to close positions after reaching a certain target profit. Going short is similar.
Advantage Analysis
The main advantages combining the trend indicator and stop loss/take profit mechanisms are:
- Timely capture reverse trend opportunities for counter trend trading.
- Actively control risks and profits by setting stop loss and take profit.
- Parabolic SAR is a widely used and effective reverse indicator.
- Simple and clear strategy rules, easy to understand and implement.
Risk Analysis
There are also some risks to note for the strategy:
- Parabolic SAR indicator is not perfect, sometimes it generates wrong signals.
- The stop loss and take profit prices need to be set reasonably, otherwise it may stop out or take profit prematurely.
- Trading commissions also affect total profits.
- The new trend after reversal may be short-lived.
These risks can be solved by parameter optimization, using other filter indicators etc.
Optimization Directions
The strategy can be optimized in the following aspects:
- Optimize the Parabolic SAR parameters to find the best combination.
- Try different stop loss and take profit strategies like trailing stop loss.
- Add indicators or conditions to filter reverse trading signals.
- Add position control based on market conditions.
- Adjust parameters for different trading instruments.
Conclusion
In general, this is a rather classical trend tracking stop loss reversal strategy. It identifies trend reversals and also controls risks with stop loss and take profit means. After optimizations it can become a worthwhile strategy for live trading.
Parameters
| Name | Default | What it controls |
|---|---|---|
| v_input_1 | 0.02 | start |
| v_input_2 | 0.02 | increment |
| v_input_3 | 0.2 | maximum |
| v_input_4 | false | (?Stop Loss and Take Profit)Short Stop Loss |
| v_input_5 | 5 | (%) |
| v_input_6 | false | Long Stop Loss |
| v_input_7 | 5 | (%) |
| v_input_8 | false | Short Take Profit |
| v_input_9 | 20 | (%) |
| v_input_10 | false | Long Take Profit |
| v_input_11 | 20 | (%) |
Source Pine Script
/*backtest
start: 2024-01-24 00:00:00
end: 2024-01-31 00:00:00
period: 30m
basePeriod: 15m
exchanges: [{"eid":"Futures_Binance","currency":"BTC_USDT"}]
*/

//@version=4
strategy("Parabolic SAR Strategy", overlay=true)
start = input(0.02)
increment = input(0.02)
maximum = input(0.2)
var bool uptrend = na
var float EP = na
var float SAR = na
var float AF = start
var float nextBarSAR = na
if bar_index > 0
	firstTrendBar = false
	SAR := nextBarSAR
	if bar_index == 1
		float prevSAR = na
		float prevEP = na
		lowPrev = low[1]
		highPrev = high[1]
		closeCur = close
		closePrev = close[1]
		if closeCur > closePrev
			uptrend := true
			EP := high
			prevSAR := lowPrev
			prevEP := high
		else
			uptrend := false
			EP := low
			prevSAR := highPrev
			prevEP := low
		firstTrendBar := true
		SAR := prevSAR + start * (prevEP - prevSAR)
	if uptrend
		if SAR > low
			firstTrendBar := true
			uptrend := false
			SAR := max(EP, high)
			EP := low
			AF := start
	else
		if SAR < high
			firstTrendBar := true
			uptrend := true
			SAR := min(EP, low)
			EP := high
			AF := start
	if not firstTrendBar
		if uptrend
			if high > EP
				EP := high
				AF := min(AF + increment, maximum)
		else
			if low < EP
				EP := low
				AF := min(AF + increment, maximum)
	if uptrend
		SAR := min(SAR, low[1])
		if bar_index > 1
			SAR := min(SAR, low[2])
	else
		SAR := max(SAR, high[1])
		if bar_index > 1
			SAR := max(SAR, high[2])
	nextBarSAR := SAR + AF * (EP - SAR)
	if barstate.isconfirmed
		if uptrend
			strategy.entry("ParSE", strategy.short, stop=nextBarSAR, comment="ParSE")
			strategy.cancel("ParLE")
		else
			strategy.entry("ParLE", strategy.long, stop=nextBarSAR, comment="ParLE")
			strategy.cancel("ParSE")
plot(SAR, style=plot.style_cross, linewidth=3, color=color.orange)
plot(nextBarSAR, style=plot.style_cross, linewidth=3, color=color.aqua)
//Stop Loss Inputs
use_short_stop_loss = input(false, title="Short Stop Loss", group="Stop Loss and Take Profit", inline="Short_SL")
short_stop_loss = input(title="(%)", type=input.float, minval=0.0, step=0.1,
     defval=5, group="Stop Loss and Take Profit", inline="Short_SL") * 0.01
use_long_stop_loss = input(false, title="Long Stop Loss", group="Stop Loss and Take Profit", inline="Long_SL")
long_stop_loss = input(title="(%)", type=input.float, minval=0.0, step=0.1,
     defval=5, group="Stop Loss and Take Profit", inline="Long_SL") * 0.01

//Take Profit Inputs
use_short_take_profit = input(false, title="Short Take Profit", group="Stop Loss and Take Profit", inline="Short_TP")
short_take_profit = input(title="(%)", type=input.float, minval=0.0, step=0.1,
     defval = 20, group="Stop Loss and Take Profit", inline="Short_TP") * .01
use_long_take_profit = input(false, title="Long Take Profit", group="Stop Loss and Take Profit", inline="Long_TP")
long_take_profit = input(title="(%)", type=input.float, minval=0.0, step=0.1,
     defval = 20, group="Stop Loss and Take Profit", inline="Long_TP") * .01


longStopPrice  = strategy.position_avg_price * (1 - long_stop_loss)
shortStopPrice = strategy.position_avg_price * (1 + short_stop_loss)
longLimitPrice = strategy.position_avg_price * (1 + long_take_profit)
shortLimitPrice = strategy.position_avg_price * (1 - short_take_profit)


if (strategy.position_size > 0.0)
    if (use_long_stop_loss and not use_long_take_profit)
        strategy.exit("Long", stop = longStopPrice)
    if (use_long_take_profit and not use_long_stop_loss)
        strategy.exit("Long", limit = longLimitPrice)
    if (use_long_take_profit and use_long_stop_loss)
        strategy.exit("Long", stop = longStopPrice, limit=longLimitPrice)
if (strategy.position_size < 0.0)
    if (use_short_stop_loss and not use_short_take_profit)
        strategy.exit("Short", stop = shortStopPrice)
    if (use_short_take_profit and not use_short_stop_loss)
        strategy.exit("Short", limit = shortLimitPrice)
    if (use_short_take_profit and use_short_stop_loss)
        strategy.exit("Short", stop = shortStopPrice, limit = shortLimitPrice)

//plot(strategy.equity, title="equity", color=color.red, linewidth=2, style=plot.style_areabr)Published by ChaoZhang on the FMZ strategy square · last modified 2024-02-01. Collected in the Quant Trading Vault. Unvalidated research: re-test with your own data and costs before trusting it.
Build this with AgenKit
A spec is not a trading system. Paste this into your coding agent and AgenKit runs a specialist team — architecture, test-first build, risk gates, review — with paper trading on by default.
/agenkit build a production-grade trading bot with a backtest engine, risk controls and paper trading by default from strategies/Parabolic-SAR-Trend-Tracking-Stop-Loss-Reversal-Strategy.md- npx agenkit install engineering-kit in your project
- Paste the command into your agent and approve each phase
- Get tests, backtest, risk controls and a paper-trading switch
Understand it first
Before you run this, read the lesson behind the idea and how to backtest it honestly. Specs like this one are the survivors of an unknown number of trials; deflate their results accordingly.
Related specs
- Dual Rail Parabolic SAR Bollinger Bands StrategyPine Script · Mean reversion
- Dynamic PSAR Stock Fluctuation Tracking StrategyPine Script · Mean reversion · 10m
- Parabolic SAR Divergence Trading StrategyPine Script · Mean reversion · 1d
- Parabolic SAR Trailing Stop Loss StrategyPine Script · Mean reversion · 3h
- Combining Simple Moving Average and Adaptive Moving Average StrategyPine Script · Mean reversion · 5m
- Multi Dimensional Technical Indicator Cross Confirmation Buy Signal Optimization StrategyPine Script · Mean reversion · 1d