Parabolic Stop and Reserve Multi Indicator Trading Strategy
This strategy combines multiple technical indicators including Parabolic SAR, Triple Exponential Moving Average (TEMA), Exponential Moving Average (EMA), Relative Strength Index (RSI), On Balance Volume (OBV), etc…
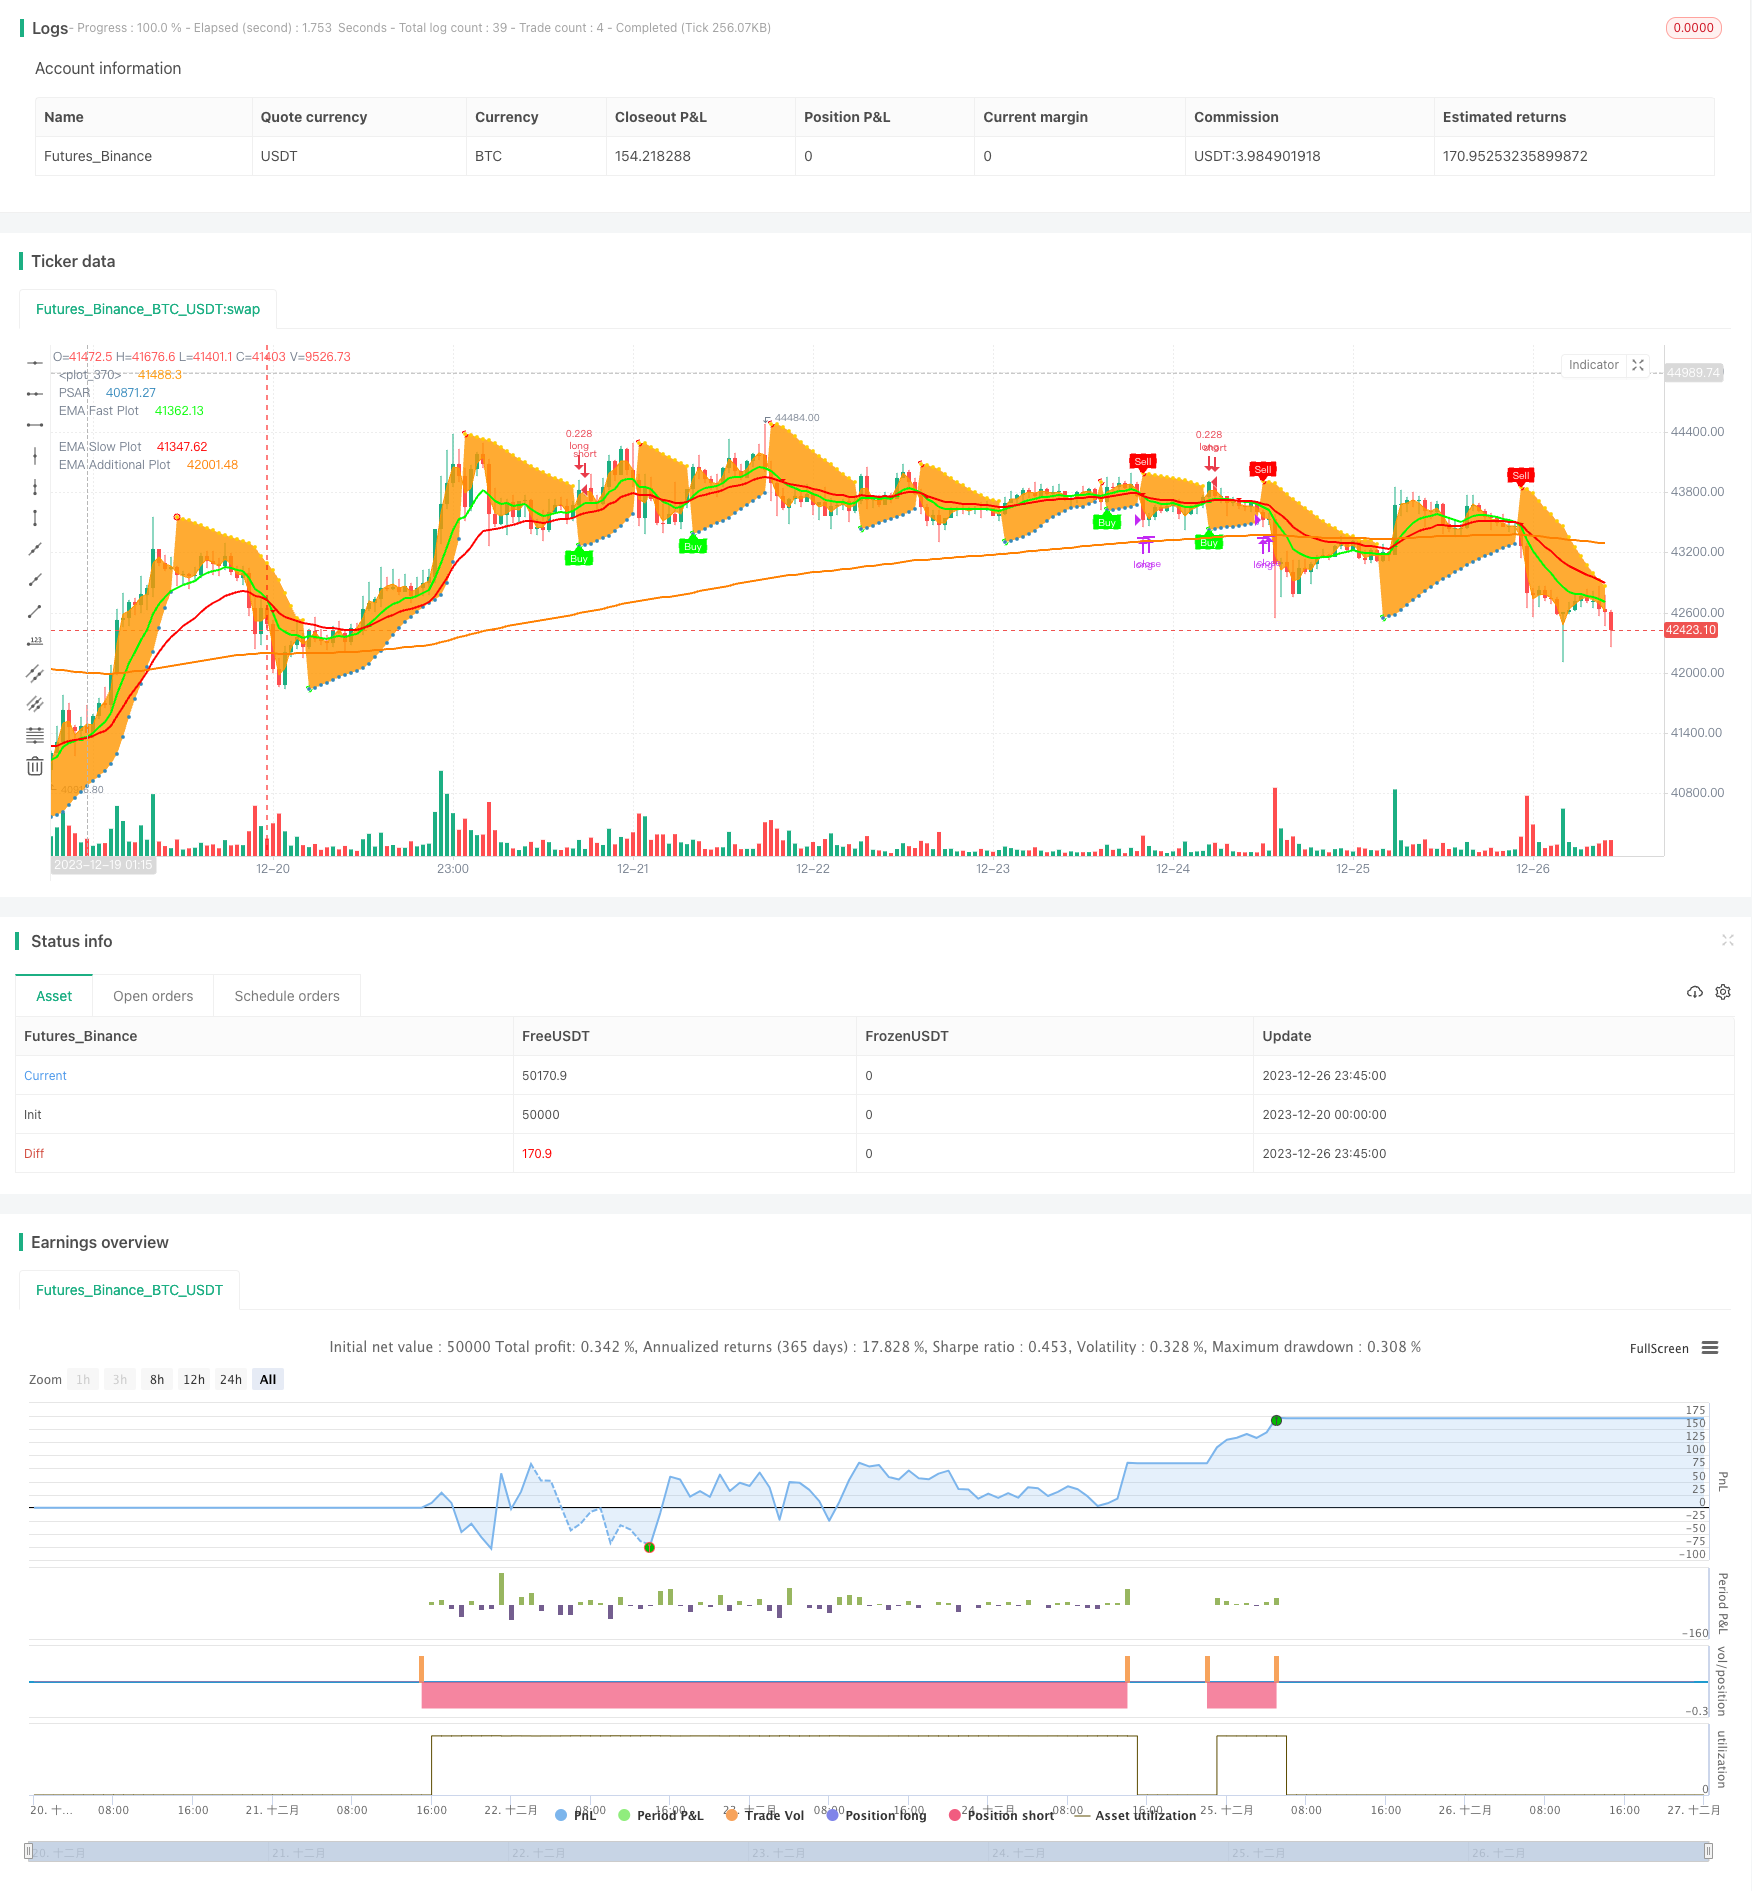
Overview
This strategy combines multiple technical indicators including Parabolic SAR, Triple Exponential Moving Average (TEMA), Exponential Moving Average (EMA), Relative Strength Index (RSI), On Balance Volume (OBV), etc. to identify price reversal signals of stocks, with additional trend filtering and stop loss to generate buy and sell signals.
Strategy Logic
The strategy uses Parabolic SAR as the primary indicator for price reversal signals. SAR appears above the price in bullish state and below the price in bearish state. When SAR breaks upwards from below the price, a sell signal is generated. When SAR breaks downwards from above the price, a buy signal is triggered.
To filter false signals, the strategy uses TEMA or EMA crossovers as confirmation signals. Only when SAR signal appears together with TEMA(fast line crosses above slow line) or EMA(fast line crosses above slow line) crossovers, a buy signal will be generated. Likewise, only SAR signal plus TEMA(fast line crosses below slow line) or EMA(fast line crosses below slow line) crossovers can trigger sell signals.
The strategy also provides RSI indicator and OBV indicator as alternative confirmation signals.
In addition, Triple EMA indicator plot is displayed to offer a clear view of the price trend. The modal indicator Ehler's eMAMA is also plotted to help identify trend reversal points.
A summary table of multiple indicator values is also presented at the bottom of the chart for quick overview.
Strengths
By combining SAR, EMA/TEMA, RSI, OBV and other indicators, the strategy can effectively detect price reversal signals and avoid false breakouts. With additional trend judgment from Triple EMA and eMAMA analysis, the accuracy can be further improved.
The rich graphical display of multiple indicators enables comprehensive market observation and analysis. The summary indicator table allows quick grasp of latest status of multiple indicators.
The trading logic rules are clear and parameters configurable, which makes the strategy adaptable to different trading instruments.
Risks
The strategy relies on indicator crossovers to generate signals. Incorrect indicator parameter settings may produce excessive noisy signals. Indicator parameters need tuning based on different trading instruments' characteristics.
In ranging and sideways markets, SAR indicator could generate frequent false signals. In these cases the confirmation from trend indicators should be taken into account.
Failure in strategy can also come from inappropriate choice of trading instruments. Instruments with significant trend are preferred for applying this strategy.
Optimization Directions
The strategy can be enhanced from the following aspects:
- Optimize SAR parameters to reduce noisy signals
- Optimize Moving Average parameters for better trend judgment
- Try out different confirmation indicators like RSI and OBV
- Add more auxiliary indicators for multi-timeframe analysis
- Optimize stop loss mechanisms to limit per trade loss
Conclusion
The Parabolic Stop and Reserve Multi-Indicator Trading Strategy integrates various commonly used technical indicators to form systematic buy and sell signals. It can effectively identify price reversal points. The configurable parameters make it easy to optimize for different trading instruments. Experienced quant traders can take advantage of this strategy. However parameter tuning based on specific instrument characteristics is a must. In addition trending instruments should be selected to avoid excessive noisy signals.
Parameters
| Name | Default | What it controls |
|---|---|---|
| v_input_14 | false | Set stop loss to PSAR plot? |
| v_input_1_close | 0 | (?Global)Source for indicator: close | high | low | open | hl2 | hlc3 | hlcc4 | ohlc4 |
| v_input_2 | true | Create long positions? |
| v_input_3 | false | Create short positions? |
| v_input_4 | true | (?PSAR)Show PSAR? |
| v_input_5 | 0.02 | PSAR Start |
| v_input_6 | 0.02 | PSAR Increment |
| v_input_7 | 0.2 | PSAR Maximum |
| v_input_8 | 0 | Confirmation signal:: EMA | TEMA | eMAMA | RSI | OBV |
| v_input_9 | true | PSAR Highlight Start Points? |
| v_input_10 | true | PSAR Show Buy/Sell Labels? |
| v_input_11 | false | PSAR Highlight State? |
| v_input_12 | #00FF00 | Long |
| v_input_13 | #FF0000 | Short |
| v_input_15 | false | (?Triple EMA)Show TEMA? |
| v_input_16 | false | Shade TEMA? |
| v_input_17 | 13 | TEMA Fast length |
| v_input_18 | #00FF00 | colorTEMAFast |
| v_input_19 | 34 | TEMA Slow length |
| v_input_20 | #FF0000 | colorTEMASlow |
| v_input_21 | 2 | Line thickness |
| v_input_22 | true | (?EMA)Show EMA? |
| v_input_23 | false | Shade EMA? |
| v_input_24 | 9 | EMA Fast Length |
| v_input_25 | #00FF00 | colorEMAFast |
| v_input_26 | 21 | EMA Slow Length |
| v_input_27 | #FF0000 | colorEMASlow |
| v_input_28 | 200 | EMA Additional Length |
| v_input_29 | #FF8000 | colorEMA200 |
| v_input_30 | false | Use as filter? |
| v_input_31 | 2 | Line thickness |
| v_input_32 | 14 | (?RSI)RSI Length |
| v_input_33 | 60 | Overbought Level |
| v_input_34 | 40 | Oversold Level |
| v_input_35 | false | (?Ehler's MESA Adaptive Moving Average)Show eMAMA? |
| v_input_36 | false | Shade eMAMA? |
| v_input_37 | 0.5 | Fast Limit |
| v_input_38 | 0.05 | Slow Limit |
| v_input_39 | 2 | Line thickness |
| v_input_40 | #00FF00 | eMAMA |
| v_input_41 | #FF0000 | eFAMA |
| v_input_42 | 20 | (?On Balance Volume)OBV Length |
| v_input_43 | 9 | EMA length |
| v_input_44 | 14 | (?SRSI)Stochastic Length |
| v_input_45 | 3 | SRSI K Smoothing |
| v_input_46 | 3 | SRSI D Smoothing |
| v_input_47 | 80 | Overbought level |
| v_input_48 | 20 | Oversold level |
| v_input_49 | 12 | (?MACD)Fast Length |
| v_input_50 | 26 | Slow Length |
| v_input_51 | 9 | Signal Smoothing |
| v_input_52 | 20 | (?Chaiken Money Flow)lengthCMF |
| v_input_53 | false | (?Summary Table)Show summary table? |
| v_input_54 | 0 | Summary Table Position: position.bottom_left | position.top_left | position.bottom_right | position.top_right |
| v_input_55 | 0 | Table Text Size: size.tiny | size.auto | size.small | size.normal | size.large | size.huge |
| v_input_56 | true | (?Limit by date)Limit backtesting by date |
| v_input_57 | 0 | Date range:: 30 Days | Custom | 90 Days | 180 Days | Year to Date |
| v_input_58 | timestamp(1 Jan 2021 1:01 -0400) | Start Date (DD/MM/YYYY) |
| v_input_59 | timestamp(31 Dec 2100 19:59 -0400) | End Date (DD/MM/YYYY) |
Source Pine Script
/*backtest
start: 2023-12-20 00:00:00
end: 2023-12-27 00:00:00
period: 45m
basePeriod: 5m
exchanges: [{"eid":"Futures_Binance","currency":"BTC_USDT"}]
*/

//
// ██╗      █████╗ ███████╗ ██████╗██╗██╗   ██╗██╗ ██████╗ ██╗   ██╗███████╗    ███╗   ███╗ ██████╗ ███╗   ██╗██╗  ██╗
// ██║     ██╔══██╗██╔════╝██╔════╝██║██║   ██║██║██╔═══██╗██║   ██║██╔════╝    ████╗ ████║██╔═══██╗████╗  ██║██║ ██╔╝
// ██║     ███████║███████╗██║     ██║██║   ██║██║██║   ██║██║   ██║███████╗    ██╔████╔██║██║   ██║██╔██╗ ██║█████╔╝
// ██║     ██╔══██║╚════██║██║     ██║╚██╗ ██╔╝██║██║   ██║██║   ██║╚════██║    ██║╚██╔╝██║██║   ██║██║╚██╗██║██╔═██╗
// ███████╗██║  ██║███████║╚██████╗██║ ╚████╔╝ ██║╚██████╔╝╚██████╔╝███████║    ██║ ╚═╝ ██║╚██████╔╝██║ ╚████║██║  ██╗
// ╚══════╝╚═╝  ╚═╝╚══════╝ ╚═════╝╚═╝  ╚═══╝  ╚═╝ ╚═════╝  ╚═════╝ ╚══════╝    ╚═╝     ╚═╝ ╚═════╝ ╚═╝  ╚═══╝╚═╝  ╚═╝
//																		 https://www.tradingview.com/u/LasciviousMonk/
//                                                                                                    © LasciviousMonk
//
//
//  This source code is subject to the terms of the Mozilla Public License 2.0 at https://mozilla.org/MPL/2.0/
//  This script provided freely.  No guarantee of functionality is provided.  You are welcome to use, revise, or modify
//  this code in any way you wish.  However, I kindly request that you publish any scripts originating from this code as
//  'Public'.  Please do not use this code as a basis for "Protected" or "Invite Only" scripts.
//
//
// PSAR + EMA + TEMA combines Parabolic PSAR plus EMA and TEMA trendlines.
//      - EMA and TEMA crossovers have an up or down triangle to indicate direction of cross.  Please note
//          that because these are Moving Averages (MAs), the triangle may not exactly line up with the crossover.
//      - Added MESA Adaptive Moving Average (eMAMA).  Crossovers of the fast and slow eMAMA may be used instead of
// 			EMA or TEMA.
//		- Added third EMA line.  May be used to filter entries.  For example, set the additional EMA to 200.  Buy signals
//			wil only be sent if the price is greater than the additional EMA.
//		- Added RSI and OBV as alternative PSAR confirmations.
//
// "Traffic Light" table: summarizes PSAR, RSI, SRSI, TEMA, EMA, eMAMA, MACD, OBV, and CMF indicators in a table.
//  This is intended as a quick "heads up", not to replace the indicators themselves.
//      - Arrows indicate direction of change since the last bar.
//      - Moving average indicators are indicated as green if the fast MA > slow MA and fast [T]EMA is increasing, red otherwise.
//          [T]EMA will be yellow if fast MA has increased over the last 2 periods but fast MA < slow MA.
//      - PSAR is as green if the PSAR is increasing, red if it is decreasing.
//      - RSI is indicated as green if RSI < oversold, red if RSI > overbought, yellow otherwise.
//      - SRSI is indicated as green K < oversold, and red if K > overbought.  If oversold < K < overbought,
//          green if K > D and red if K < D.
//      - MACD, OBV and CMF are green if bullish, red if bearish.
//
//
//  Suggestions for use:
//      - Use fast EMA crossing above slow EMA as a confirmation for PSAR signals.
//      - TEMA or eMAMA can also be used for confirmation signals insead.
//      - Instead of using a moving average (EMA, TEMA, etc) for confirmation, you may use RSI or OBV.
//      - The "traffic light" table is intended as a "heads up" to call your attention to other indicators
//          you may want to check.  I suggest Cipher B/VMC Cipher_B, Neglected Volume, and/or CM_Ult_MacD_MTF
//          as useful comparions.
//
// Please don't rely solely on the table.  It is intended to alert you to look more closely at a plot, not to
//    provide all the information you need to enter or exit a position.  I find the table to be a nice companion
//    to VMC Cipher_B, which can be overwhelming in its complexity.
//
// Code used:
//      - TEMA With Alert by BerkSay
//      - Parabolic SAR by Alex Orekhov (everget)
//      - Ehlers MESA Adaptive Moving Average [LazyBear]
//      - EMA, RSI and SRSI built-ins.
//@version=4
strategy(overlay=true, title="PSAR + EMA/TEMA/RSI/OBV", currency = 'USD', shorttitle="PSAR+",
 pyramiding = 0, default_qty_type=strategy.percent_of_equity, default_qty_value=20,
 initial_capital=5000, calc_on_every_tick=true, calc_on_order_fills=false,
 commission_type=strategy.commission.percent, commission_value=0.1)

// ------------------------------------------------<[ Color Constants ]>----------------------------------------------

// Color values used from Pine Magic.  https://www.tradingview.com/script/yyDYIrRQ-Pine-Color-Magic-and-Chart-Theme-Simulator/
var transparent = color.new(color.black, 100)
var darkpurple  = #550055, dpurple = darkpurple // Alias for dark purple,  Not recommended for use on "Dark Charts"
var purple      = #990099
var fuchsia     = #FF00FF
var violet      = #AA00FF
var hanpurple   = #6000FF
var blue        = #0000FF
var cichlid     = #0040FF
var azure       = #0080FF
var skyblue     = #00C0FF
var aqua        = #00FFFF // Not recommended for use on "Light Charts" with 1px line thickness
var mint        = #00FF80
var lime        = #00FF00
var chartreuse  = #80FF00
var yellow      = #FFFF00 // Not recommended for use on "Light Charts"
var amber       = #FFCC00
var orange      = #FF8000
var redorange   = #FF4000
var red         = #FF0000
var hotpink     = #FF0080
var pink        = #FF80FF // Not recommended for use on "Light Charts"

// ------------------------------------------------<[ User Input ]>---------------------------------------------------
sourceGlobal = input(title="Source for indicator", defval=close, type=input.source, group="Global")
tradeLong = input(title="Create long positions?", defval=true, type=input.bool, group="Global")
tradeShort = input(title="Create short positions?", defval=false, type=input.bool, group="Global")


showPSAR = input(true, "Show PSAR?", group="PSAR")
psarStart = input(title="PSAR Start", type=input.float, step=0.001, defval=0.02, group="PSAR")
psarIncrement = input(title="PSAR Increment", type=input.float, step=0.001, defval=0.02, group="PSAR")
psarMaximum = input(title="PSAR Maximum", type=input.float, step=0.01, defval=0.2, group="PSAR")
psarConfirmation = input(title="Confirmation signal:", defval="EMA",
     options=["EMA", "TEMA", "eMAMA", "RSI", "OBV"], group="PSAR")
psarHighlightStartPoints = input(title="PSAR Highlight Start Points?", type=input.bool, defval=true, group="PSAR")
psarShowLabels = input(title="PSAR Show Buy/Sell Labels?", type=input.bool, defval=true, group="PSAR")
psarHighlightState = input(title="PSAR Highlight State?", type=input.bool, defval=false, group="PSAR")
colorPSARLong = input(title="Long", type=input.color, defval=lime, group="PSAR", inline="colors")
colorPSARShort = input(title="Short", type=input.color, defval=red, group="PSAR", inline="colors")
useSL = input(defval=false, type=input.bool, title="Set stop loss to PSAR plot?")

showTEMA = input(false, "Show TEMA?", group="Triple EMA", inline="showTEMA")
showTEMAfill = input(title="Shade TEMA?", defval=false, type=input.bool, group="Triple EMA", inline="showTEMA")
lengthTEMAFast = input(title="TEMA Fast length", defval=13, minval=1, group="Triple EMA", inline="TemaFast")
colorTEMAFast = input(title="",type=input.color, defval=lime, inline="TemaFast", group="Triple EMA")
lengthTEMASlow = input(title="TEMA Slow length", defval=34, minval=1, group="Triple EMA", inline="TemaSlow")
colorTEMASlow = input(title="",type=input.color, defval=red, group="Triple EMA", inline="TemaSlow")
thicknessTEMA=input(title="Line thickness", defval=2, type=input.integer, minval=1, maxval=4, step=1, group="Triple EMA")

showEMA = input(defval=true, type=input.bool, title="Show EMA?", group="EMA", inline="showEMA")
showEMAfill = input(title="Shade EMA?", defval=false, type=input.bool, group="EMA", inline="showEMA")
lengthEMAFast = input(9, title='EMA Fast Length', step=1, type=input.integer, group="EMA", inline="EmaFast")
colorEMAFast = input(title="",type=input.color, defval=lime, inline="EmaFast", group="EMA")
lengthEMASlow = input(21, title='EMA Slow Length', step=1, type=input.integer, group="EMA", inline="EmaSlow")
colorEMASlow = input(title="",type=input.color, defval=red, group="EMA", inline="EmaSlow")
lengthEMA200 = input(200, title='EMA Additional Length', step=1, type=input.integer, group="EMA", inline="EMA200")
colorEMA200 = input(title="",type=input.color, defval=orange, group="EMA", inline="EMA200")
filterEMA200 = input(title="Use as filter?", defval=false, type=input.bool, group="EMA", inline="EMA200", tooltip="Buy and sell signals are filtered on the additional EMA line, commonly set to 200.  This takes effect even if the PSAR confirmation is set to something other than EMA.")

thicknessEMA=input(title="Line thickness", defval=2, type=input.integer, minval=1, maxval=4, step=1, group="EMA")

lengthRSI = input(title="RSI Length", type=input.integer, defval=14, group="RSI")
rsiOverbought = input(title="Overbought Level", type=input.integer, defval=60, group="RSI", inline="levels")
rsiOversold = input(title="Oversold Level", type=input.integer, defval=40, group="RSI", inline="levels")

showeMAMA = input(defval=false, title="Show eMAMA?", type=input.bool, group="Ehler's MESA Adaptive Moving Average", inline="fill")
showEMAMAfill = input(title="Shade eMAMA?", defval=false, type=input.bool, group="Ehler's MESA Adaptive Moving Average", inline="fill")
fastlimitEMAMA=input(.5, title="Fast Limit", group="Ehler's MESA Adaptive Moving Average")
slowlimitEMAMA=input(.05, title="Slow Limit", group="Ehler's MESA Adaptive Moving Average")
thicknessEMAMA=input(title="Line thickness", defval=2, type=input.integer, minval=1, maxval=4, step=1, group="Ehler's MESA Adaptive Moving Average")

coloreMAMA = input(title="eMAMA",type=input.color, defval=lime, group="Ehler's MESA Adaptive Moving Average", inline="colors")
coloreFAMA = input(title="eFAMA",type=input.color, defval=red, group="Ehler's MESA Adaptive Moving Average", inline="colors")

lengthOBV = input(defval=20, title="OBV Length", type=input.integer, group="On Balance Volume")
emaOBV    = input(defval=9, title="EMA length", type=input.integer, group="On Balance Volume")

lengthStoch = input(14, "Stochastic Length", minval=1, group="SRSI")
smoothK = input(3, "SRSI K Smoothing", minval=1, group="SRSI")
smoothD = input(3, "SRSI D Smoothing", minval=1, group="SRSI")
srsiOverbought = input(defval=80, title="Overbought level", type=input.integer, group="SRSI", inline="levels")
srsiOversold = input(defval=20, title="Oversold level", type=input.integer, group="SRSI", inline="levels")

lengthMACDfast = input(title="Fast Length", type=input.integer, defval=12, group="MACD")
lengthMACDslow = input(title="Slow Length", type=input.integer, defval=26, group="MACD")
lengthMACDsignal = input(title="Signal Smoothing", type=input.integer, minval = 1, maxval = 50, defval = 9, group="MACD")

lengthCMF = input(20, minval=1, group="Chaiken Money Flow")

showTable = input(defval=false, title="Show summary table?", type=input.bool, group="Summary Table")
tablePosition = input(title="Summary Table Position", defval=position.bottom_left,
     options=[position.bottom_left,
     position.top_left, position.bottom_right, position.top_right], group="Summary Table")
tableTextSize = input(title="Table Text Size", defval=size.tiny,
     options=[size.auto, size.tiny, size.small, size.normal, size.large, size.huge], group="Summary Table")

useDateRange = input(defval=true, title="Limit backtesting by date", type=input.bool, group="Limit by date",
	 tooltip="Limit window for backtesting.  This allows you to compare different TFs over the same period.")
rangeType = input(defval="30 Days", title="Date range:", options=["Custom", "30 Days", "90 Days", "180 Days", "Year to Date"], group="Limit by date")


startDate = input(title="Start Date (DD/MM/YYYY)", type=input.time,
     defval=timestamp("1 Jan 2021 1:01 -0400"), group="Limit by date")
endDate =   input(title="End Date (DD/MM/YYYY)  ", type=input.time,
     defval=timestamp("31 Dec 2100 19:59 -0400"), group="Limit by date", tooltip="You likely want to leave this far in the future.")

startDate := rangeType == "Custom" ? startDate :
     rangeType == "30 Days" ? timenow - 2592000000 :
     rangeType == "90 Days" ? timenow - 7776000000 :
     rangeType == "180 Days" ? timenow - 15552000000 :
     rangeType == "Year to Date" ? timestamp(syminfo.timezone, year(timenow), 01, 01, 00, 01) : na

inDateRange = (time >= startDate) and (time < endDate)
inDateRange := true


// ------------------------------------------------<[  Variable Declarations ]>----------------------------------------------
var bool psarConfirmationBuy = na
var bool psarConfirmationSell = na
var float eMAMA = na
var float eFAMA = na

var float historicalHigh = 0 // for OBV scaling

// -------------------------------------------------------<[ Functions ]>----------------------------------------------------
fDirection(series, length) =>
    rising(series,length) ? "↑" : "↓"

fTEMA(sourceTEMA, length) =>
    Tema1 = ema(sourceTEMA, length)
    Tema2 = ema(Tema1, length)
    Tema3 = ema(Tema2, length)
    3 * Tema1 - 3 * Tema2 + Tema3

fMAMA(sourceEMAMA, slowlimitEMAMA, fastlimitEMAMA) =>
	var float p = na
	var float i2 = na
	var float q2 = na
	var float re = na
	var float im = na
	var float spp = na
	sp = (4*sourceEMAMA + 3*sourceEMAMA[1] + 2*sourceEMAMA[2] + sourceEMAMA[3]) / 10.0
	dt = (.0962*sp + .5769*nz(sp[2]) - .5769*nz(sp[4])- .0962*nz(sp[6]))*(.075*nz(p[1]) + .54)
	q1 = (.0962*dt + .5769*nz(dt[2]) - .5769*nz(dt[4])- .0962*nz(dt[6]))*(.075*nz(p[1]) + .54)
	i1 = nz(dt[3])
	jI = (.0962*i1 + .5769*nz(i1[2]) - .5769*nz(i1[4])- .0962*nz(i1[6]))*(.075*nz(p[1]) + .54)
	jq = (.0962*q1 + .5769*nz(q1[2]) - .5769*nz(q1[4])- .0962*nz(q1[6]))*(.075*nz(p[1]) + .54)
	i2_ = i1 - jq
	q2_ = q1 + jI
	i2 := .2*i2_ + .8*nz(i2[1])
	q2 := .2*q2_ + .8*nz(q2[1])
	re_ = i2*nz(i2[1]) + q2*nz(q2[1])
	im_ = i2*nz(q2[1]) - q2*nz(i2[1])
	re := .2*re_ + .8*nz(re[1])
	im := .2*im_ + .8*nz(im[1])
	p1 = iff(im!=0 and re!=0, 360/atan(im/re), nz(p[1]))
	p2 = iff(p1 > 1.5*nz(p1[1]), 1.5*nz(p1[1]), iff(p1 < 0.67*nz(p1[1]), 0.67*nz(p1[1]), p1))
	p3 = iff(p2<6, 6, iff (p2 > 50, 50, p2))
	p := .2*p3 + .8*nz(p3[1])
	spp := .33*p + .67*nz(spp[1])
	phaseEMAMA = atan(q1 / i1)
	dphase_ = nz(phaseEMAMA[1]) - phaseEMAMA
	dphase = iff(dphase_< 1, 1, dphase_)
	alpha_ = fastlimitEMAMA / dphase
	alpha = iff(alpha_ < slowlimitEMAMA, slowlimitEMAMA, iff(alpha_ > fastlimitEMAMA, fastlimitEMAMA, alpha_))


fOBV(src) =>
    changeOBV = change(src)
    cum(changeOBV > 0 ? volume : changeOBV < 0 ? -volume : 0*volume)

// -------------------------------------------<[ Variable Calculations ]>------------------------------------------
temaSlow = fTEMA(sourceGlobal, lengthTEMASlow)
temaFast = fTEMA(sourceGlobal, lengthTEMAFast)
shortTema = crossover(temaSlow, temaFast)
longTema = crossunder(temaSlow, temaFast)
fillTema = temaFast>temaSlow ? color.new(colorTEMAFast,80) : color.new(colorTEMASlow,80)

emaFast = ema(sourceGlobal, lengthEMAFast)
emaSlow = ema(sourceGlobal, lengthEMASlow)
ema200 = ema(sourceGlobal, lengthEMA200)
longEMA = crossover(emaFast, emaSlow)
shortEMA = crossunder(emaFast , emaSlow)
fillEMA = emaFast>emaSlow ? color.new(colorEMAFast,80) : color.new(colorEMASlow,80)

cumOBV = fOBV(sourceGlobal)
oscOBV = (cumOBV - ema(cumOBV,lengthOBV))
changeOBV = change(sourceGlobal)
shortOBV = ema(cumOBV, lengthOBV)


psar = sar(psarStart, psarIncrement, psarMaximum)
psarDir = psar < close ? 1 : -1
colorPSAR = psarDir == 1 ? color.new(#3388bb,0) : color.new(#fdcc02,0)
colorPSARFill = psarHighlightState ? (psarDir == 1 ? color.new(colorPSARLong,90) : color.new(colorPSARShort,90)) : na
psarChangeCond = psarDir != psarDir[1]

valueRSI = rsi(sourceGlobal, lengthRSI)


if psarConfirmation == "EMA"
    if emaFast > emaSlow
        psarConfirmationBuy := true
        psarConfirmationSell := false
    else if emaFast < emaSlow
        psarConfirmationSell := true
        psarConfirmationBuy := false
else if psarConfirmation == "TEMA"
    if temaFast > temaSlow
        psarConfirmationBuy := true
        psarConfirmationSell := false
    else if temaFast < temaSlow
        psarConfirmationSell := true
        psarConfirmationBuy := false
else if psarConfirmation == "eMAMA"
    if eMAMA > eFAMA
        psarConfirmationBuy := true
        psarConfirmationSell := false
    else if eMAMA < eFAMA
        psarConfirmationSell := true
        psarConfirmationBuy := false
else if psarConfirmation == "RSI"
	if valueRSI < 40
        psarConfirmationBuy := true
        psarConfirmationSell := false
    else if valueRSI > 60
        psarConfirmationSell := true
        psarConfirmationBuy := false
else if psarConfirmation == "OBV"
	if oscOBV > 0
        psarConfirmationBuy := true
        psarConfirmationSell := false
    else if oscOBV < 0
        psarConfirmationSell := true
        psarConfirmationBuy := false

psarBuySignal = psarDir == 1 and psarDir[1] == -1 and (filterEMA200 ? open > ema200 : true) and inDateRange
psarSellSignal = psarDir == -1 and psarDir[1] == 1 and (filterEMA200 ? open < ema200 : true) and inDateRange

eMAMA := fMAMA(sourceGlobal, slowlimitEMAMA, fastlimitEMAMA)*sourceGlobal + (1 - fMAMA(sourceGlobal, slowlimitEMAMA, fastlimitEMAMA))*nz(eMAMA[1])
eFAMA := .5*fMAMA(sourceGlobal, slowlimitEMAMA, fastlimitEMAMA)*eMAMA + (1 - .5*fMAMA(sourceGlobal, slowlimitEMAMA, fastlimitEMAMA))*nz(eFAMA[1])
longMAMA=crossover(eMAMA, eFAMA)
shortMAMA=crossunder(eMAMA,eFAMA)
fillEMAMA = eMAMA>eFAMA ? color.new(coloreMAMA, 80) : color.new(coloreFAMA, 80)

srsiK = sma(stoch(valueRSI, valueRSI, valueRSI, lengthStoch), smoothK)
srsiD = sma(srsiK, smoothD)

fastMACD = ema(sourceGlobal, lengthMACDfast)
slowMACD = ema(sourceGlobal, lengthMACDslow)
macd = fastMACD - slowMACD
signalMACD = ema(macd, lengthMACDsignal)

adCMF = close==high and close==low or high==low ? 0 : ((2*close-low-high)/(high-low))*volume
mfCMF = sum(adCMF, lengthCMF) / sum(volume, lengthCMF)


// ================================== //
// ----> Conditional Parameters <---- //
// ================================== //

// ================================== //
// -------> Risk Mitigation <-------- //
// ================================== //

// ================================== //
// --------> Logical Order <--------- //
// ================================== //


// -------------------------------------------<[ Graphical Display ]>------------------------------------------

// TEMA plots
plotTemaSlow = plot(showTEMA ? temaSlow: na, color=color.new(colorTEMASlow,20), title="TEMA Slow plot", linewidth=thicknessTEMA)
plotTemaFast = plot(showTEMA ? temaFast: na, color=color.new(colorTEMAFast,20), title="TEMA Fast plot", linewidth=thicknessTEMA)

plotshape(showTEMA and longTema ? temaFast: na, style=shape.triangleup, location=location.absolute,
     size=size.tiny, title="TEMA Cross Up", color=color.new(colorTEMAFast,10))
plotshape(showTEMA and shortTema ? temaSlow: na, style=shape.triangledown, location=location.absolute,
     size=size.tiny, title="TEMA Cross Down", color=color.new(colorTEMASlow,10))
fill(plotTemaFast, plotTemaSlow, color=showTEMAfill ? fillTema : transparent, title="TEMA fill")

// EMA plots
plotEmaFast = plot(showEMA ? emaFast: na, title='EMA Fast Plot', color=colorEMAFast, linewidth=thicknessEMA)
plotEmaSlow = plot(showEMA ? emaSlow: na, title='EMA Slow Plot', color=colorEMASlow, linewidth=thicknessEMA)
plotEMA200 = plot(showEMA ? ema200: na, title='EMA Additional Plot', color=colorEMA200, linewidth=thicknessEMA)

plotshape(showEMA and longEMA ? emaFast : na, style=shape.triangleup, location=location.absolute, size=size.tiny,
	 title="EMA Cross Up",color=colorEMAFast)
plotshape(showEMA and shortEMA ? emaFast : na, style=shape.triangledown, location=location.absolute, size=size.tiny,
	 title="EMA Cross Down",color=colorEMASlow)
fill(plotEmaFast, plotEmaSlow, color=showEMAfill ? fillEMA : transparent, title="EMA fill")

// PSAR plots
psarPlot = plot(showPSAR ? psar: na, title="PSAR", style=plot.style_circles, linewidth=1, color=colorPSAR)
plotshape(showPSAR and psarBuySignal and psarHighlightStartPoints ? psar : na, title="PSAR Long Start", location=location.absolute,
	 style=shape.circle, size=size.tiny, color=colorPSARLong)
plotshape(showPSAR and psarBuySignal and psarShowLabels and psarConfirmationBuy ? psar : na, title="PSAR Buy Label", text="Buy", location=location.absolute,
	 style=shape.labelup, size=size.tiny, color=colorPSARLong, textcolor=color.white)
plotshape(showPSAR and psarSellSignal and psarHighlightStartPoints ? psar : na, title="PSAR Short Start", location=location.absolute,
	 style=shape.circle, size=size.tiny, color=colorPSARShort)
plotshape(showPSAR and psarSellSignal and psarShowLabels and psarConfirmationSell ? psar : na, title="PSAR Sell Label", text="Sell", location=location.absolute,
	 style=shape.labeldown, size=size.tiny, color=colorPSARShort, textcolor=color.white)
psarMidPricePlot = plot(ohlc4, title="", display=display.none, editable=false)
fill(psarMidPricePlot, psarPlot, title="PSAR Trade State Filling", color=colorPSARFill)


ploteMAMA = plot(showeMAMA ? eMAMA : na, title="Ehler's MAMA", linewidth=thicknessEMAMA, style=plot.style_line, color=coloreMAMA)
ploteFAMA = plot(showeMAMA ? eFAMA : na, title="Ehler's FAMA", linewidth=thicknessEMAMA, style=plot.style_line, color=coloreFAMA)
plotshape(showeMAMA and longMAMA ? eFAMA: na, style=shape.triangleup, location=location.absolute, size=size.tiny, title="eMAMA Cross Up",
	 color=color.new(coloreMAMA,10))
plotshape(showeMAMA and shortMAMA ? eFAMA: na, style=shape.triangledown, location=location.absolute, size=size.tiny, title="eMAMA Cross Down",
	 color=color.new(coloreFAMA,10))
fill(ploteMAMA, ploteFAMA, color=showEMAMAfill ? fillEMAMA : transparent, title="eMAMA fill")


// ---------------------------------------------------<[ Strategy Execution ]>-------------------------------------------------

strategy.entry(id="long", long=strategy.long, comment="enL", when=psarBuySignal and psarConfirmationBuy and tradeLong)
if useSL
	strategy.exit(id="long", stop=psar, comment="SL")
strategy.close(id="long", comment="exL", when=psarSellSignal and psarConfirmationSell and tradeLong)

strategy.entry(id="short", long=strategy.short, comment="enS", when=psarSellSignal and psarConfirmationSell and tradeShort)
if useSL
	strategy.exit(id="short", stop=psar, comment="SL")
strategy.close(id="short", comment="exS", when=psarBuySignal and psarConfirmationBuy and tradeShort)


// -------------------------------------------------------<[ Tables ]>---------------------------------------------------------

//   Shows red for bearish signals, green for bullish signals.
var table summaryTable = table.new(tablePosition, 3, 3)

if (barstate.islast and showTable)
    table.cell(summaryTable, 0, 0, "PSAR",text_size=tableTextSize, bgcolor = psarDir == 1 ? color.green : color.red)

    rsiDirection = fDirection(valueRSI,1)
    table.cell(summaryTable, 0, 1, "RSI " + tostring(round(valueRSI,0)) + rsiDirection,text_size=tableTextSize,
    	 bgcolor = iff(valueRSI > rsiOverbought, color.red, iff(valueRSI < rsiOversold, color.green, color.yellow)))

    srsiDirection = fDirection(srsiK,1)
    table.cell(summaryTable, 0, 2, "K " + tostring(round(srsiK,0)) + srsiDirection, text_size=tableTextSize,
    	 bgcolor=iff(srsiK > srsiOverbought, color.red, iff(srsiK < srsiOversold, color.green, srsiK > srsiD ? color.green : color.red)))

    emaDirection = fDirection(emaFast,1)
    table.cell(summaryTable, 1, 0, "EMA" + emaDirection,text_size=tableTextSize,
    	 bgcolor = emaFast > emaSlow and emaFast > emaFast[1] ? color.green : color.red)
    // See if emaFast has increased over the last two periods.
    if rising(emaFast,2) and emaFast < emaSlow
        table.cell_set_bgcolor(summaryTable, 1, 0, color.yellow)

    directionTEMA = fDirection(temaFast,1)
    table.cell(summaryTable, 1, 1, "TEMA" + directionTEMA,text_size=tableTextSize,
    	 bgcolor = temaFast > temaSlow and temaFast > temaFast[1] ? color.green : color.red)
    // See if temaFast has increased over the last two periods.
    if rising(temaFast,2) and temaFast < temaSlow
        table.cell_set_bgcolor(summaryTable, 1, 1, color.yellow)

    directionMAMA = fDirection(eMAMA,1)
    table.cell(summaryTable, 1, 2, "eMAMA" + directionMAMA,text_size=tableTextSize,
    	 bgcolor = eMAMA > eFAMA and eMAMA > eFAMA[1] ? color.green : color.red)
    // See if temaFast has increased over the last two periods.
    if rising(eMAMA,2) and eMAMA < eFAMA
        table.cell_set_bgcolor(summaryTable, 1, 2, color.yellow)

    directionMACD = fDirection(macd,2)
    table.cell(summaryTable, 2, 0, "MACD " + directionMACD, text_size=tableTextSize, bgcolor= macd > signalMACD ? color.green : color.red)

    directionOBV = fDirection(shortOBV,2)
    table.cell(summaryTable, 2, 1, "OBV " + directionOBV, text_size=tableTextSize, bgcolor= shortOBV > 0 ? color.green : color.red)

    directionCMF = fDirection(mfCMF,2)
    table.cell(summaryTable, 2, 2, "CMF " + directionCMF + tostring(mfCMF, "#.##"), text_size=tableTextSize, bgcolor= mfCMF > 0 ? color.green : color.red)


// ---------------------------------------------------<[ Alerts ]>-------------------------------------------------
if psarBuySignal and psarConfirmationBuy
	alert("PSAR buy/long signal confirmed for {{ticker}} on {{interval}}.", alert.freq_once_per_bar)

if psarSellSignal and psarConfirmationSell
	alert("PSAR sell/short signal confirmed for {{ticker}} on {{interval}}.", alert.freq_once_per_bar)

if psarChangeCond
	alert("PSAR has changed direction for {{ticker}} on {{interval}}.", alert.freq_once_per_bar)
Published by ChaoZhang on the FMZ strategy square · last modified 2023-12-28. Collected in the Quant Trading Vault. Unvalidated research: re-test with your own data and costs before trusting it.
Build this with AgenKit
A spec is not a trading system. Paste this into your coding agent and AgenKit runs a specialist team — architecture, test-first build, risk gates, review — with paper trading on by default.
/agenkit build a production-grade trading bot with a backtest engine, risk controls and paper trading by default from strategies/Parabolic-Stop-and-Reserve-Multi-Indicator-Trading-Strategy.md- npx agenkit install engineering-kit in your project
- Paste the command into your agent and approve each phase
- Get tests, backtest, risk controls and a paper-trading switch
Understand it first
Before you run this, read the lesson behind the idea and how to backtest it honestly. Specs like this one are the survivors of an unknown number of trials; deflate their results accordingly.
Related specs
- MACD Bollinger Turtle Trading StrategyPine Script · Breakout · 1d
- Bull Market Tracking SystemPine Script · Breakout · 1h
- Quantitative Strategy PSARZigZagMACDART Based on Multi Indicator CombinationPine Script · Breakout · 1m
- Quantitative Trading Strategy Based on Ichimoku with Multiple SignalsPine Script · Breakout · 1h
- Dual Moving Average and MACD Combination Short term Trading StrategyPine Script · Breakout · 1h
- Dual MACD Quantitative Trading StrategyPine Script · Breakout · 1h