Strategy vault / Trend following
Parameter Optimized Trend Following Quantitative Strategy
The main idea of this strategy is to judge and track price trends by combining the percentrank indicator and parameter optimization. The strategy generates trading signals by comparing the current price with the…
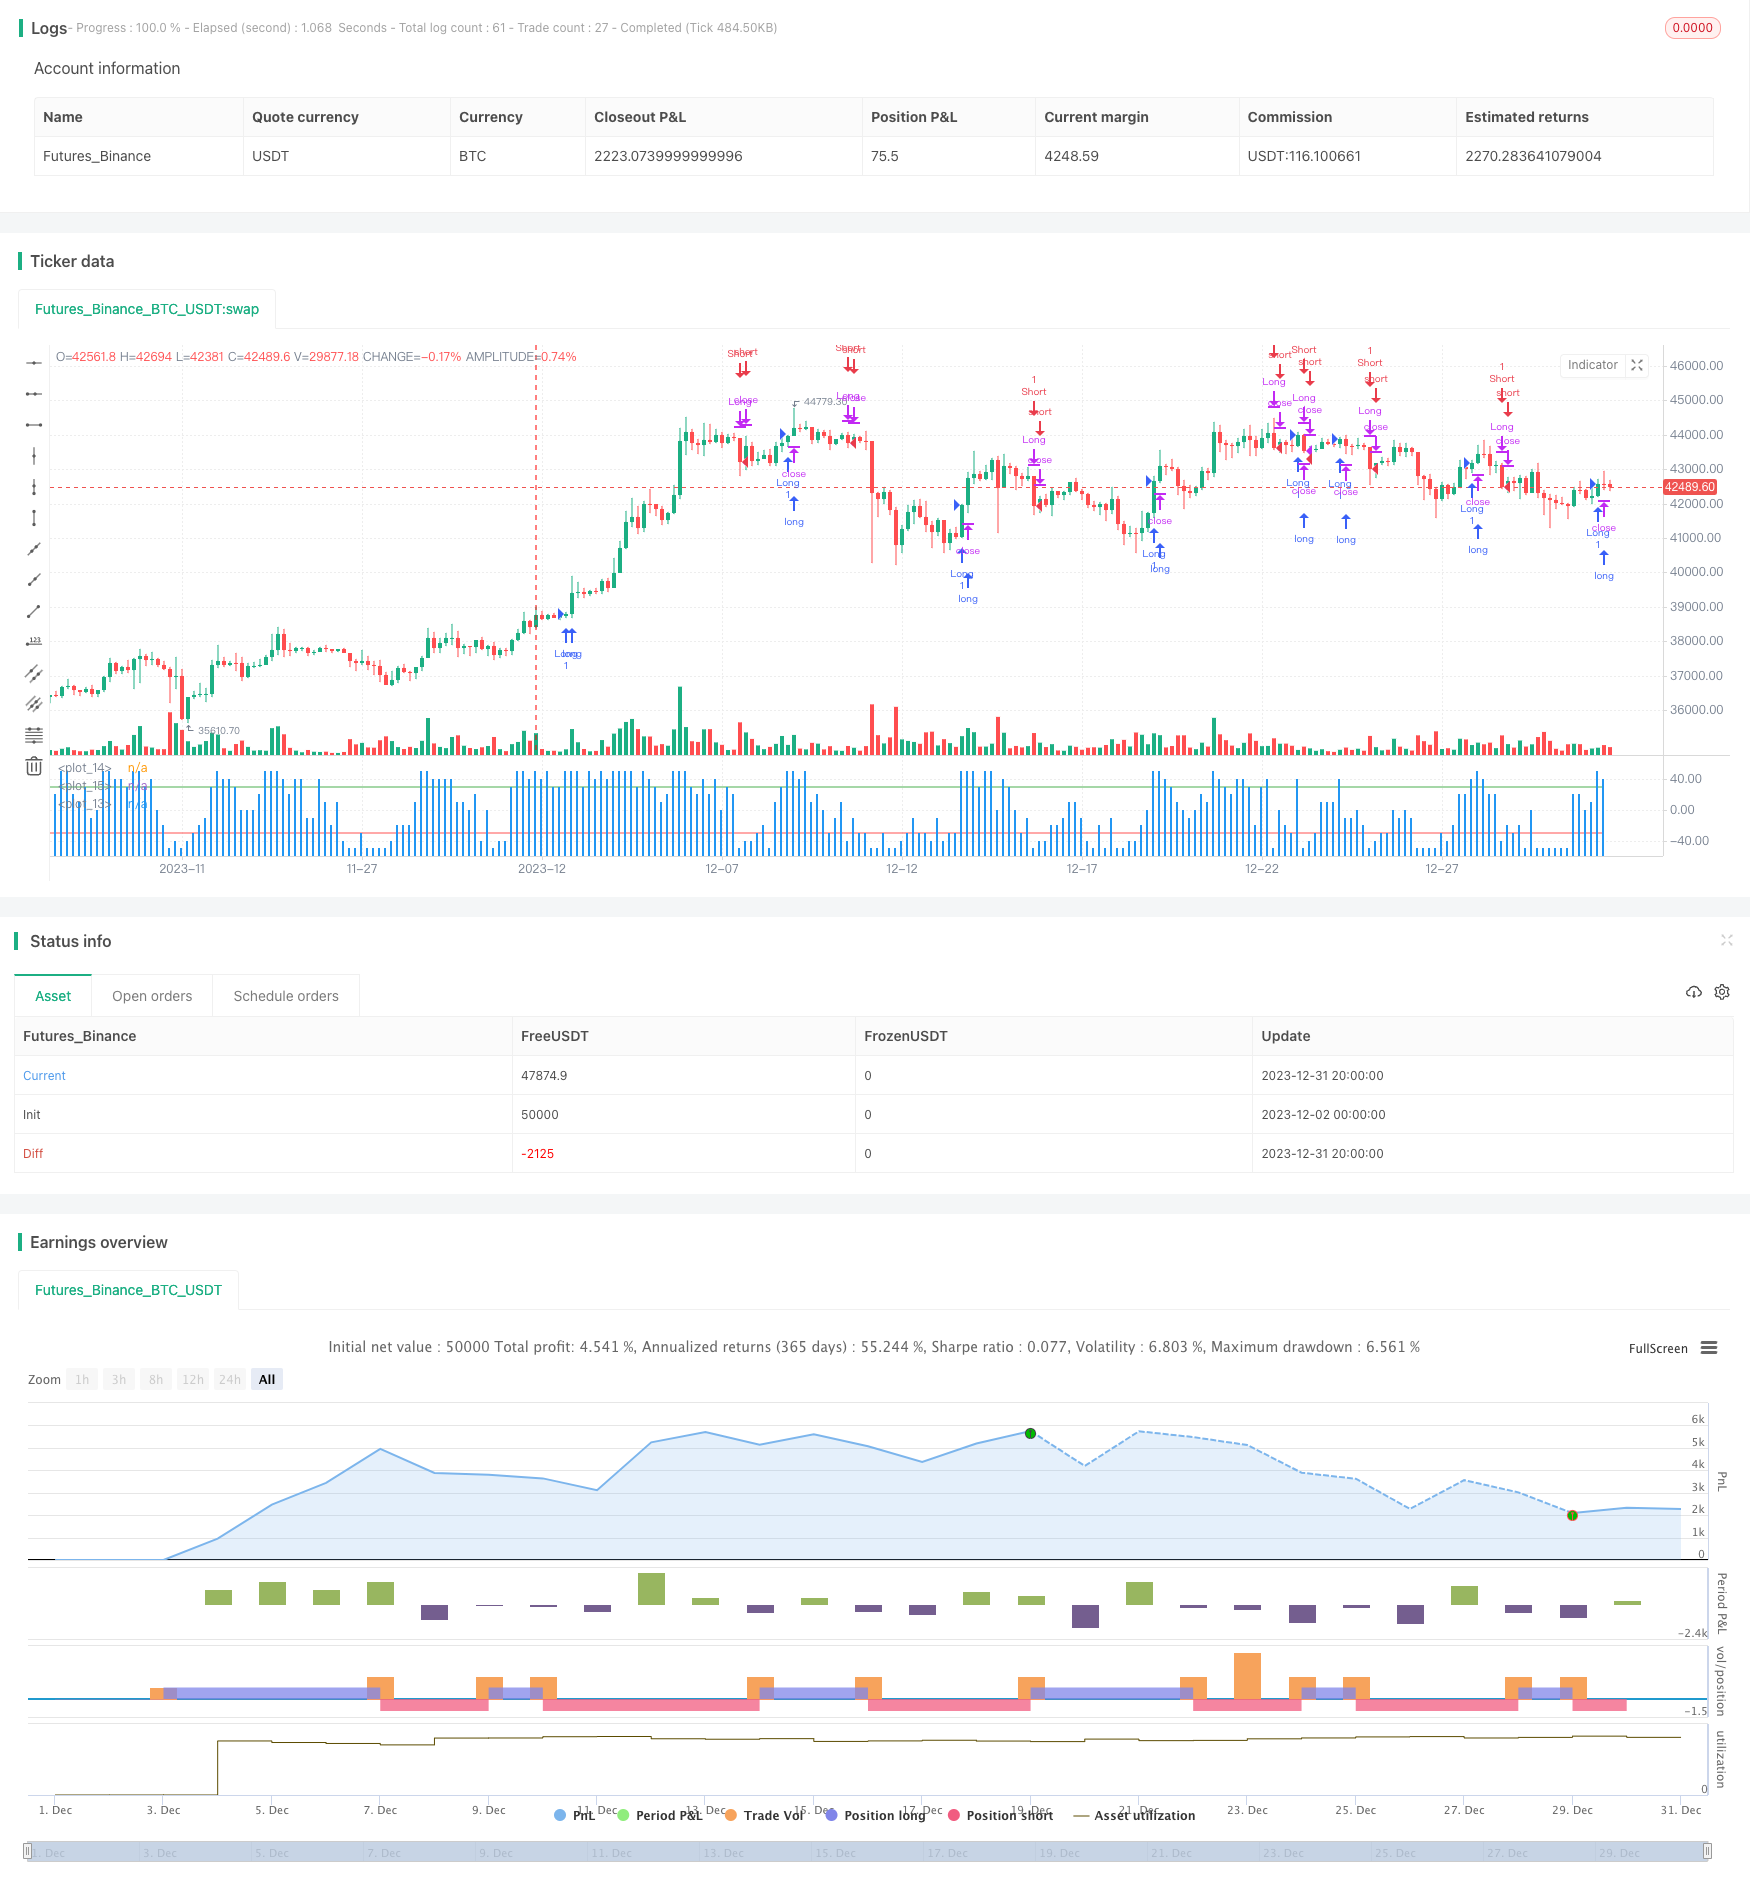
Overview
The main idea of this strategy is to judge and track price trends by combining the percentrank indicator and parameter optimization. The strategy generates trading signals by comparing the current price with the percentage of prices over a certain historical period to capture the mirror effect and track trends for excess returns.
Strategy Principle
The strategy uses the percentrank indicator to determine price trends. Percentrank represents the relative strength of the current price over the viewed period. The parameter len indicates the length of the historical period to view.
The range of percentrank values is from 0 to 100. When the percentrank value is close to 0, it means the current price is near the lowest price in the viewed period and is in an undervalued area. When it is close to 100, it means the current price is near the highest price in the viewed period and is in an overvalued area.
The strategy also introduces a scale parameter as an offset to move the 0 to 100 range to the scale to 100+scale range. Two signal lines level_1 and level_2 are also set, where level_1 indicates the long level and level_2 indicates the short level.
When the price percentrank indicator crosses level_1 upwards, a long signal is generated. When it crosses level_2 downwards, a short signal is generated. The exit conditions are opposite of the entry signals.
Advantages of the Strategy
- Use percentrank indicator to determine the strength of price trends, avoiding being trapped or chasing highs
- Apply parameter optimization methods to adjust offset scale and signal line threshold for different products and cycles to improve stability
- Combine trend following and mean reversion trading ideas to track trends in a timely manner after breaking through the signal line
Risk Analysis
- Incorrect judgment of trends resulting in unnecessary losses
- Prone to generating wrong signals when price volatility and trend are unclear
- Improper parameter settings may lead to too frequent trading or insufficient trading volume
To address the above risks, parameters like len, scale, level can be adjusted for optimization. Other indicators can also be incorporated for confirmation to avoid erroneous trades.
Optimization Directions
There is room for further optimization of the strategy:
- Stop loss points can be introduced to reduce single trade loss
- Indicators like moving average can be incorporated for confirmation to filter out some wrong signals
- Machine learning methods can be used to automatically optimize parameters
- Can run in parallel across multiple time frames
Conclusion
The overall idea of the strategy is clear, applying quantitative methods of parameter optimization to judge and track price trends. It has some practical value but still needs further testing and optimization to reduce risks and improve stable profitability.
Parameters
| Name | Default | What it controls |
|---|---|---|
| v_input_1_close | 0 | Source: close | high | low | open | hl2 | hlc3 | hlcc4 | ohlc4 |
| v_input_2 | 10 | lookback - Период сравнения |
| v_input_3 | 50 | scale offset - смещение шкалы |
| v_input_4 | 30 | sygnal line 1 |
| v_input_5 | -30 | sygnal line 2 |
Source Pine Script
/*backtest
start: 2023-12-02 00:00:00
end: 2024-01-01 00:00:00
period: 4h
basePeriod: 15m
exchanges: [{"eid":"Futures_Binance","currency":"BTC_USDT"}]
*/

// This source code is subject to the terms of the Mozilla Public License 2.0 at https://mozilla.org/MPL/2.0/
// © Alex_Dyuk

//@version=4
strategy(title="percentrank", shorttitle="percentrank")
src = input(close, title="Source")
len = input(title="lookback - Период сравнения", type=input.integer, defval=10, minval=2)
scale = input(title="scale offset - смещение шкалы", type=input.integer, defval=50, minval=0, maxval=100)
level_1 = input(title="sygnal line 1", type=input.integer, defval=30)
level_2 = input(title="sygnal line 2", type=input.integer, defval=-30)

prank = percentrank(src,len)-scale
plot(prank, style = plot.style_columns)
plot(level_2, style = plot.style_line, color = color.red)
plot(level_1, style = plot.style_line, color = color.green)

longCondition = (crossunder(level_1, prank) == true)
if (longCondition)
    strategy.entry("Long", strategy.long)
longExitCondition = (crossover(level_2, prank) == true)
if (longExitCondition)
    strategy.close("Long")

shortCondition = (crossover(level_2, prank) == true)
if (shortCondition)
    strategy.entry("Short", strategy.short)
shortexitCondition = (crossunder(level_1, prank) == true)
if (shortexitCondition)
    strategy.close("Short")
Published by ChaoZhang on the FMZ strategy square · last modified 2024-01-02. Collected in the Quant Trading Vault. Unvalidated research: re-test with your own data and costs before trusting it.
Build this with AgenKit
A spec is not a trading system. Paste this into your coding agent and AgenKit runs a specialist team — architecture, test-first build, risk gates, review — with paper trading on by default.
/agenkit build a production-grade trading bot with a backtest engine, risk controls and paper trading by default from strategies/Parameter-Optimized-Trend-Following-Quantitative-Strategy.md- npx agenkit install engineering-kit in your project
- Paste the command into your agent and approve each phase
- Get tests, backtest, risk controls and a paper-trading switch
Understand it first
Before you run this, read the lesson behind the idea and how to backtest it honestly. Specs like this one are the survivors of an unknown number of trials; deflate their results accordingly.
Related specs
- 200 EMA VWAP MFI Trend Following StrategyPine Script · Trend following · 1d
- 4 EMA Trend StrategyPine Script · Trend following · 1d
- ADX MA and EMA Long Only Trend Tracking StrategyPine Script · Trend following · 1d
- ATR Dynamic Profit Target and Stop Loss StrategyPine Script · Trend following · 1d
- ATR Dynamic Trend Following and EMA Crossover Trading StrategyPine Script · Trend following · 1d
- ATR and Moving Average Crossover Hybrid StrategyPine Script · Trend following · 1h