Strategy vault / Mean reversion
Pivot based RSI Divergence Strategy
This strategy is called "Pivot-based RSI Divergence Strategy". It uses the divergence between RSI indicators at different cycles to determine entry and exit points, and adds long-term RSI as a filter condition to…
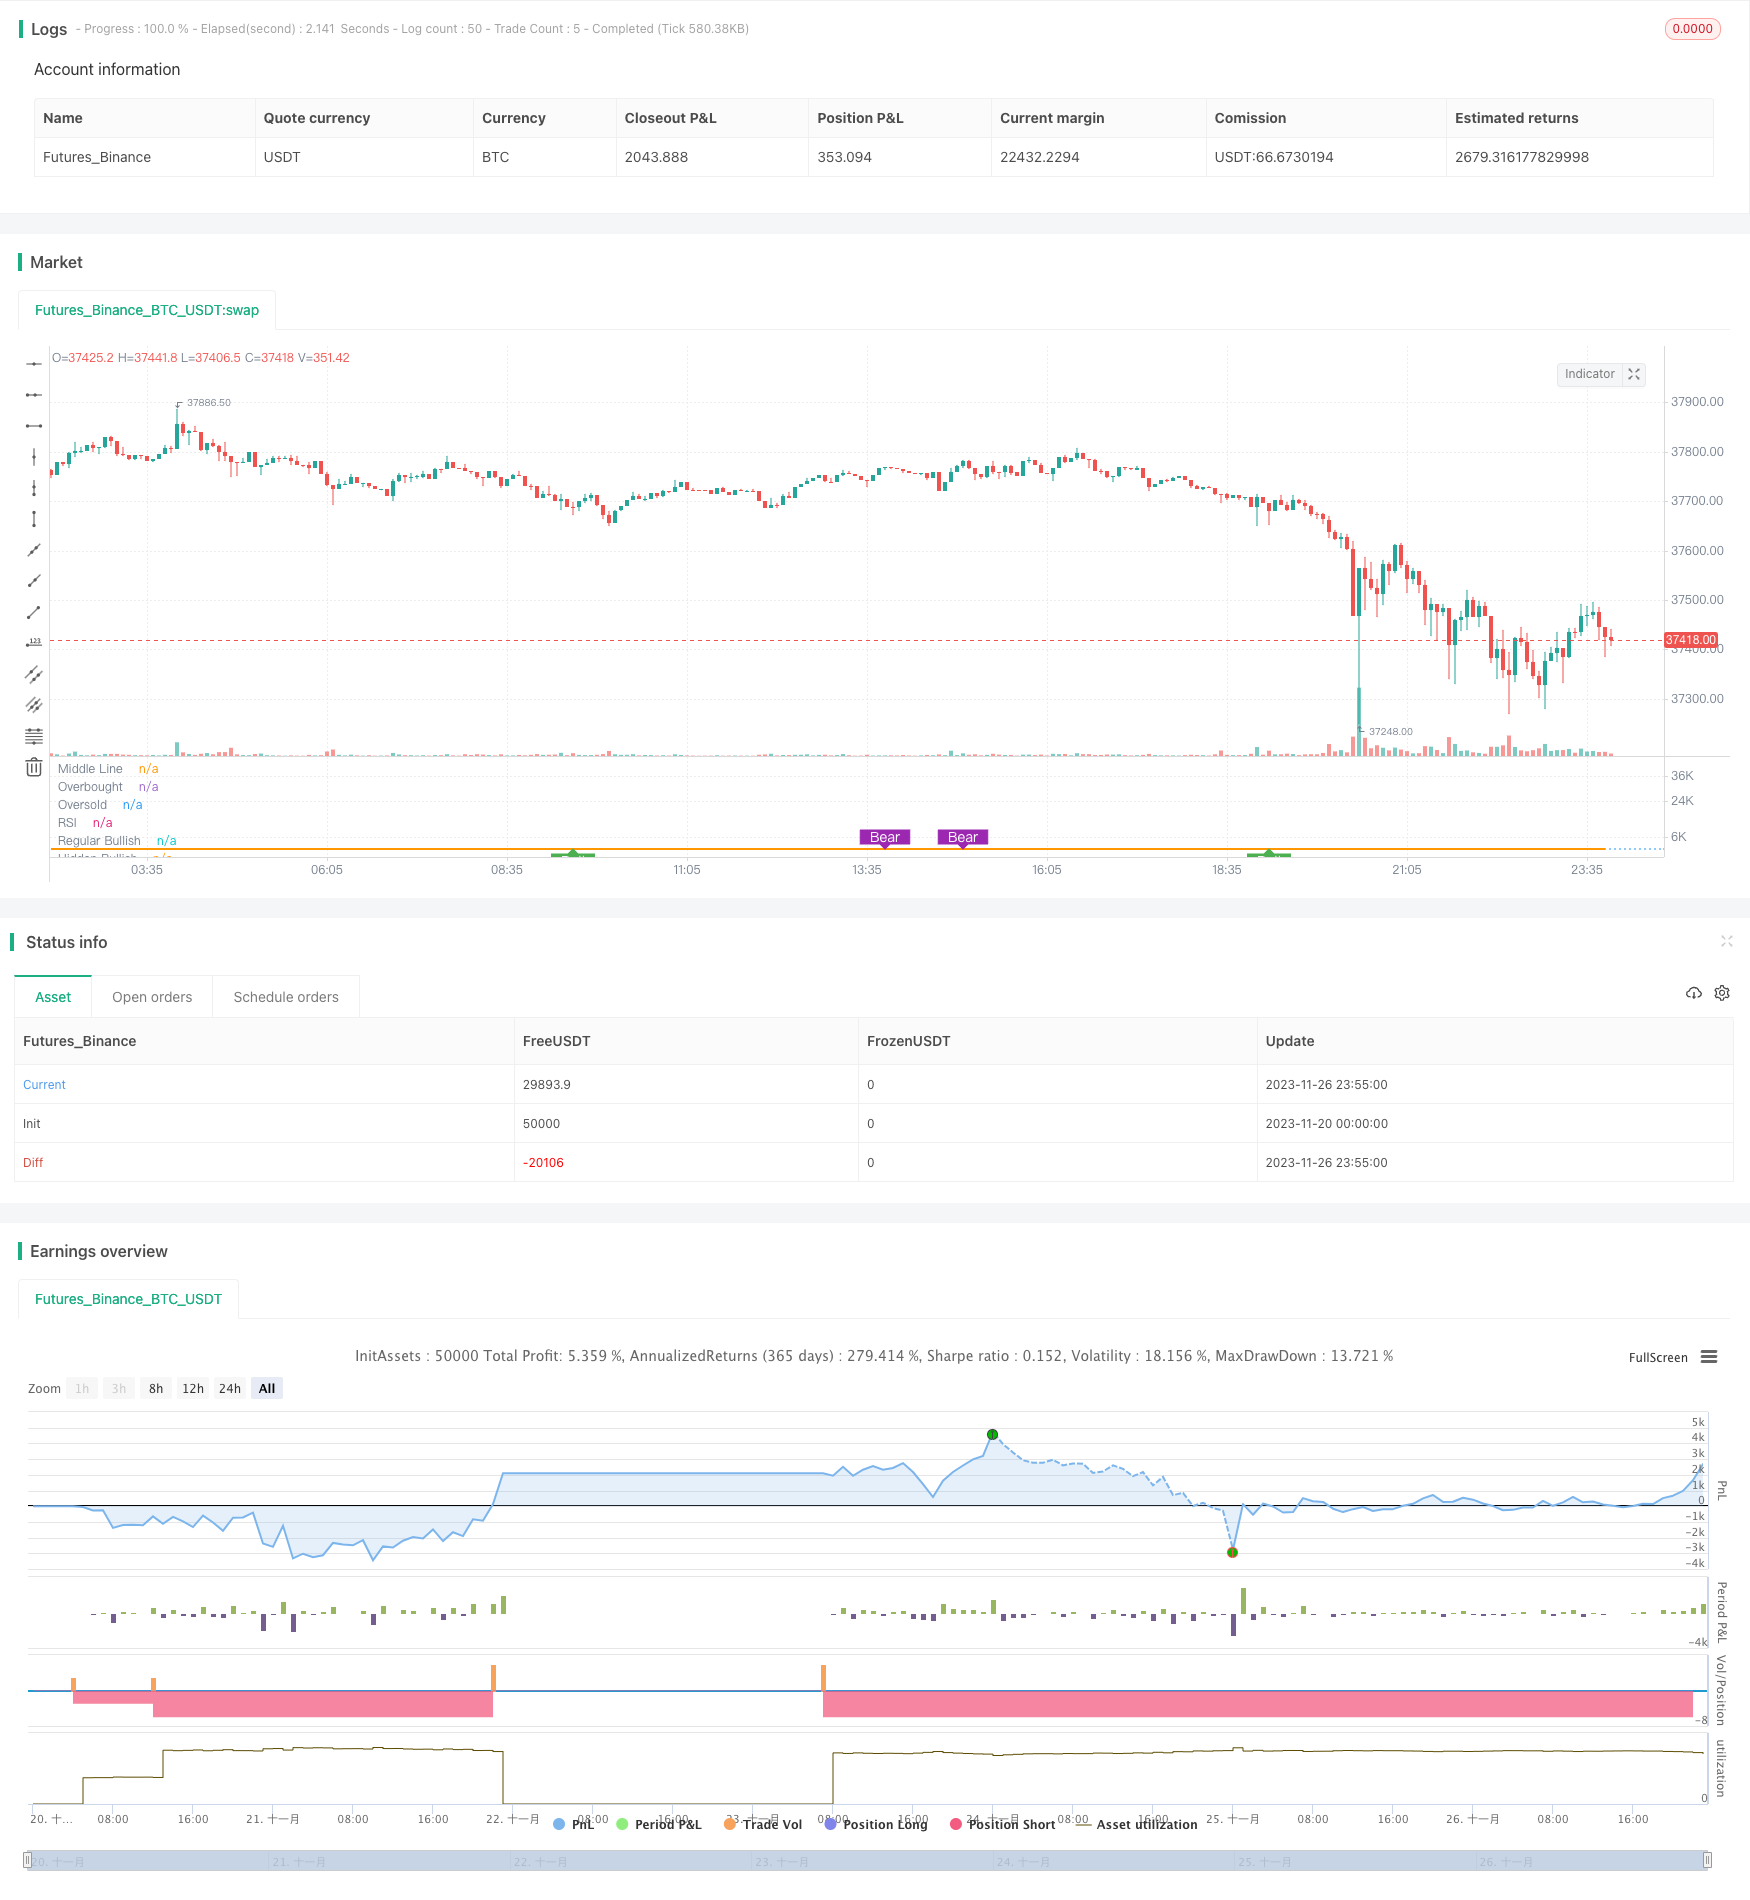
Overview
This strategy is called "Pivot-based RSI Divergence Strategy". It uses the divergence between RSI indicators at different cycles to determine entry and exit points, and adds long-term RSI as a filter condition to improve the stability of the strategy.
Strategy Logic
The strategy mainly judges the opportunity to buy when there is a "hidden bullish divergence" or "regular bullish divergence" between the short-term RSI (such as 5-day RSI) and price; and to sell when there is a "hidden bearish divergence" or "regular bearish divergence".
A "regular bullish divergence" means that the price makes a new low while the RSI does not make a new low; a "hidden bullish divergence" is the opposite, the price does not make a new low while the RSI makes a new low. The "new lows" and "new highs" referred to in both definitions are relative to historical extremes over a certain rolling window.
In addition, the strategy also introduces long-term RSI (such as 50-day RSI) as a filter condition. It only considers buy signals when the long RSI is greater than 50; and considers stop loss or take profit exit when the long RSI is less than 30.
Advantages
The biggest advantage of this strategy is that it utilizes both the RSI divergence signals on the short-term and the filter of long-term RSI, which can avoid being trapped and missing trends to some extent. Specifically, it has the following main advantages:
- The short-term RSI divergence signal can give early judgment of price reversal opportunities and timely capture turning points;
- The long-term RSI filter avoids going long blindly when the trend is uncertain;
- Multiple types of take profit methods and partial profit-taking help reduce risk;
- The pyramiding mechanism allows adding positions and further expands profit potential.
Risks
The strategy also has some risks to note:
- RSI divergences are not always valid and there could be false signals;
- Risks amplify after pyramiding. Losses could accelerate if the judgment is wrong;
- Improper take profit settings may also lead to premature profit-taking or insufficient profits.
Corresponding risk management measures include: reasonably setting stop loss/take profit conditions, controlling position sizing, partial profit-taking to smooth the equity curve, etc.
Optimization Directions
There is room for further optimization of the strategy:
- RSI parameters can be further optimized to find the best combination;
- Divergence signals of other indicators such as MACD and KD can be tested;
- Parameters can be specifically optimized on certain products (such as crude oil, precious metals, etc.) to improve adaptability.
Summary
This strategy combines the long/short RSI divergence signals of short-term and long-term to improve profitability while controlling risks. It reflects multiple principles in quantitative strategy design, including when to enter, when to exit, partial profit-taking, stop loss/take profit setting, etc. This is an exemplary RSI divergence strategy for reference.
Parameters
| Name | Default | What it controls |
|---|---|---|
| v_input_1 | 5 | RSI Period |
| v_input_2 | 50 | Long RSI Period |
| v_input_3_close | 0 | RSI Source: close | high | low | open | hl2 | hlc3 | hlcc4 | ohlc4 |
| v_input_4 | 3 | Pivot Lookback Right |
| v_input_5 | true | Pivot Lookback Left |
| v_input_6 | 75 | Take Profit at RSI Level |
| v_input_7 | false | Stop Loss%(if checked 8% rule applied) |
| v_input_8 | 60 | Max of Lookback Range |
| v_input_9 | 5 | Min of Lookback Range |
| v_input_10 | true | Plot Bullish |
| v_input_11 | true | Plot Hidden Bullish |
| v_input_12 | true | Plot Bearish |
| v_input_13 | false | Plot Hidden Bearish |
Source Pine Script
/*backtest
start: 2023-11-20 00:00:00
end: 2023-11-27 00:00:00
period: 5m
basePeriod: 1m
exchanges: [{"eid":"Futures_Binance","currency":"BTC_USDT"}]
*/

// This source code is subject to the terms of the Mozilla Public License 2.0 at https://mozilla.org/MPL/2.0/
// © mohanee

//@version=4

//GOOGL setting  5 ,50 close, 3 , 1  profitLevel at 75 and No stop Loss shows win rate 99.03 % profit factor 5830.152

strategy(title="RSI5_50 with Divergence", overlay=false,pyramiding=2, default_qty_type=strategy.fixed, default_qty_value=3,    initial_capital=10000, currency=currency.USD)

len = input(title="RSI Period", minval=1, defval=5)
longRSILen = input(title="Long RSI Period", minval=10, defval=50)
src = input(title="RSI Source", defval=close)
lbR = input(title="Pivot Lookback Right", defval=3)
lbL = input(title="Pivot Lookback Left", defval=1)
takeProfitRSILevel = input(title="Take Profit at RSI Level", minval=50, defval=75)
stopLoss = input(title="Stop Loss%(if checked 8% rule applied)", defval=false)

shortTermRSI = rsi(close,len)
longTermRSI = rsi(close,longRSILen)

rangeUpper = input(title="Max of Lookback Range", defval=60)
rangeLower = input(title="Min of Lookback Range", defval=5)
plotBull = input(title="Plot Bullish", defval=true)
plotHiddenBull = input(title="Plot Hidden Bullish", defval=true)
plotBear = input(title="Plot Bearish", defval=true)
plotHiddenBear = input(title="Plot Hidden Bearish", defval=false)


bearColor = color.purple
bullColor = color.green
hiddenBullColor = color.new(color.green, 80)
hiddenBearColor = color.new(color.red, 80)
textColor = color.white
noneColor = color.new(color.white, 100)


plot(shortTermRSI, title="RSI", linewidth=2, color=#8D1699)
plot(longTermRSI, title="longTermRSI", linewidth=2, color=color.orange)

hline(50, title="Middle Line", linestyle=hline.style_dotted)
obLevel = hline(70, title="Overbought", linestyle=hline.style_dotted)
osLevel = hline(30, title="Oversold", linestyle=hline.style_dotted)
fill(obLevel, osLevel, title="Background", color=longTermRSI >=50 ? color.green:color.purple, transp=65)  // longTermRSI >=50

plFound = na(pivotlow(shortTermRSI, lbL, lbR)) ? false : true
phFound = na(pivothigh(shortTermRSI, lbL, lbR)) ? false : true

_inRange(cond) =>
    bars = barssince(cond == true)
    rangeLower <= bars and bars <= rangeUpper

//------------------------------------------------------------------------------
// Regular Bullish

// shortTermRSI: Higher Low
oscHL = shortTermRSI[lbR] > valuewhen(plFound, shortTermRSI[lbR], 1) and _inRange(plFound[1])

// Price: Lower Low
priceLL = low[lbR] < valuewhen(plFound, low[lbR], 1)

bullCond = plotBull and priceLL and oscHL and plFound

plot(
	 plFound ? shortTermRSI[lbR] : na,
	 offset=-lbR,
	 title="Regular Bullish",
	 linewidth=2,
	 color=(bullCond ? bullColor : noneColor),
	 transp=0
	 )


plotshape(
	 bullCond ? shortTermRSI[lbR] : na,
	 offset=-lbR,
	 title="Regular Bullish Label",
	 text=" Bull ",
	 style=shape.labelup,
	 location=location.absolute,
	 color=bullColor,
	 textcolor=textColor,
	 transp=0
	 )

//------------------------------------------------------------------------------
// Hidden Bullish

// shortTermRSI: Lower Low
oscLL = shortTermRSI[lbR] < valuewhen(plFound, shortTermRSI[lbR], 1) and _inRange(plFound[1])

// Price: Higher Low
priceHL = low[lbR] > valuewhen(plFound, low[lbR], 1)

hiddenBullCond = plotHiddenBull and priceHL and oscLL and plFound

plot(
	 plFound ? shortTermRSI[lbR] : na,
	 offset=-lbR,
	 title="Hidden Bullish",
	 linewidth=2,
	 color=(hiddenBullCond ? hiddenBullColor : noneColor),
	 transp=0
	 )

plotshape(
	 hiddenBullCond ? shortTermRSI[lbR] : na,
	 offset=-lbR,
	 title="Hidden Bullish Label",
	 text=" H Bull ",
	 style=shape.labelup,
	 location=location.absolute,
	 color=bullColor,
	 textcolor=textColor,
	 transp=0
	 )

longCondition= longTermRSI >=50  and ( (bullCond or hiddenBullCond ) )  or  (strategy.position_size>0 and crossover(shortTermRSI,20) )
//last condition above is to leg in if you are already in the Long trade,


strategy.entry(id="RSIDivLE", long=true,  when=longCondition)


//------------------------------------------------------------------------------
// Regular Bearish

// shortTermRSI: Lower High
oscLH = shortTermRSI[lbR] < valuewhen(phFound, shortTermRSI[lbR], 1) and _inRange(phFound[1])

// Price: Higher High
priceHH = high[lbR] > valuewhen(phFound, high[lbR], 1)

bearCond = plotBear and priceHH and oscLH and phFound

plot(
	 phFound ? shortTermRSI[lbR] : na,
	 offset=-lbR,
	 title="Regular Bearish",
	 linewidth=2,
	 color=(bearCond ? bearColor : noneColor),
	 transp=0
	 )

plotshape(
	 bearCond ? shortTermRSI[lbR] : na,
	 offset=-lbR,
	 title="Regular Bearish Label",
	 text=" Bear ",
	 style=shape.labeldown,
	 location=location.absolute,
	 color=bearColor,
	 textcolor=textColor,
	 transp=0
	 )

//------------------------------------------------------------------------------
// Hidden Bearish

// shortTermRSI: Higher High
oscHH = shortTermRSI[lbR] > valuewhen(phFound, shortTermRSI[lbR], 1) and _inRange(phFound[1])

// Price: Lower High
priceLH = high[lbR] < valuewhen(phFound, high[lbR], 1)

hiddenBearCond = plotHiddenBear and priceLH and oscHH and phFound

plot(
	 phFound ? shortTermRSI[lbR] : na,
	 offset=-lbR,
	 title="Hidden Bearish",
	 linewidth=2,
	 color=(hiddenBearCond ? hiddenBearColor : noneColor),
	 transp=0
	 )

plotshape(
	 hiddenBearCond ? shortTermRSI[lbR] : na,
	 offset=-lbR,
	 title="Hidden Bearish Label",
	 text=" H Bear ",
	 style=shape.labeldown,
	 location=location.absolute,
	 color=bearColor,
	 textcolor=textColor,
	 transp=0
	 )


//calculate stop Loss
stopLossVal = stopLoss==true ? ( strategy.position_avg_price -  (strategy.position_avg_price*0.08) ) : 0

//partial profit
strategy.close(id="RSIDivLE", comment="TP1", qty=strategy.position_size*3/4, when=strategy.position_size>0 and (longTermRSI>=takeProfitRSILevel or crossover(longTermRSI,90)))
strategy.close(id="RSIDivLE",comment="TP2",   qty=strategy.position_size*3/4 , when=crossover(longTermRSI,70))
strategy.close(id="RSIDivLE",comment="TP3",   qty=strategy.position_size/2, when=crossover(longTermRSI,65))
strategy.close(id="RSIDivLE",comment="TP4",   qty=strategy.position_size/2 , when=crossover(longTermRSI,60))

//close the whole position when stoploss hits or longTermRSI goes below 30
strategy.close(id="RSIDivLE",comment="Exit",    when=crossunder(longTermRSI,30) or close<stopLossVal)
Published by ChaoZhang on the FMZ strategy square · last modified 2023-11-28. Collected in the Quant Trading Vault. Unvalidated research: re-test with your own data and costs before trusting it.
Build this with AgenKit
A spec is not a trading system. Paste this into your coding agent and AgenKit runs a specialist team — architecture, test-first build, risk gates, review — with paper trading on by default.
/agenkit build a production-grade trading bot with a backtest engine, risk controls and paper trading by default from strategies/Pivot-based-RSI-Divergence-Strategy.md- npx agenkit install engineering-kit in your project
- Paste the command into your agent and approve each phase
- Get tests, backtest, risk controls and a paper-trading switch
Understand it first
Before you run this, read the lesson behind the idea and how to backtest it honestly. Specs like this one are the survivors of an unknown number of trials; deflate their results accordingly.
Related specs
- Dynamic MACD and Ichimoku Cloud Trading StrategyPine Script · Mean reversion · 1h
- Quantitative Trading Strategy Based on Bollinger Bands and RSIPine Script · Mean reversion · 1h
- Trend Reversal Momentum Indicators Crossover Tracking StrategyPine Script · Mean reversion · 1h
- Multi Timeframe Gold Reversal Tracking StrategyPine Script · Mean reversion · 2h
- MACD RSI and EMA StrategyPine Script · Mean reversion · 1d
- A Combined RSI Strategy with Moving Average and MACDPine Script · Mean reversion · 1d