Strategy vault / Trend following
Pivot Based Trailing Maxima Minima
This indicator returns trailing maximums/minimums and their average resetting at the occurrence of a pivot point high/low, thus allowing the highlighting of past and current support and resistance levels. Settings…
This indicator returns trailing maximums/minimums and their average resetting at the occurrence of a pivot point high/low, thus allowing the highlighting of past and current support and resistance levels.
Settings
Length: Determines the pivot high/low lookback, with higher values allowing to detect longer term tops and bottoms.
Usage
snapshot
The indicator can highlight points of support and resistances - these are points where price bounced of the average line. These points can eventually be used to draw trendlines .
snapshot
The trailing maximum/minimum and their average extends to the most recent bar, allowing real time applications of the indicator.
Additionally, users can easily analyze past trends and determine their type by observing the trailing maximum/minimum behavior. For example, trailing maximums/minimums not making new higher high/lower low would indicate a ranging market.
snapshot
The frequency of new higher high/lower low can also help determine how bullish / bearish a trend was.
backtest
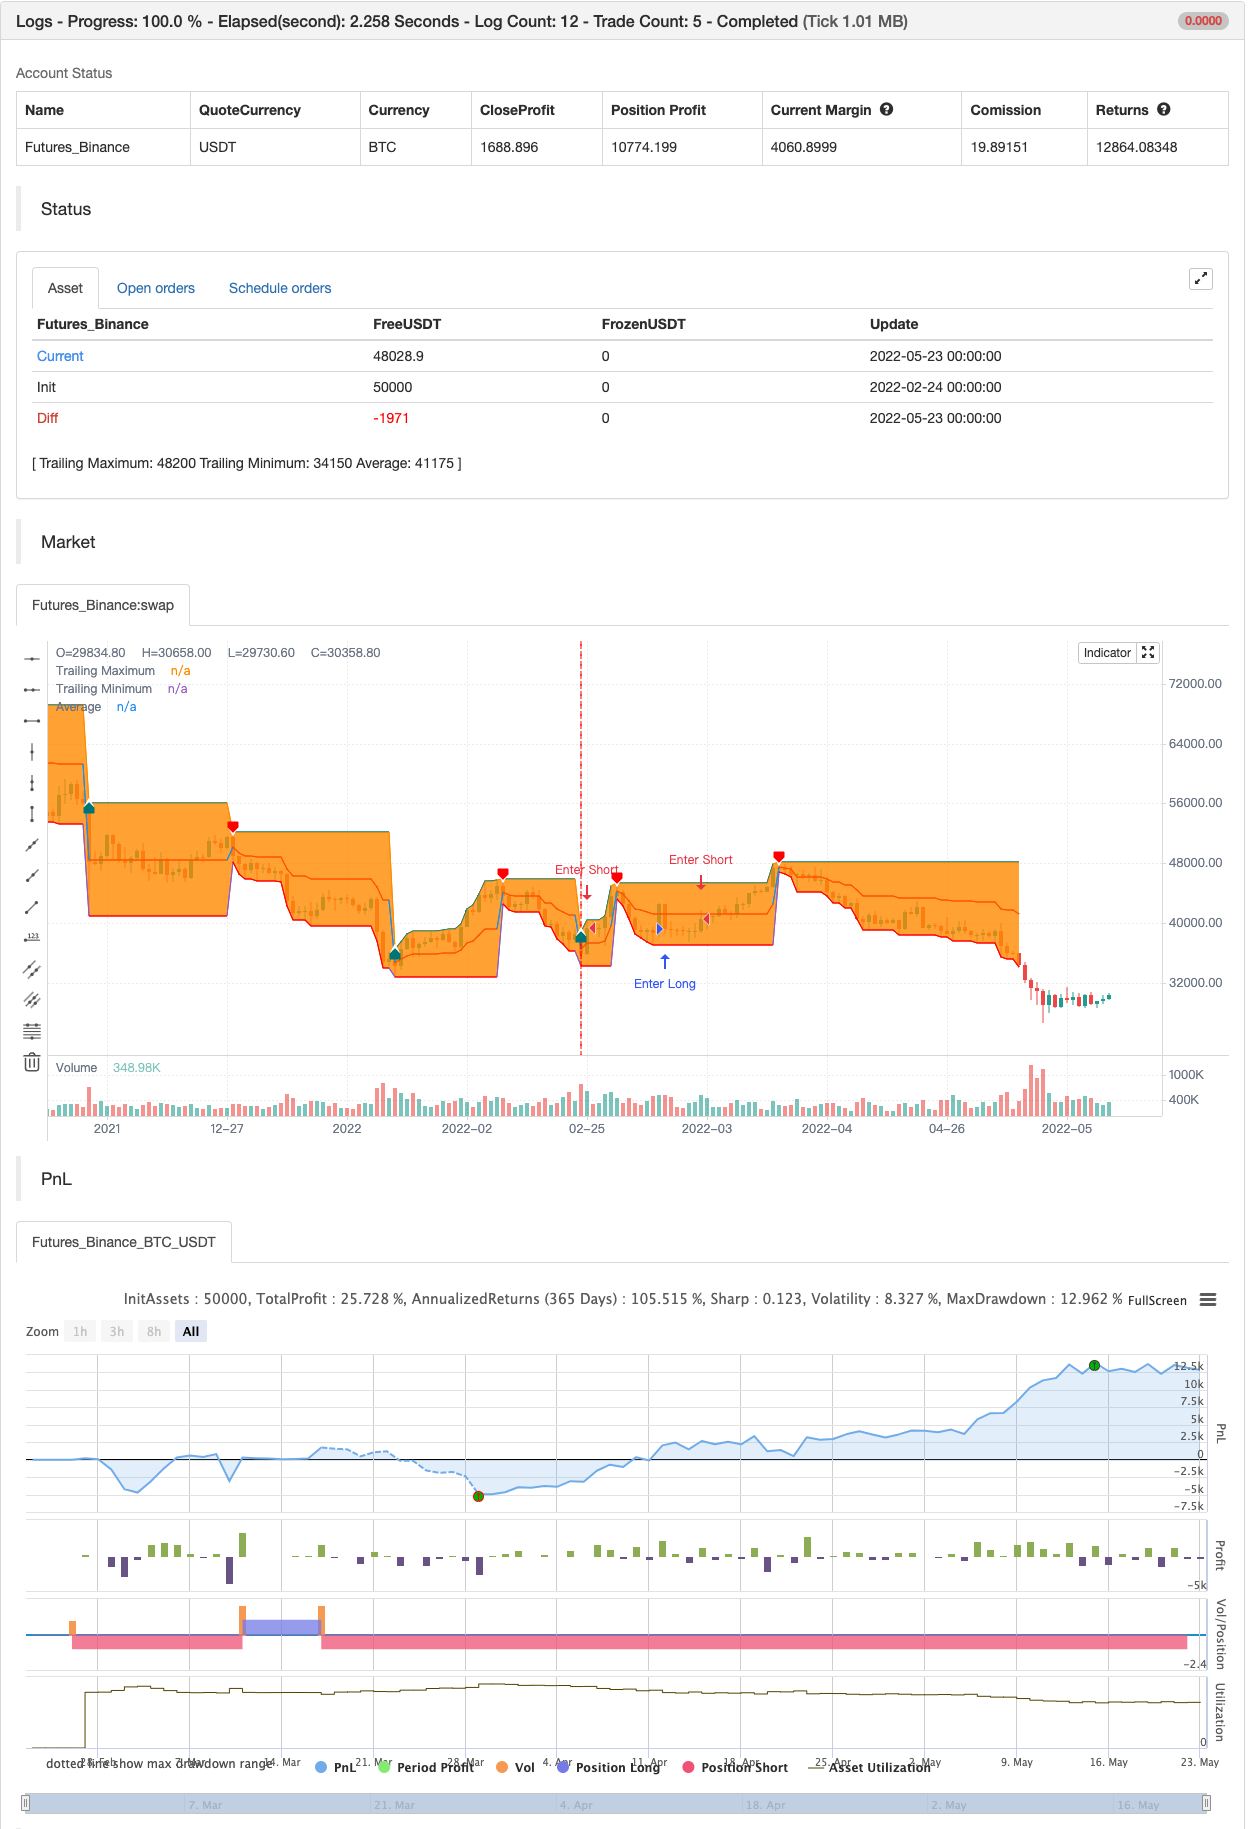
Parameters
| Name | Default | What it controls |
|---|---|---|
| v_input_int_1 | 14 | length |
| v_input_color_1 | teal | (?Style)Trailing Maximum Color |
| v_input_color_2 | red | Trailing Minimum Color |
| v_input_color_3 | #ff5d00 | Trailing Maximum Color |
| v_input_color_4 | teal | Uptrend Area |
| v_input_color_5 | red | Downtrend Area |
Source Pine Script
/*backtest
start: 2022-02-24 00:00:00
end: 2022-05-23 23:59:00
period: 1d
basePeriod: 1h
exchanges: [{"eid":"Futures_Binance","currency":"BTC_USDT"}]
*/

// This work is licensed under a Attribution-NonCommercial-ShareAlike 4.0 International (CC BY-NC-SA 4.0) https://creativecommons.org/licenses/by-nc-sa/4.0/
// © LuxAlgo

//@version=5
indicator("Pivot Based Trailing Maxima & Minima [LUX]",overlay=true,max_bars_back=500,max_lines_count=500)
length = input.int(14,minval=2,maxval=500)

max_color = input.color(color.teal,'Trailing Maximum Color',group='Style')
min_color = input.color(color.red,'Trailing Minimum Color',group='Style')
avg_color = input.color(#ff5d00,'Trailing Maximum Color',group='Style')

bull_fill = input.color(color.new(color.teal,80),'Uptrend Area',group='Style')
bear_fill = input.color(color.new(color.red,80),'Downtrend Area',group='Style')
//----
var max = 0.
var min = 0.

ph = ta.pivothigh(length,length)
pl = ta.pivotlow(length,length)

if ph or pl
    max := high[length]
    min := low[length]

max := math.max(high[length],max)
min := math.min(low[length],min)

avg = math.avg(max,min)

//----
plot1 = plot(max,'Trailing Maximum',ph or pl ? na : max_color,1,plot.style_linebr,offset=-length)
plot2 = plot(min,'Trailing Minimum',ph or pl ? na : min_color,1,plot.style_linebr,offset=-length)

fill_css = fixnan(ph ? bear_fill : pl ? bull_fill : na)
fill(plot1,plot2,ph or pl ? na : fill_css)

plot(avg,'Average',ph or pl ? na : avg_color,1,plot.style_linebr,offset=-length)

plotshape(pl ? pl : na,"Pivot High",shape.labelup,location.absolute,max_color,-length,text="▲",textcolor=color.white,size=size.tiny)
plotshape(ph ? ph : na,"Pivot Low",shape.labeldown,location.absolute,min_color,-length,text="▼",textcolor=color.white,size=size.tiny)

// //----
// n = bar_index

// max_prev = max
// min_prev = min
// avg_prev = avg
// max2 = max
// min2 = min

// if barstate.islast
//     for line_object in line.all
//         line.delete(line_object)

//     for i = 0 to length-1
//         max2 := math.max(high[length-1-i],max_prev)
//         min2 := math.min(low[length-1-i],min_prev)
//         avg2 = math.avg(max2,min2)

//         line1 = line.new(n-(length-i),max_prev,n-(length-1-i),max2,color=max_color)
//         line2 = line.new(n-(length-i),min_prev,n-(length-1-i),min2,color=min_color)
//         linefill.new(line1,line2,color.new(fill_css,80))

//         line.new(n-(length-i),avg_prev,n-(length-1-i),avg2,color=avg_color)

//         max_prev := max2
//         min_prev := min2
//         avg_prev := avg2


if pl
    strategy.entry("Enter Long", strategy.long)
else if ph
strategy.entry("Enter Short", strategy.short)Published by ChaoZhang on the FMZ strategy square · last modified 2022-05-25. Collected in the Quant Trading Vault. Unvalidated research: re-test with your own data and costs before trusting it.
Build this with AgenKit
A spec is not a trading system. Paste this into your coding agent and AgenKit runs a specialist team — architecture, test-first build, risk gates, review — with paper trading on by default.
/agenkit build a production-grade trading bot with a backtest engine, risk controls and paper trading by default from strategies/Pivot-Based-Trailing-Maxima-Minima.md- npx agenkit install engineering-kit in your project
- Paste the command into your agent and approve each phase
- Get tests, backtest, risk controls and a paper-trading switch
Understand it first
Before you run this, read the lesson behind the idea and how to backtest it honestly. Specs like this one are the survivors of an unknown number of trials; deflate their results accordingly.
Related specs
- Adaptive Bollinger Bands Trend Tracking StrategyPine Script · Trend following · 1h
- Automated Fibonacci Retracement Trading System StrategyPine Script · Trend following · 1d
- Bollinger Bands Precise Crossover Quantitative StrategyPine Script · Trend following · 1h
- Comprehensive Trading System Combining SMA Crossover Strategy with Fair Value Gap PullbackPine Script · Trend following · 1d
- Dual EMA Crossover StrategyPine Script · Trend following · 1d
- Dual Hull Moving Average Trading StrategyPine Script · Trend following · 1d