Strategy vault / Trend following
Pivot SuperTrend Strategy Across Multiple Timeframes
This strategy combines the Pivot Points indicator and Average True Range Bands to implement a trend tracking system across multiple timeframes. It can capture trends over intermediate cycles while using Pivot Points…
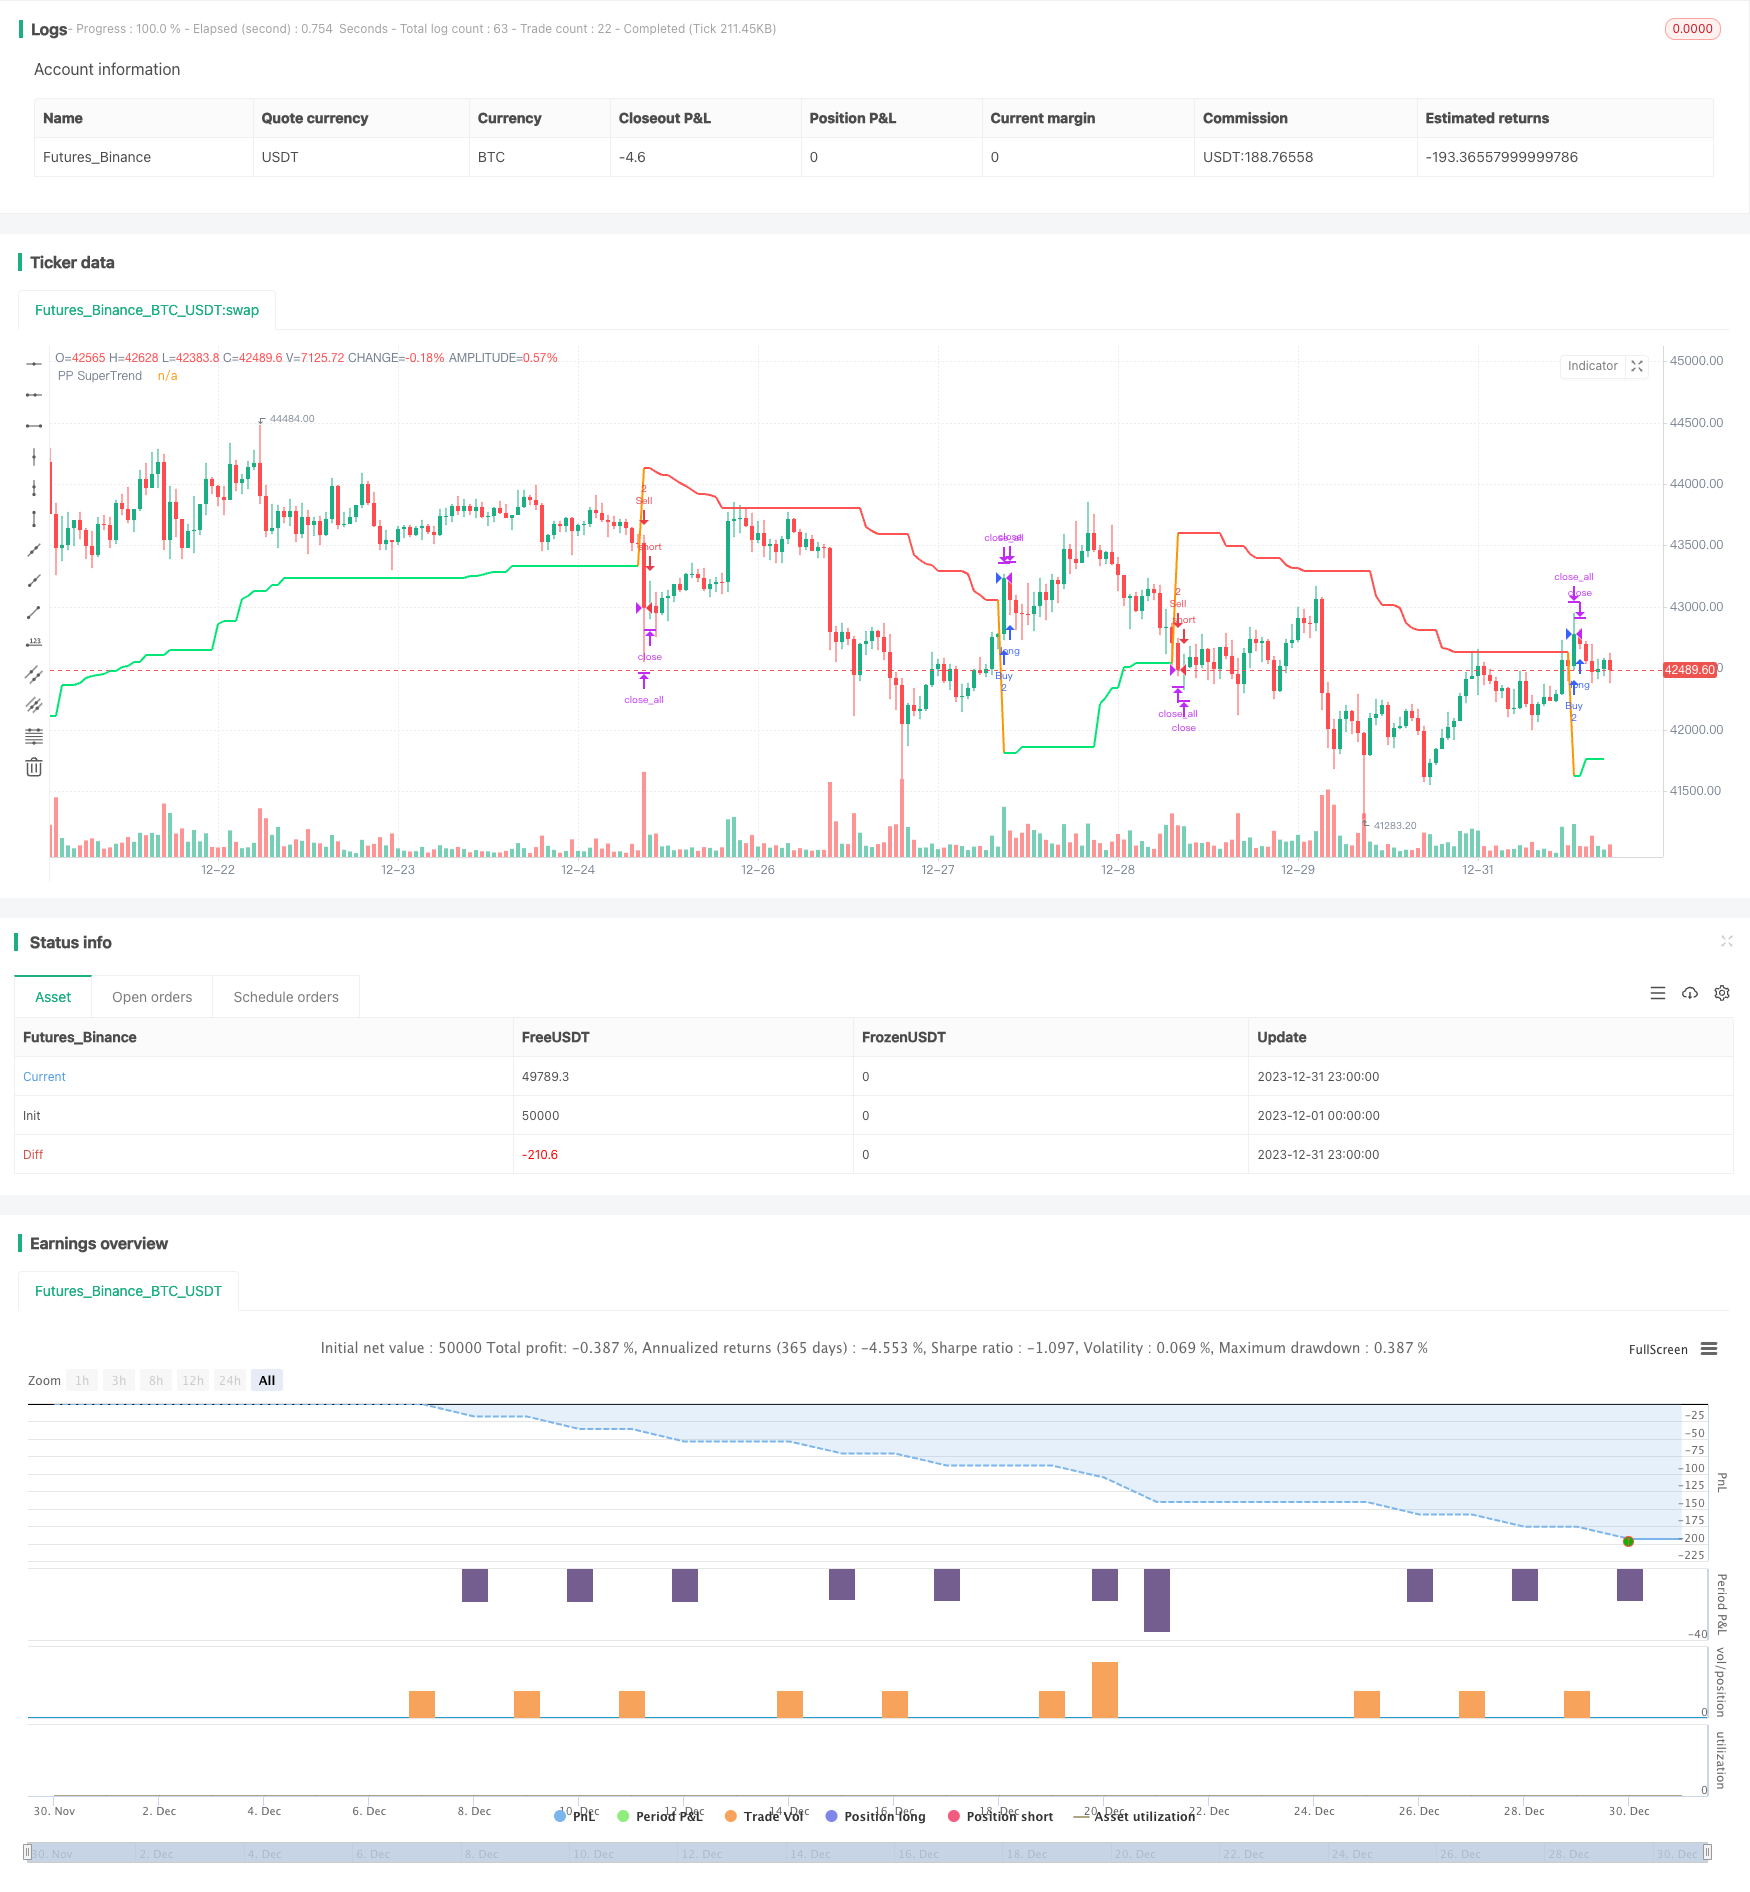
Overview
This strategy combines the Pivot Points indicator and Average True Range Bands to implement a trend tracking system across multiple timeframes. It can capture trends over intermediate cycles while using Pivot Points to determine long-term support and resistance for better entry and exit.
Strategy Logic
This strategy is mainly based on two indicators:
Pivot Points: Calculate the average of highest, lowest and closing prices over a certain period to determine upper and lower pivot points. Pivot points can serve as key support and resistance areas.
Average True Range Bands: Calculate the average true range over a certain period, and move the middle band up and down to form a channel. The upper and lower bands can serve as dynamic stop loss lines.
The specific trading logic is:
When the price breaks through the Average True Range channel, take long or short positions along the breakout direction. When the price returns into the channel, close positions. Also, when the price breaks through the upper pivot point, take long stance; when the price breaks through the lower pivot point, take short stance.
The strategy also introduces the pivot middle line concept. When take profit breaks the middle line, it's possible to close half position to lock in some profit and control risk.
Advantage Analysis
The strategy has the following advantages:
Multiple timeframe design. Long and intermediate cycles determine major trends while short cycles determine specific entries.
The pivot middle line provides an option to close half position, locking in some profit while ensuring winning trades.
Average True Range Bands provide clear stop loss levels.
The strategy has few parameters, easy to optimize for best parameter combinations.
It maximally avoids the risk of false breakouts.
Risk Analysis
The strategy also has some risks:
Larger stop loss risks during high market volatility.
The middle line may frequently trigger stop loss during market consolidations.
Improper parameter selections may result in too few or too frequent trades.
Recent pivot point breaks may turn out to be false breaks.
Optimization Directions
The strategy can be optimized from the following aspects:
Combine more filters like volume and Bollinger Bands to avoid false signals.
Optimize periods of Pivot Points and ATR to find best parameter combinations.
Set a buffer zone around the middle line to avoid frequent triggers.
Add proper trend filters to ensure operating along major trends.
Conclusion
In general, this is a very practical trend tracking strategy. It solves the common stop loss difficulties of trend systems and achieves risk-controllable trend trading. It is a highly recommendable strategy. With proper optimizations and improvements, its performance can be further enhanced.
Parameters
| Name | Default | What it controls |
|---|---|---|
| v_input_1 | 2 | Pivot Point Period |
| v_input_2 | 3 | ATR Factor |
| v_input_3 | 10 | ATR Period |
| v_input_4 | false | Use Center Line to Close Entry for 50% |
| v_input_5 | false | Show Pivot Points |
| v_input_6 | false | Show PP Center Line |
Source Pine Script
/*backtest
start: 2023-12-01 00:00:00
end: 2023-12-31 23:59:59
period: 1h
basePeriod: 15m
exchanges: [{"eid":"Futures_Binance","currency":"BTC_USDT"}]
*/

// This source code is subject to the terms of the Mozilla Public License 2.0 at https://mozilla.org/MPL/2.0/
// © LonesomeTheBlue

//@version=4
strategy("Pivot Point SuperTrend [Backtest]", overlay = true)
prd = input(defval = 2, title="Pivot Point Period", minval = 1, maxval = 50)
Factor=input(defval = 3, title = "ATR Factor", minval = 1, step = 0.1)
Pd=input(defval = 10, title = "ATR Period", minval=1)
usecenter = input(defval = false, title="Use Center Line to Close Entry for 50%")
showpivot = input(defval = false, title="Show Pivot Points")
showcl = input(defval = false, title="Show PP Center Line")


float ph = na
float pl = na
ph := pivothigh(prd, prd)
pl := pivotlow(prd, prd)

plotshape(ph and showpivot, text="H",  style=shape.labeldown, color=na, textcolor=color.red, location=location.abovebar, transp=0, offset = -prd)
plotshape(pl and showpivot, text="L",  style=shape.labeldown, color=na, textcolor=color.lime, location=location.belowbar, transp=0, offset = -prd)

float center = na
center := center[1]
float lastpp = ph ? ph : pl ? pl : na
if lastpp
    if na(center)
        center := lastpp
    else
        center := (center * 2 + lastpp) / 3

Up = center - (Factor * atr(Pd))
Dn = center + (Factor * atr(Pd))

float TUp = na
float TDown = na
Trend = 0
TUp := close[1] > TUp[1] ? max(Up, TUp[1]) : Up
TDown := close[1] < TDown[1] ? min(Dn, TDown[1]) : Dn
Trend := close > TDown[1] ? 1: close < TUp[1]? -1: nz(Trend[1], 1)
Trailingsl = Trend == 1 ? TUp : TDown

linecolor = Trend == 1 and nz(Trend[1]) == 1 ? color.lime : Trend == -1 and nz(Trend[1]) == -1 ? color.red : na
plot(Trailingsl, color = linecolor ,  linewidth = 2, title = "PP SuperTrend")

plot(showcl ? center : na, color = showcl ? center < hl2 ? color.blue : color.red : na, transp = 0)

bsignal = Trend == 1 and Trend[1] == -1
ssignal = Trend == -1 and Trend[1] == 1

if bsignal
    strategy.entry("Buy", true, 2, comment = "Buy")
if ssignal
    strategy.entry("Sell", false, 2, comment = "Sell")

if strategy.position_size == 2 and center > hl2 and usecenter
    strategy.close("Buy", qty_percent = 50, comment = "close buy entry for 50%")
if strategy.position_size == -2 and center < hl2 and usecenter
    strategy.close("Sell", qty_percent = 50, comment = "close sell entry for 50%")

if change(Trend)
strategy.close_all()Published by ChaoZhang on the FMZ strategy square · last modified 2024-01-31. Collected in the Quant Trading Vault. Unvalidated research: re-test with your own data and costs before trusting it.
Build this with AgenKit
A spec is not a trading system. Paste this into your coding agent and AgenKit runs a specialist team — architecture, test-first build, risk gates, review — with paper trading on by default.
/agenkit build a production-grade trading bot with a backtest engine, risk controls and paper trading by default from strategies/Pivot-SuperTrend-Strategy-Across-Multiple-Timeframes.md- npx agenkit install engineering-kit in your project
- Paste the command into your agent and approve each phase
- Get tests, backtest, risk controls and a paper-trading switch
Understand it first
Before you run this, read the lesson behind the idea and how to backtest it honestly. Specs like this one are the survivors of an unknown number of trials; deflate their results accordingly.
Related specs
- Multitimeframe Trend Hunter StrategyPine Script · Trend following · 1h
- Supertrend Bollinger Bands StrategyPine Script · Trend following · 1d
- Multi Indicator Dynamic Trend Following Strategy Based on EMA and SMAPine Script · Trend following · 1d
- SuperTrend Dynamic Take Profit with Time Filter Strategy Volatility Adaptive Quantitative Trading SystemPine Script · Trend following · 2h
- Trend Following Strategy Based on PMax IndicatorPine Script · Trend following · 5m
- Trend Tracking and Short term Trading Strategy Based on ADX IndicatorPine Script · Trend following · 1d