Strategy vault / Mean reversion
PowerZone Trading Strategy
The PowerZone Trading Strategy is an innovative automated trading approach focused on capturing strong price movements in the market. The strategy provides clear entry and exit signals by identifying specific price…
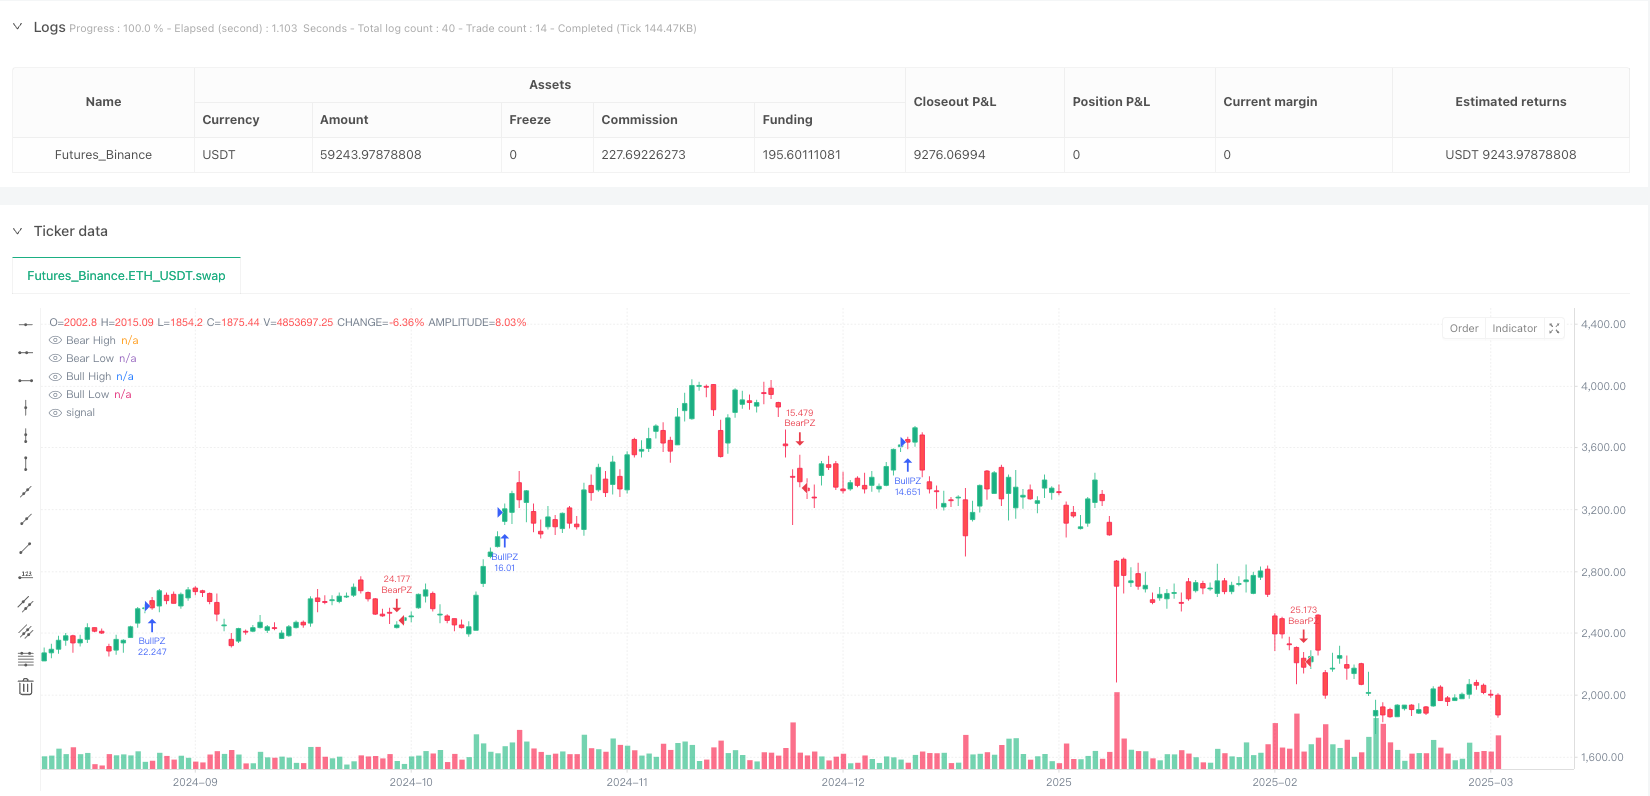
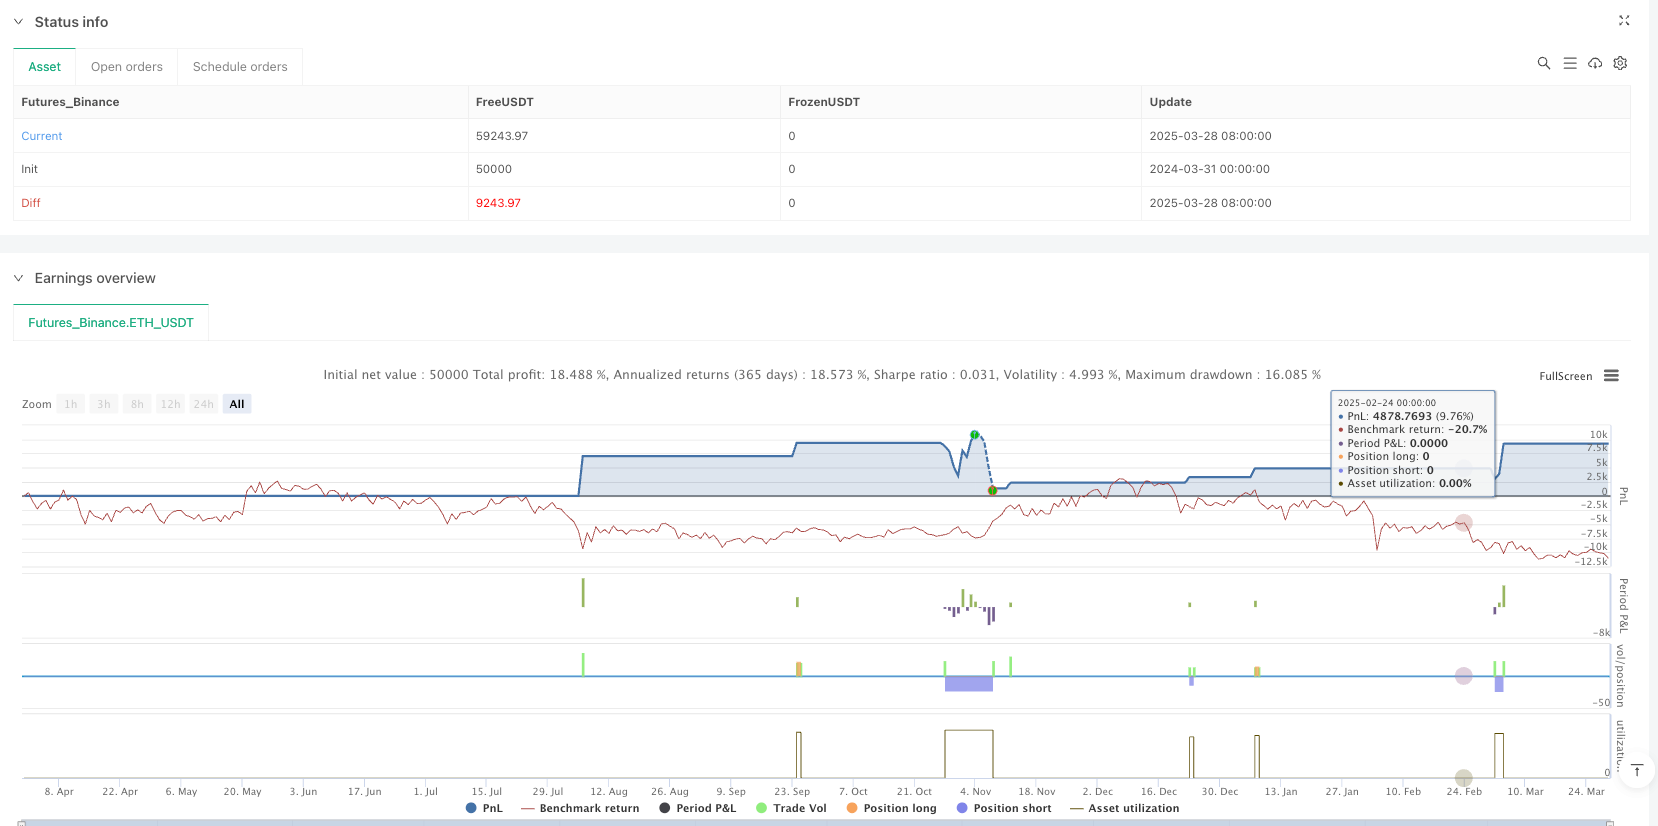
Overview
The PowerZone Trading Strategy is an innovative automated trading approach focused on capturing strong price movements in the market. The strategy provides clear entry and exit signals by identifying specific price areas called "PowerZones" while incorporating built-in risk management mechanisms.
Strategy Principles
The core of the strategy lies in identifying two key PowerZone types:
Bullish PowerZone:
- Starts with an initial bearish candle (close below open)
- Followed by consecutive rising candles (default 5)
- Total price movement exceeding a preset threshold (default 2%)
Bearish PowerZone:
- Starts with an initial bullish candle (close above open)
- Followed by consecutive declining candles
- Total price movement exceeding a preset threshold
Strategy Advantages
- Automated trend reversal point identification
- Flexible parameter customization
- Clear visual representation
- Automatic risk management (take profit/stop loss)
- Adaptable to various market environments
- Concise and easy-to-understand code
Strategy Risks
- Improper parameter settings may lead to over-trading
- Potential false signals in ranging markets
- Fixed position sizing might increase single trade loss risk
- Lack of complex filtering mechanisms
- Does not consider broader market trends and cycles
Strategy Optimization Directions
Introduce additional filtering conditions
- Integrate trend indicators (like EMA)
- Incorporate momentum indicators (like RSI)
- Add volume confirmation mechanisms
Dynamic position management
- Adjust position size based on market volatility
- Implement risk percentage position control
Multi-timeframe verification
- Cross-validate signals across different time periods
- Improve signal reliability
Conclusion
The PowerZone Trading Strategy provides traders with a structured trading method by systematically identifying price strength zones. Its core advantages lie in automation, visualization, and flexibility, but careful parameter adjustment and continuous risk management optimization are essential.
Source Pine Script
/*backtest
start: 2024-03-31 00:00:00
end: 2025-03-29 08:00:00
period: 1d
basePeriod: 1d
exchanges: [{"eid":"Futures_Binance","currency":"ETH_USDT"}]
*/

// This Pine Script® code is subject to the terms of the Mozilla Public License 2.0 at https://mozilla.org/MPL/2.0/
// © tradingbauhaus

//@version=6
strategy("PowerZone Trading Strategy", overlay=true, shorttitle="PZStrat", default_qty_type=strategy.percent_of_equity, default_qty_value=100)

// Inputs
periods    = input.int(5, title="Periods for PowerZone", minval=1)
threshold  = input.float(0.0, title="Min % Move for PowerZone", step=0.1, minval=0.0)
usewicks   = input.bool(false, title="Use Full Range [High/Low]?")

tp_factor  = input.float(1.5, title="Take Profit Factor", step=0.1, minval=0.5)
sl_factor  = input.float(1.0, title="Stop Loss Factor", step=0.1, minval=0.5)

colors     = input.string("DARK", title="Color Scheme", options=["DARK", "BRIGHT"])
showbull   = input.bool(true, title="Show Bullish Channel?")
showbear   = input.bool(true, title="Show Bearish Channel?")
showdocu   = input.bool(false, title="Show Documentation?")
info_pan   = input.bool(true, title="Show Info Panel?")

// Core Variables
bullcolor = colors == "DARK" ? color.white : color.green
bearcolor = colors == "DARK" ? color.blue  : color.red
ob_period = periods + 1

// PowerZone Detection
absmove = math.abs((close[ob_period] - close[1]) / close[ob_period]) * 100
relmove = absmove >= threshold

// Bullish PowerZone
bullishPZ = close[ob_period] < open[ob_period]
upcandles = 0
for i = 0 to periods - 1
    upcandles := upcandles + (close[i + 1] > open[i + 1] ? 1 : 0)
PZ_bull = bullishPZ and upcandles == periods and relmove
PZ_bull_high = PZ_bull ? (usewicks ? high[ob_period] : open[ob_period]) : na
PZ_bull_low  = PZ_bull ? low[ob_period] : na
PZ_bull_avg  = PZ_bull ? (PZ_bull_high + PZ_bull_low) / 2 : na

// Bearish PowerZone
bearishPZ = close[ob_period] > open[ob_period]
downcandles = 0
for i = 0 to periods - 1
    downcandles := downcandles + (close[i + 1] < open[i + 1] ? 1 : 0)
PZ_bear = bearishPZ and downcandles == periods and relmove
PZ_bear_high = PZ_bear ? high[ob_period] : na
PZ_bear_low  = PZ_bear ? (usewicks ? low[ob_period] : open[ob_period]) : na
PZ_bear_avg  = PZ_bear ? (PZ_bear_high + PZ_bear_low) / 2 : na

// Strategy Logic
var float bull_entry = na
var float bull_tp    = na
var float bull_sl    = na
var float bear_entry = na
var float bear_tp    = na
var float bear_sl    = na

if PZ_bull and close > PZ_bull_high and strategy.position_size == 0
    bull_entry := close
    bull_tp    := bull_entry + (PZ_bull_high - PZ_bull_low) * tp_factor
    bull_sl    := PZ_bull_low - (PZ_bull_high - PZ_bull_low) * sl_factor
    strategy.entry("BullPZ", strategy.long)
    strategy.exit("BullExit", "BullPZ", limit=bull_tp, stop=bull_sl)

if PZ_bear and close < PZ_bear_low and strategy.position_size == 0
    bear_entry := close
    bear_tp    := bear_entry - (PZ_bear_high - PZ_bear_low) * tp_factor
    bear_sl    := PZ_bear_high + (PZ_bear_high - PZ_bear_low) * sl_factor
    strategy.entry("BearPZ", strategy.short)
    strategy.exit("BearExit", "BearPZ", limit=bear_tp, stop=bear_sl)

// Visualization
plot(PZ_bull_high, title="Bull High", color=bullcolor, style=plot.style_linebr, linewidth=2, offset=-ob_period)
plot(PZ_bull_low, title="Bull Low", color=bullcolor, style=plot.style_linebr, linewidth=2, offset=-ob_period)
plot(PZ_bear_high, title="Bear High", color=bearcolor, style=plot.style_linebr, linewidth=2, offset=-ob_period)
plot(PZ_bear_low, title="Bear Low", color=bearcolor, style=plot.style_linebr, linewidth=2, offset=-ob_period)

// Alerts
alertcondition(PZ_bull and close > PZ_bull_high, title="Bullish Entry", message="Bullish PowerZone Breakout - LONG!")
alertcondition(PZ_bear and close < PZ_bear_low, title="Bearish Entry", message="Bearish PowerZone Breakdown - SHORT!")

// Info Panel
var label info_panel = na
if info_pan
    if not na(info_panel)
        label.delete(info_panel)
    panel_text = "POWERZONE STRATEGY\n" +
                 "Bull High: " + str.tostring(PZ_bull_high, "#.##") + " | TP: " + str.tostring(bull_tp, "#.##") + " | SL: " + str.tostring(bull_sl, "#.##") + "\n" +
                 "Bear High: " + str.tostring(PZ_bear_high, "#.##") + "\n" +
                 "Bear Low: " + str.tostring(PZ_bear_low, "#.##") + " | TP: " + str.tostring(bear_tp, "#.##") + " | SL: " + str.tostring(bear_sl, "#.##")
    info_panel := label.new(x=bar_index, y=high, text=panel_text, xloc=xloc.bar_index, yloc=yloc.abovebar, color=color.gray, textcolor=color.white, size=size.normal)

// Documentation
if showdocu
label.new(x=bar_index, y=low, text="PowerZone Strategy\nLONG on breakout above Bull PZ High\nSHORT on breakdown below Bear PZ Low", xloc=xloc.bar_index, yloc=yloc.belowbar, color=color.gray, textcolor=color.white, size=size.tiny)Published by ianzeng123 on the FMZ strategy square · last modified 2025-03-31. Collected in the Quant Trading Vault. Unvalidated research: re-test with your own data and costs before trusting it.
Build this with AgenKit
A spec is not a trading system. Paste this into your coding agent and AgenKit runs a specialist team — architecture, test-first build, risk gates, review — with paper trading on by default.
/agenkit build a production-grade trading bot with a backtest engine, risk controls and paper trading by default from strategies/PowerZone-Trading-Strategy.md- npx agenkit install engineering-kit in your project
- Paste the command into your agent and approve each phase
- Get tests, backtest, risk controls and a paper-trading switch
Understand it first
Before you run this, read the lesson behind the idea and how to backtest it honestly. Specs like this one are the survivors of an unknown number of trials; deflate their results accordingly.
Related specs
- Advanced Momentum EMA Trend Following with RSI Overbought Oversold Trading StrategyPine Script · Mean reversion · 1d
- Dynamic Adaptive Multi Timeframe Trend Following and Range Reversal Hybrid StrategyPine Script · Mean reversion · 2d
- Fast RSI Reversal Trading StrategyPine Script · Mean reversion · 1h
- Multi EMA Trend Reversal Trading StrategyPine Script · Mean reversion · 1d
- Enhanced Multi Indicator Trend Reversal Intelligence StrategyPine Script · Mean reversion · 1d
- Multi Period EMA Trend Detection with RSI Overbought StrategyPine Script · Mean reversion · 4h