Price and Volume Breakout Buy Strategy
The "Price and Volume Breakout Buy Strategy" is a trading strategy designed to identify buying opportunities by detecting concurrent price and volume breakouts over a specified range of candlesticks. The strategy…
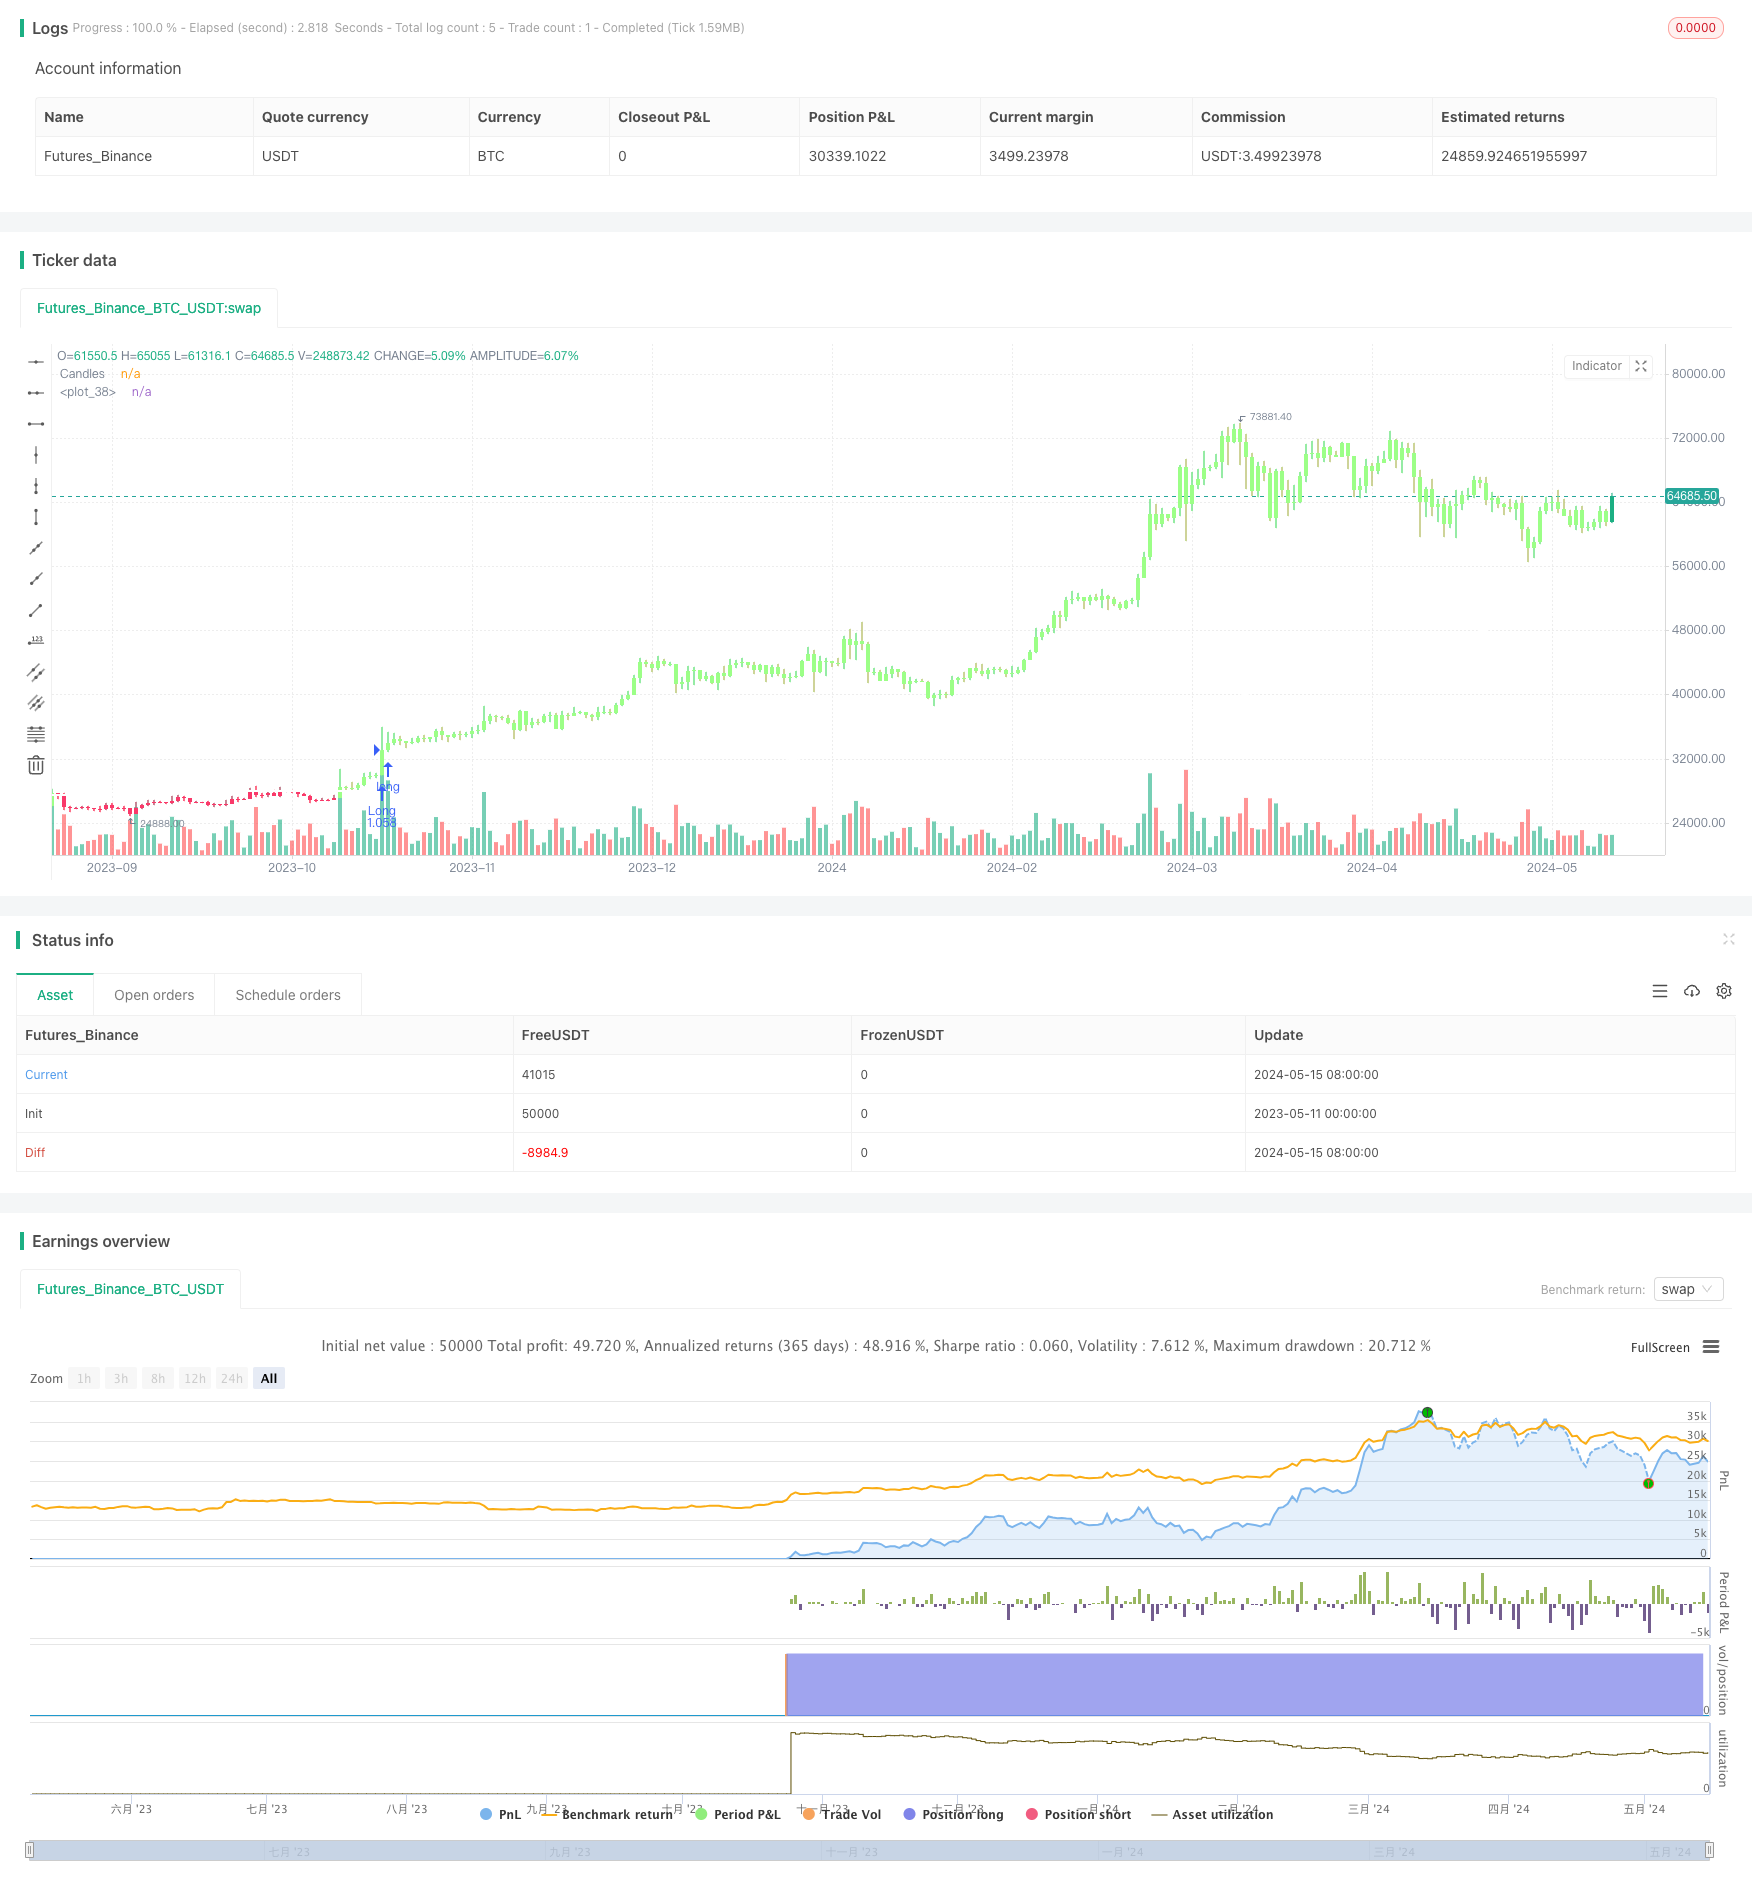
Overview
The "Price and Volume Breakout Buy Strategy" is a trading strategy designed to identify buying opportunities by detecting concurrent price and volume breakouts over a specified range of candlesticks. The strategy first takes the specific number of candlesticks as the examination window for both price and volume. These values are used as benchmarks to identify breakout conditions. A trade is initiated when both the closing price and the trading volume surpass the maximum values observed within the predetermined window. Price must be above a designated moving average, serving as the trend indicator, ensuring that all trades align with the prevailing market trend.
Strategy Principle
- Set the price breakout period and volume breakout period as the examination window.
- Get the highest price and lowest price within the price breakout period.
- Get the highest trading volume within the volume breakout period.
- If the closing price is higher than the highest price of the previous period, the trading volume is higher than the highest trading volume of the previous period, the closing price is higher than the simple moving average (SMA) of the trendline length, and there are currently no open trades, and the order direction is not set to short, then start going long.
- If the closing price is lower than the SMA of the trendline length for 5 consecutive days, close all long positions.
- If the closing price is lower than the lowest price of the previous period, the trading volume is higher than the highest trading volume of the previous period, the closing price is lower than the SMA of the trendline length, and there are currently no open trades, and the order direction is not set to long, then start going short.
- If the closing price is higher than the SMA of the trendline length for 5 consecutive days, close all short positions.
Strategy Advantages
- Using both price and volume breakouts as buy and sell signals can better confirm trend changes.
- Checking whether the price is above or below the long-term SMA before opening a position ensures that trades are in line with the main market trend.
- Setting the closing price crossing the SMA for multiple consecutive days as the closing signal can effectively capture the end of the trend.
- Suitable for highly volatile assets such as Bitcoin and Ethereum, it can take advantage of sudden changes in market prices and trading volumes to profit.
Strategy Risks
- In markets with low volatility or no obvious trends, this strategy may lead to frequent trades, thereby increasing transaction costs.
- For markets with lower volatility, such as the S&P 500 index, the effect of this strategy may not be as significant as in the cryptocurrency market.
- This strategy may generate fewer trading signals on higher timeframes, as most trades tend to have a longer holding period.
Strategy Optimization Direction
- Adjust the length of the price breakout period and volume breakout period according to different market characteristics to adapt to the volatility characteristics of different assets.
- Try to use other trend confirmation indicators, such as exponential moving averages, MACD, etc., to improve the accuracy of trend judgment.
- Incorporate risk management measures into the strategy, such as setting stop-loss levels and dynamically adjusting positions to reduce the risk exposure of a single transaction.
- For trades with longer holding periods, consider adding a trailing stop strategy to better protect profits already obtained.
Summary
The "Price and Volume Breakout Buy Strategy" is a trend-following strategy suitable for highly volatile markets. By considering both price and volume breakouts, and combining long-term SMA as a trend filter, this strategy can better capture trading opportunities in strong markets. However, this strategy may perform poorly in markets with no obvious trends or low volatility and may face the risk of frequent trading. Therefore, in practical applications, it is necessary to appropriately optimize and adjust the strategy according to different market characteristics and personal trading styles to improve its stability and profitability.
Source Pine Script
/*backtest
start: 2023-05-11 00:00:00
end: 2024-05-16 00:00:00
period: 1d
basePeriod: 1h
exchanges: [{"eid":"Futures_Binance","currency":"BTC_USDT"}]
*/

// This Pine Script™ code is subject to the terms of the Mozilla Public License 2.0 at https://mozilla.org/MPL/2.0/
// © tradedots

//@version=5
strategy("Price and Volume Breakout Buy Strategy [TradeDots]", overlay=true, initial_capital = 10000, default_qty_type = strategy.percent_of_equity, default_qty_value = 70, commission_type = strategy.commission.percent, commission_value = 0.01)

input_price_breakout_period = input.int(60, "Price Breakout Period")
input_volume_breakout_period = input.int(60, "Volume Breakout Period")
input_trendline_legnth = input.int(200, "Trendline Length")
input_order_direction = input.string("Long", options = ["Long", "Short", "Long and Short"], title = "Order Direction")

price_highest = ta.highest(input_price_breakout_period)
price_lowest = ta.lowest(input_price_breakout_period)
volume_highest = ta.highest(volume, input_volume_breakout_period)

// Long Orders
if close > price_highest[1] and volume > volume_highest[1] and close > ta.sma(close, input_trendline_legnth) and strategy.opentrades == 0 and input_order_direction != "Short"
    strategy.entry("Long", strategy.long)
    // line.new(bar_index[input_price_breakout_period], price_highest[1], bar_index, price_highest[1], color = #9cff87, width = 2)
    // label.new(bar_index,low, "? Breakout Buy", style = label.style_label_up, color = #9cff87)

// Close when price is below moving average for 5 consecutive days
if close < ta.sma(close, input_trendline_legnth) and close[1] < ta.sma(close, input_trendline_legnth) and close[2] < ta.sma(close, input_trendline_legnth) and close[3] < ta.sma(close, input_trendline_legnth) and close[4] < ta.sma(close, input_trendline_legnth) and strategy.opentrades.size(strategy.opentrades - 1) > 0
    strategy.close("Long")
    // label.new(bar_index, high, "? Close Position", style = label.style_label_down, color = #f9396a, textcolor = color.white)

// Short Orders
if close < price_lowest[1] and volume > volume_highest[1] and close < ta.sma(close, input_trendline_legnth) and strategy.opentrades == 0 and input_order_direction != "Long"
    strategy.entry("Short", strategy.short)
    // line.new(bar_index[input_price_breakout_period], price_lowest[1], bar_index, price_lowest[1], color = #f9396a, width = 2)
    // label.new(bar_index,high , "? Breakout Sell", style = label.style_label_down, color = #f9396a, textcolor = color.white)

// Close when price is above moving average for 5 consecutive days
if close > ta.sma(close, input_trendline_legnth) and close[1] > ta.sma(close, input_trendline_legnth) and close[2] > ta.sma(close, input_trendline_legnth) and close[3] > ta.sma(close, input_trendline_legnth) and close[4] > ta.sma(close, input_trendline_legnth) and strategy.opentrades.size(strategy.opentrades - 1) < 0
    strategy.close("Short")
    // label.new(bar_index, low, "? Close Position", style = label.style_label_up, color = #9cff87)

plot(ta.sma(close, input_trendline_legnth), color = color.white, linewidth = 2)
plotcandle(open, high, low, close, title='Candles', color = (close > ta.sma(close, input_trendline_legnth) ? #9cff87 : #f9396a), wickcolor=(close > ta.sma(close, input_trendline_legnth) ? #9cff87 : #f9396a), force_overlay = true)
Published by ChaoZhang on the FMZ strategy square · last modified 2024-05-17. Collected in the Quant Trading Vault. Unvalidated research: re-test with your own data and costs before trusting it.
Build this with AgenKit
A spec is not a trading system. Paste this into your coding agent and AgenKit runs a specialist team — architecture, test-first build, risk gates, review — with paper trading on by default.
/agenkit build a production-grade trading bot with a backtest engine, risk controls and paper trading by default from strategies/Price-and-Volume-Breakout-Buy-Strategy.md- npx agenkit install engineering-kit in your project
- Paste the command into your agent and approve each phase
- Get tests, backtest, risk controls and a paper-trading switch
Understand it first
Before you run this, read the lesson behind the idea and how to backtest it honestly. Specs like this one are the survivors of an unknown number of trials; deflate their results accordingly.
Related specs
- 5 Day Moving Average Channel Breakout Strategy Combined With Mileage ConceptPine Script · Breakout · 1d
- Adaptive Bollinger Breakout with Moving Average Quantitative Strategy SystemPine Script · Breakout · 1h
- Adaptive Multi Period Trading Strategy Based on Wave Trend Momentum BreakoutPine Script · Breakout · 2h
- Adaptive Trading Strategy Based on ADX IndicatorPine Script · Breakout · 1d
- Average Line Breakthrough StrategyPine Script · Breakout · 1d
- BB Breakout StrategyPine Script · Breakout · 1d