Strategy vault / Trend following
Price Channel Trend Following Strategy
This strategy is a trend following strategy based on the price channel principle. It calculates the highest and lowest prices over a certain historical period to form a price channel, and uses the channel boundaries…
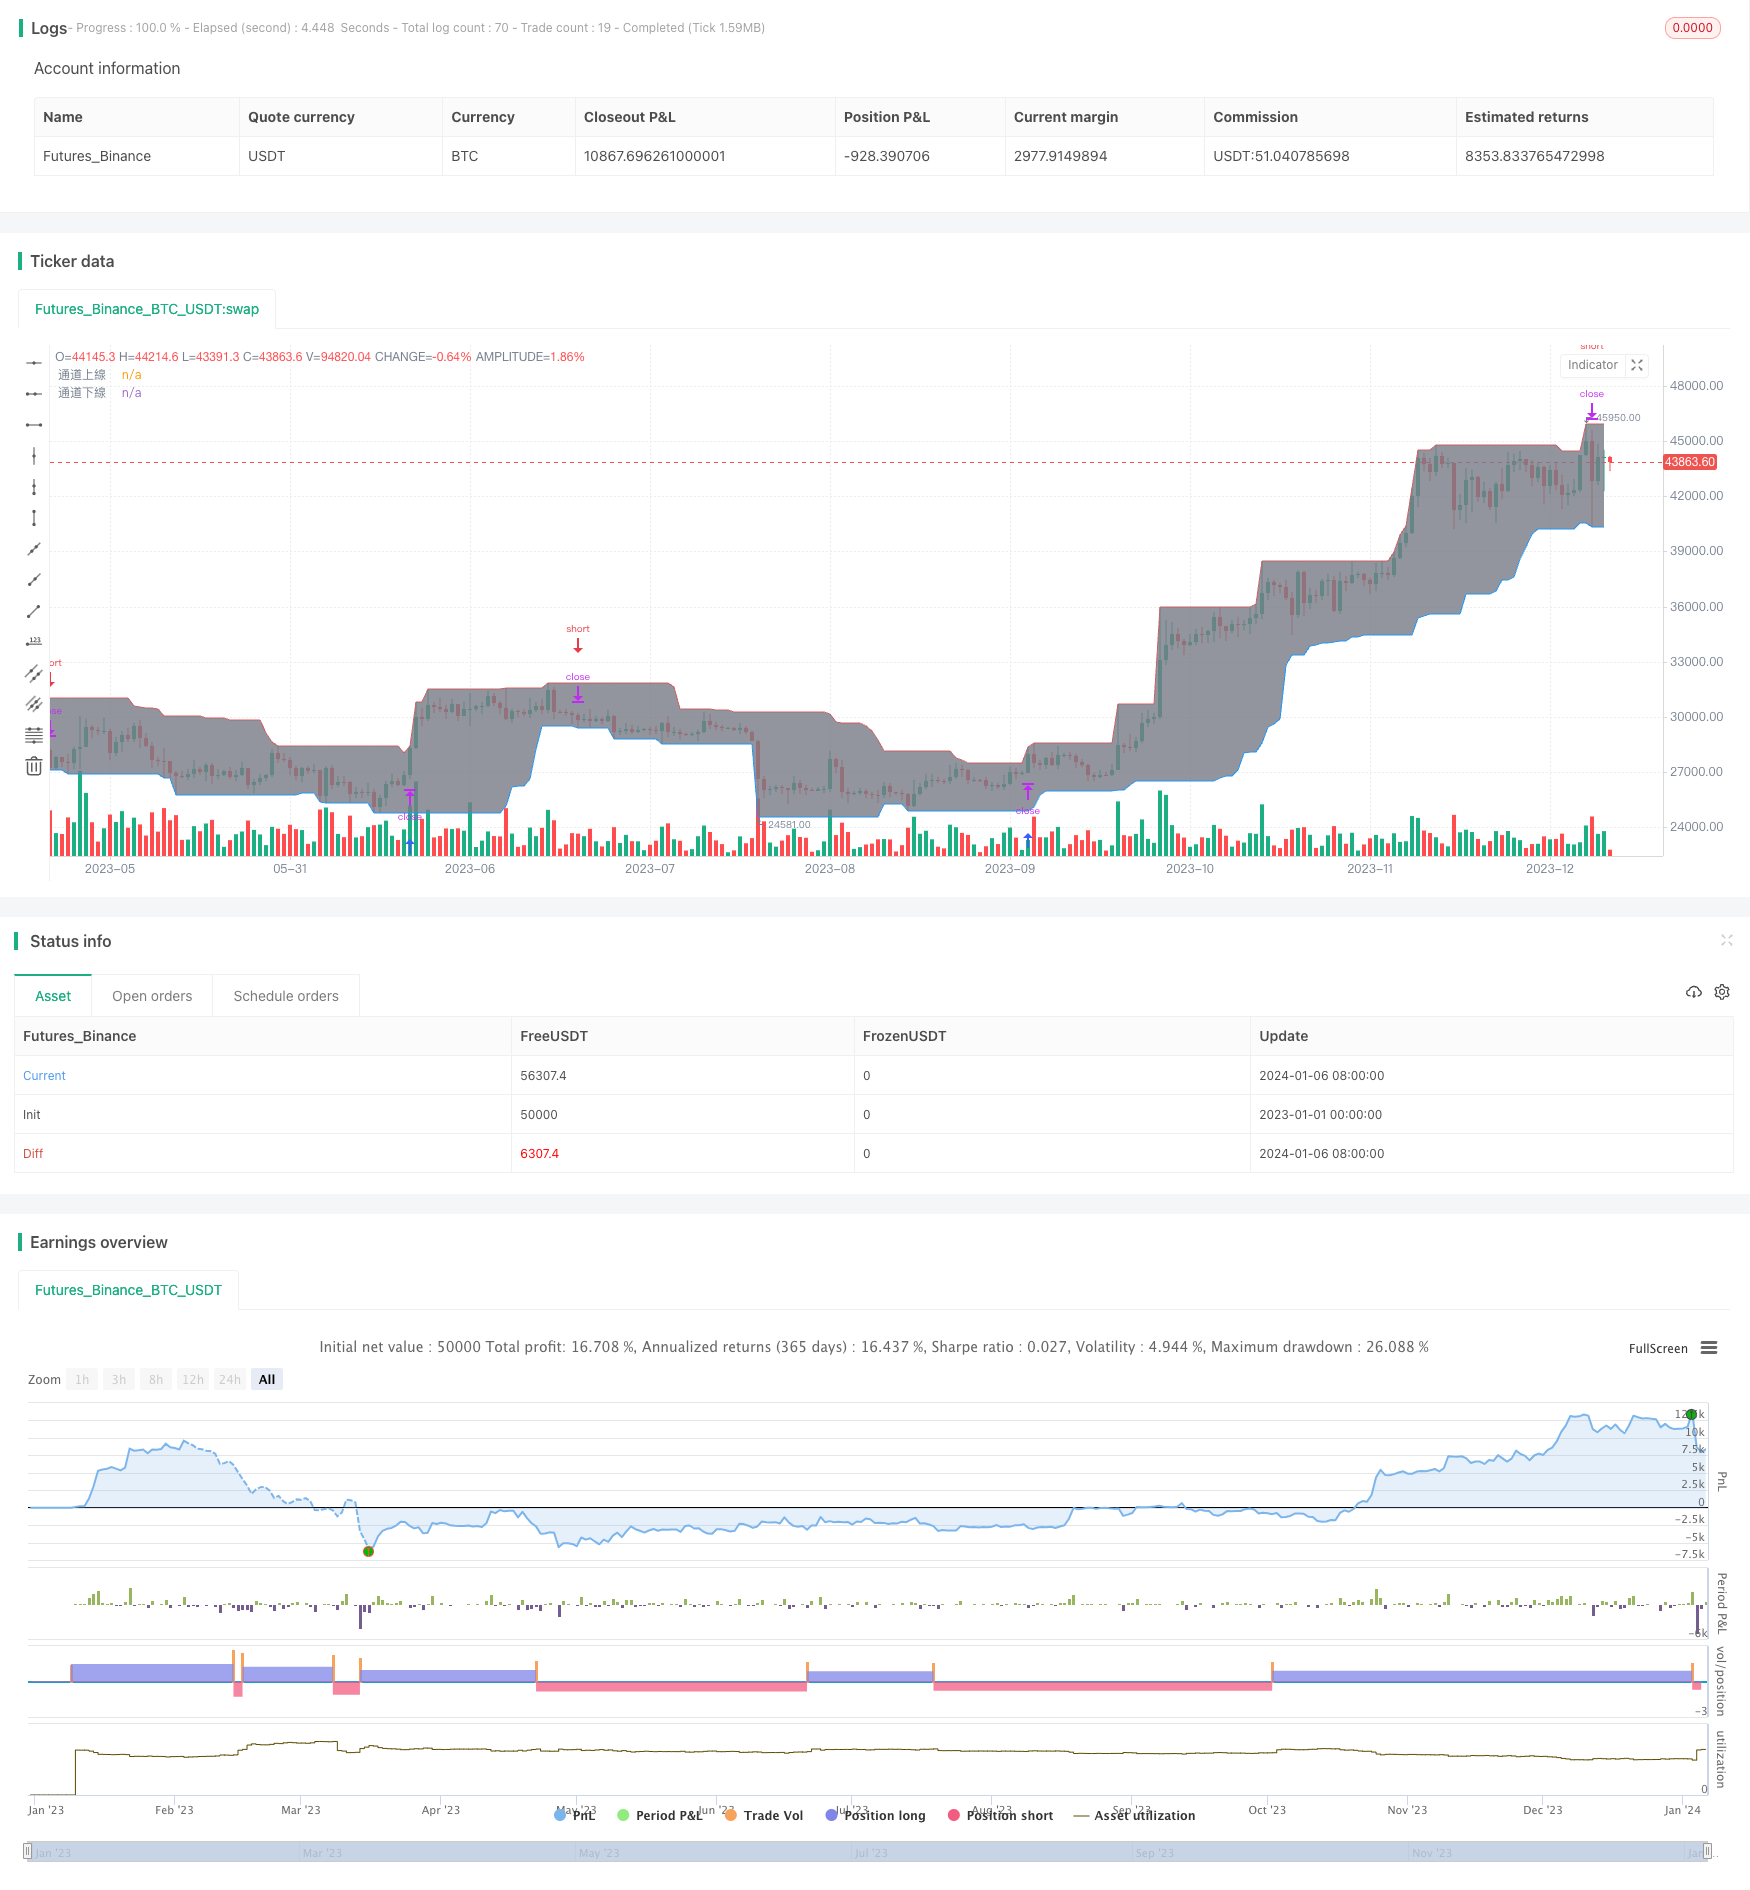
Overview
This strategy is a trend following strategy based on the price channel principle. It calculates the highest and lowest prices over a certain historical period to form a price channel, and uses the channel boundaries as buy and sell signals to track price trends.
Strategy Logic
The core idea of the price channel strategy is: when the stock price is in an upward trend, it will break through the historical high; when it is in a downward trend, it will break through the historical low. Therefore, a price channel can be constructed based on the highest and lowest prices over a certain historical period (such as 21 days). The upper and lower rails of the channel serve as buy and sell signals respectively.
Specifically, this strategy uses the highest() and lowest() functions to calculate the highest and lowest prices over the most recent 21 days to form a price channel. If the closing price of the day is higher than the 21-day high (i.e. breaking through the upper rail of the channel), a buy signal is generated. If the closing price is lower than the 21-day low (i.e. breaking through the lower rail), a sell signal is generated.
In addition, the strategy also checks for gaps to judge potential trend reversals. If there is a down gap, the price channel will be set to red to hedge risks. If there is an up gap, it will be set to green.
Advantage Analysis
The main advantages of the price channel strategy are:
- The strategy logic is simple, easy to understand and implement
- Can effectively identify price trends of stocks and track trends in a timely manner
- Reduces transaction costs by generating signals through breakouts
- The price channel can play the role of stop loss
- Checking for gaps indicates possible trend changes
Risk Analysis
There are also some risks with this strategy:
- It only relies on price data, ignoring other fundamentals, technical indicators, etc.
- Improper settings of the channel parameters could lead to over-aggressiveness or over-conservativeness
- Breakout buys can face pullback risks causing a stop loss
- It does not consider the impact of price volatility and liquidity
- Differences across industries and individual stocks are not taken into account
To overcome these risks, the following optimizations could be considered:
- Incorporate key technical indicators to avoid wrong signals
- Add adaptive channel parameter algorithms
- Use moving averages to judge trend persistence
- Set channel width factors to correct different volatility levels
- Distinguish parameters by industry and concepts
Optimization Directions
The main directions to optimize this strategy include:
- Optimize price channel parameter calculations, e.g. adaptive channels, volatility channels, etc.
- Incorporate other technical indicators to improve signal accuracy
- Add stop loss and take profit strategies to control risks and lock in profits
- Set dynamic parameters across industries and individual stocks
- Enhance strategy by incorporating fundamentals and event drives
- Apply machine learning algorithms for adaptive optimization and condition judgment
Summary
The price channel strategy builds a simple channel using historical peaks and troughs and uses the channel boundaries as trading signals. It is a typical trend following strategy that is easy to understand and implement and can effectively track price trends, with the price channel serving as a stop loss mechanism. However there are also risks with this strategy. The main optimization dimensions include parameter tuning, combining other indicators, implementing stop loss/profit taking, dynamic parameterization, etc. Overall, the price channel strategy provides a simple and practical trend following framework for quantitative trading, but needs further enhancements and optimizations to achieve better performance in live trading.
Parameters
| Name | Default | What it controls |
|---|---|---|
| v_input_1_close | 0 | Channel Price: close | high | low | open | hl2 | hlc3 | hlcc4 | ohlc4 |
| v_input_2 | 21 | Channel traceback length |
Source Pine Script
/*backtest
start: 2023-01-01 00:00:00
end: 2024-01-07 00:00:00
period: 1d
basePeriod: 1h
exchanges: [{"eid":"Futures_Binance","currency":"BTC_USDT"}]
*/

//@version=4
//
//  Work: [LunaOwl] Lohas Investment: Price Channel
//  English text: [LunaOwl] LOHAS Investor - PriceChannel
//
///////////////////////////////
//     ~~!!*(๑╹◡╹๑) **      //
//  Production: @LunaOwl Peng Peng      //
//  First edition: 2019Year12Moon07day     //
//  Second edition: 2019Year12Moon09day     //
///////////////////////////////
//
//  Introduction:
//--The price channel is an ancient investment strategy, very convenient for office workers who are willing to do their homework when selecting stocks.
//--Since most retail investors in the stock market do not have time to operate, even if they have time, it only speeds up losing money, so,
//--There are several conditions for the office worker investment method, or "Lohas Investment":
//--**********
//--1) Set a moderate investment return expectation
//--2) Use appropriate stock selection methods to build your portfolio and reduce the error rate of single stocks
//--3) Use a simple entry and exit strategy and execute it regularly
//--4) Wealth accumulates over time, learn every day
//--**********
//
//==Define backtest conditions==//

strategy("[LunaOwl] Price Channel",
     initial_capital = 10000, commission_value = 0.07,
     default_qty_type = strategy.percent_of_equity,
     default_qty_value = 50, overlay = true,
     calc_on_order_fills = true
     )

//==Set price channel==//

Channel_Price  = input(close, title = "Channel Price")
Channel_Length = input(21, title = "Channel traceback length")
Channel_High = highest(high, Channel_Length)
Channel_Low  = lowest(low, Channel_Length)

gapUp   = (low > high[1])
gapDown = (high < low[1])

BackgroundColour = (gapUp == true) ? color.green :
                   (gapDown == true) ? color.red : na

bgcolor(BackgroundColour, transp=60)

BorderlineA = plot(Channel_High, title = "Channel Upper Line", color = color.red, style = plot.style_line)
BorderlineB = plot(Channel_Low, title = "Channel Lower Line", color = color.blue, style = plot.style_line)
fill(BorderlineA, BorderlineB, title = "Channel Background Color", color = color.gray, transp = 85)

Long_entry = close >= Channel_High
Long_close_all = close <= Channel_Low

if (not na(close[Channel_Length]))
    strategy.entry("Buy", strategy.long, comment = "Above Recent", stop = Channel_High)
strategy.entry("Sell", strategy.short, comment = "Below Recent", stop = Channel_Low)Published by ChaoZhang on the FMZ strategy square · last modified 2024-01-08. Collected in the Quant Trading Vault. Unvalidated research: re-test with your own data and costs before trusting it.
Build this with AgenKit
A spec is not a trading system. Paste this into your coding agent and AgenKit runs a specialist team — architecture, test-first build, risk gates, review — with paper trading on by default.
/agenkit build a production-grade trading bot with a backtest engine, risk controls and paper trading by default from strategies/Price-Channel-Trend-Following-Strategy.md- npx agenkit install engineering-kit in your project
- Paste the command into your agent and approve each phase
- Get tests, backtest, risk controls and a paper-trading switch
Understand it first
Before you run this, read the lesson behind the idea and how to backtest it honestly. Specs like this one are the survivors of an unknown number of trials; deflate their results accordingly.
Related specs
- 200 EMA VWAP MFI Trend Following StrategyPine Script · Trend following · 1d
- 4 EMA Trend StrategyPine Script · Trend following · 1d
- ADX MA and EMA Long Only Trend Tracking StrategyPine Script · Trend following · 1d
- ATR Dynamic Profit Target and Stop Loss StrategyPine Script · Trend following · 1d
- ATR Dynamic Trend Following and EMA Crossover Trading StrategyPine Script · Trend following · 1d
- ATR and Moving Average Crossover Hybrid StrategyPine Script · Trend following · 1h