Strategy vault / Trend following
Price Gap and Trend Following Trading Strategy
This strategy uses the CCI indicator and momentum indicator combined with the RSI indicator to identify market trends and enter when gap appears in overbought/oversold zone. It also utilizes Bollinger Bands to…
Overview
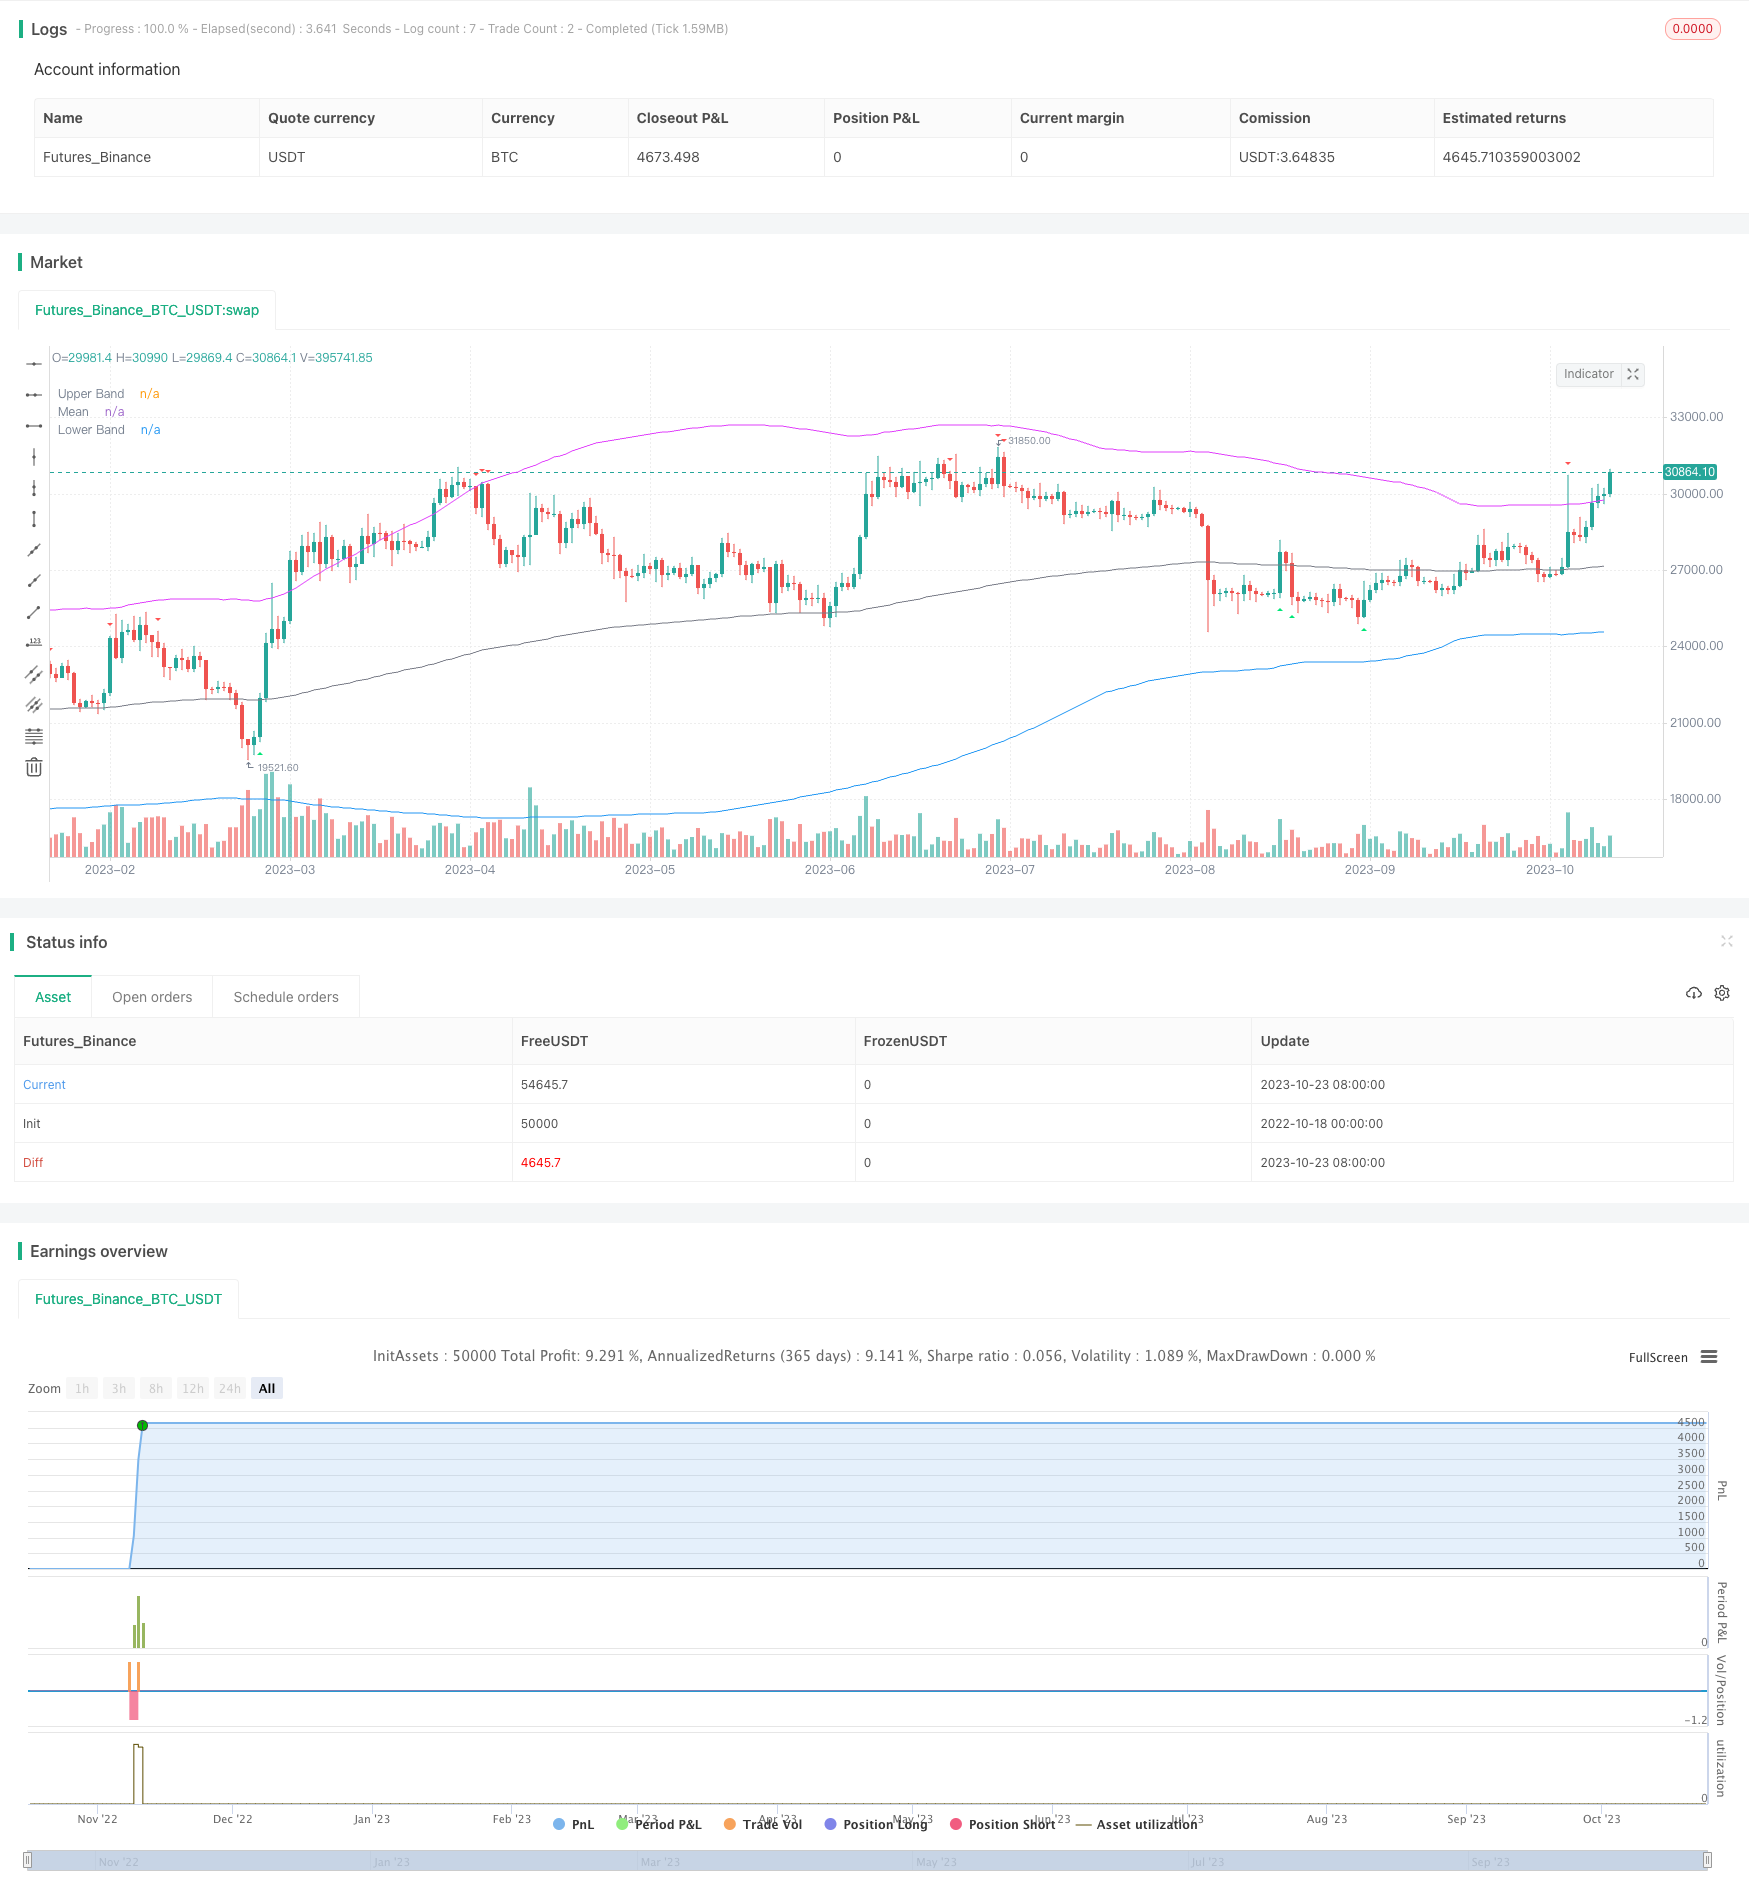
This strategy uses the CCI indicator and momentum indicator combined with the RSI indicator to identify market trends and enter when gap appears in overbought/oversold zone. It also utilizes Bollinger Bands to recognize trends and mean reversion range. The strategy can effectively identify breakouts and pullbacks, get in early in trend start, and adapt to different products by adjusting parameters.
Strategy Logic
Firstly, the strategy determines long and short signals by CCI indicator or momentum indicator crossing above/below 0 line. Also it requires RSI to be in overbought/oversold zone, i.e. above 65 for overbought and below 35 for oversold, to avoid false signals.
In addition, the strategy can choose to determine RSI bullish/bearish divergences to ensure more reliable signals.
When CCI or momentum long signal triggers, and RSI is in oversold zone, the strategy will check if previous high and low are both above Bollinger Band mean line. If so, a long signal is generated. Vice versa, when short signal triggers and previous high low are below mean line, a short signal is generated.
Thus the strategy utilizes both trend and oscillation indicators, to get in a trend early and avoid false breakout with mean reversion range. When price breaks out of Bollinger Bands, the strategy will close all positions to lock profit and prevent further drawdown.
Advantage Analysis
Combining trend and oscillation indicators can enter trend early and avoid unnecessary positions in range market.
Using Bollinger Band mean with price gaps filters false breakouts effectively.
Checking historical RSI avoids generating wrong trade signals.
Fully automated trading without manual interference, suitable for algorithm trading.
Flexible parameter adjustment adapts to different trading products.
Stop loss and take profit controls risk effectively.
Risk Analysis
Improper Bollinger Band parameters may cause invalid mean reversion identification.
Wrong indicator parameters may generate too many false signals.
Failed breakout needs timely stop loss when price pulls back to mean.
Poor liquidity may cause ineffective breakout trading.
Ensure sufficient historical data to avoid poor curve fitting.
Pay attention to trading sessions to avoid false breakout.
Improvement Directions
Optimize Bollinger Bands parameters for more stable mean reversion range.
Test parameters on different products for better optimization.
Add position sizing to avoid oversized single position.
Add trading session filter to trade mainly in active hours.
Incorporate machine learning models to generate more intelligent signals.
Integrate more data sources to determine overall market trend.
Add more indicators to form a robust indicator ensemble.
Conclusion
This strategy integrates trend and oscillation indicators to capture trends early. With Bollinger Band mean and price gaps it avoids false breakouts effectively. Flexible parameters adapt to different products with great backtest results. Next steps are to optimize parameters and model ensemble for more robustness, and achieve consistent excess returns in the long run.
Parameters
| Name | Default | What it controls |
|---|---|---|
| v_input_string_1 | 0 | Entry Signal Source: CCI | Momentum |
| v_input_int_1 | 10 | CCI/Momentum Length |
| v_input_bool_1 | false | Find Regular Bullish/Bearish Divergence |
| v_input_int_2 | 65 | RSI Overbought Level |
| v_input_int_3 | 35 | RSI Oversold Level |
| v_input_int_4 | 14 | RSI Length |
| v_input_bool_2 | true | Plot Mean Reversion Bands on the chart |
| v_input_1 | 200 | Lookback Period (EMA) |
| v_input_float_1 | 1.6 | Outer Bands Multiplier |
Source Pine Script
/*backtest
start: 2022-10-18 00:00:00
end: 2023-10-24 00:00:00
period: 1d
basePeriod: 1h
exchanges: [{"eid":"Futures_Binance","currency":"BTC_USDT"}]
*/

//@version=5
strategy(title='BroTheJo Strategy', shorttitle='BTJ', overlay=true)

// Input settings
ccimomCross = input.string('CCI', 'Entry Signal Source', options=['CCI', 'Momentum'])
ccimomLength = input.int(10, minval=1, title='CCI/Momentum Length')
useDivergence = input.bool(false, title='Find Regular Bullish/Bearish Divergence')
rsiOverbought = input.int(65, minval=1, title='RSI Overbought Level')
rsiOversold = input.int(35, minval=1, title='RSI Oversold Level')
rsiLength = input.int(14, minval=1, title='RSI Length')
plotMeanReversion = input.bool(true, 'Plot Mean Reversion Bands on the chart')
emaPeriod = input(200, title='Lookback Period (EMA)')
bandMultiplier = input.float(1.6, title='Outer Bands Multiplier')

// CCI and Momentum calculation
momLength = ccimomCross == 'Momentum' ? ccimomLength : 10
mom = close - close[momLength]
cci = ta.cci(close, ccimomLength)
ccimomCrossUp = ccimomCross == 'Momentum' ? ta.cross(mom, 0) : ta.cross(cci, 0)
ccimomCrossDown = ccimomCross == 'Momentum' ? ta.cross(0, mom) : ta.cross(0, cci)

// RSI calculation
src = close
up = ta.rma(math.max(ta.change(src), 0), rsiLength)
down = ta.rma(-math.min(ta.change(src), 0), rsiLength)
rsi = down == 0 ? 100 : up == 0 ? 0 : 100 - 100 / (1 + up / down)
oversoldAgo = rsi[0] <= rsiOversold or rsi[1] <= rsiOversold or rsi[2] <= rsiOversold or rsi[3] <= rsiOversold
overboughtAgo = rsi[0] >= rsiOverbought or rsi[1] >= rsiOverbought or rsi[2] >= rsiOverbought or rsi[3] >= rsiOverbought

// Regular Divergence Conditions
bullishDivergenceCondition = rsi[0] > rsi[1] and rsi[1] < rsi[2]
bearishDivergenceCondition = rsi[0] < rsi[1] and rsi[1] > rsi[2]

// Mean Reversion Indicator
meanReversion = plotMeanReversion ? ta.ema(close, emaPeriod) : na
stdDev = plotMeanReversion ? ta.stdev(close, emaPeriod) : na
upperBand = plotMeanReversion ? meanReversion + stdDev * bandMultiplier : na
lowerBand = plotMeanReversion ? meanReversion - stdDev * bandMultiplier : na

// Entry Conditions
prevHigh = ta.highest(high, 1)
prevLow = ta.lowest(low, 1)
longEntryCondition = ccimomCrossUp and oversoldAgo and (not useDivergence or bullishDivergenceCondition) and (prevHigh >= meanReversion) and (prevLow >= meanReversion)
shortEntryCondition = ccimomCrossDown and overboughtAgo and (not useDivergence or bearishDivergenceCondition) and (prevHigh <= meanReversion) and (prevLow <= meanReversion)

// Plotting
oldLongEntryCondition = ccimomCrossUp and oversoldAgo and (not useDivergence or bullishDivergenceCondition)
oldShortEntryCondition = ccimomCrossDown and overboughtAgo and (not useDivergence or bearishDivergenceCondition)
plotshape(oldLongEntryCondition, title='BUY', style=shape.triangleup, location=location.belowbar, color=color.new(color.lime, 0), textcolor=color.new(color.white, 0), size=size.tiny)
plotshape(oldShortEntryCondition, title='SELL', style=shape.triangledown, location=location.abovebar, color=color.new(color.red, 0), textcolor=color.new(color.white, 0), size=size.tiny)

// Strategy logic
if (longEntryCondition)
    strategy.entry("Buy", strategy.long)
if (shortEntryCondition)
    strategy.entry("Sell", strategy.short)

// Close all open positions when outside of bands
closeAll = (high >= upperBand) or (low <= lowerBand)

if (closeAll)
    strategy.close_all("Take Profit/Cut Loss")


// Plotting
plot(upperBand, title='Upper Band', color=color.fuchsia, linewidth=1)
plot(meanReversion, title='Mean', color=color.gray, linewidth=1)
plot(lowerBand, title='Lower Band', color=color.blue, linewidth=1)Published by ChaoZhang on the FMZ strategy square · last modified 2023-10-25. Collected in the Quant Trading Vault. Unvalidated research: re-test with your own data and costs before trusting it.
Build this with AgenKit
A spec is not a trading system. Paste this into your coding agent and AgenKit runs a specialist team — architecture, test-first build, risk gates, review — with paper trading on by default.
/agenkit build a production-grade trading bot with a backtest engine, risk controls and paper trading by default from strategies/Price-Gap-and-Trend-Following-Trading-Strategy.md- npx agenkit install engineering-kit in your project
- Paste the command into your agent and approve each phase
- Get tests, backtest, risk controls and a paper-trading switch
Understand it first
Before you run this, read the lesson behind the idea and how to backtest it honestly. Specs like this one are the survivors of an unknown number of trials; deflate their results accordingly.
Related specs
- Quantitative Strategy Bollinger Bands RSI CCI Crossover StrategyPine Script · Trend following · 1h
- SuperTrend Trading Strategy with Multiple FiltersPine Script · Trend following · 1h
- Bollinger Bands and RSI Trend Following StrategyPine Script · Trend following · 1h
- EMA Cross Trend Following Strategy with SMA Stop Loss and Re Entry MechanismPine Script · Trend following · 1h
- EMA SMA Multi Indicator Comprehensive Trend Following StrategyPine Script · Trend following · 1h
- EMA and RSI Trend Trading StrategyPine Script · Trend following · 1d