Strategy vault / Mean reversion
Price Reversal Strategy Guided by Price Channel
The price reversal strategy guided by price channel calculates the center line of the price channel to determine the trend direction of price fluctuations. It generates long and short signals when the price…
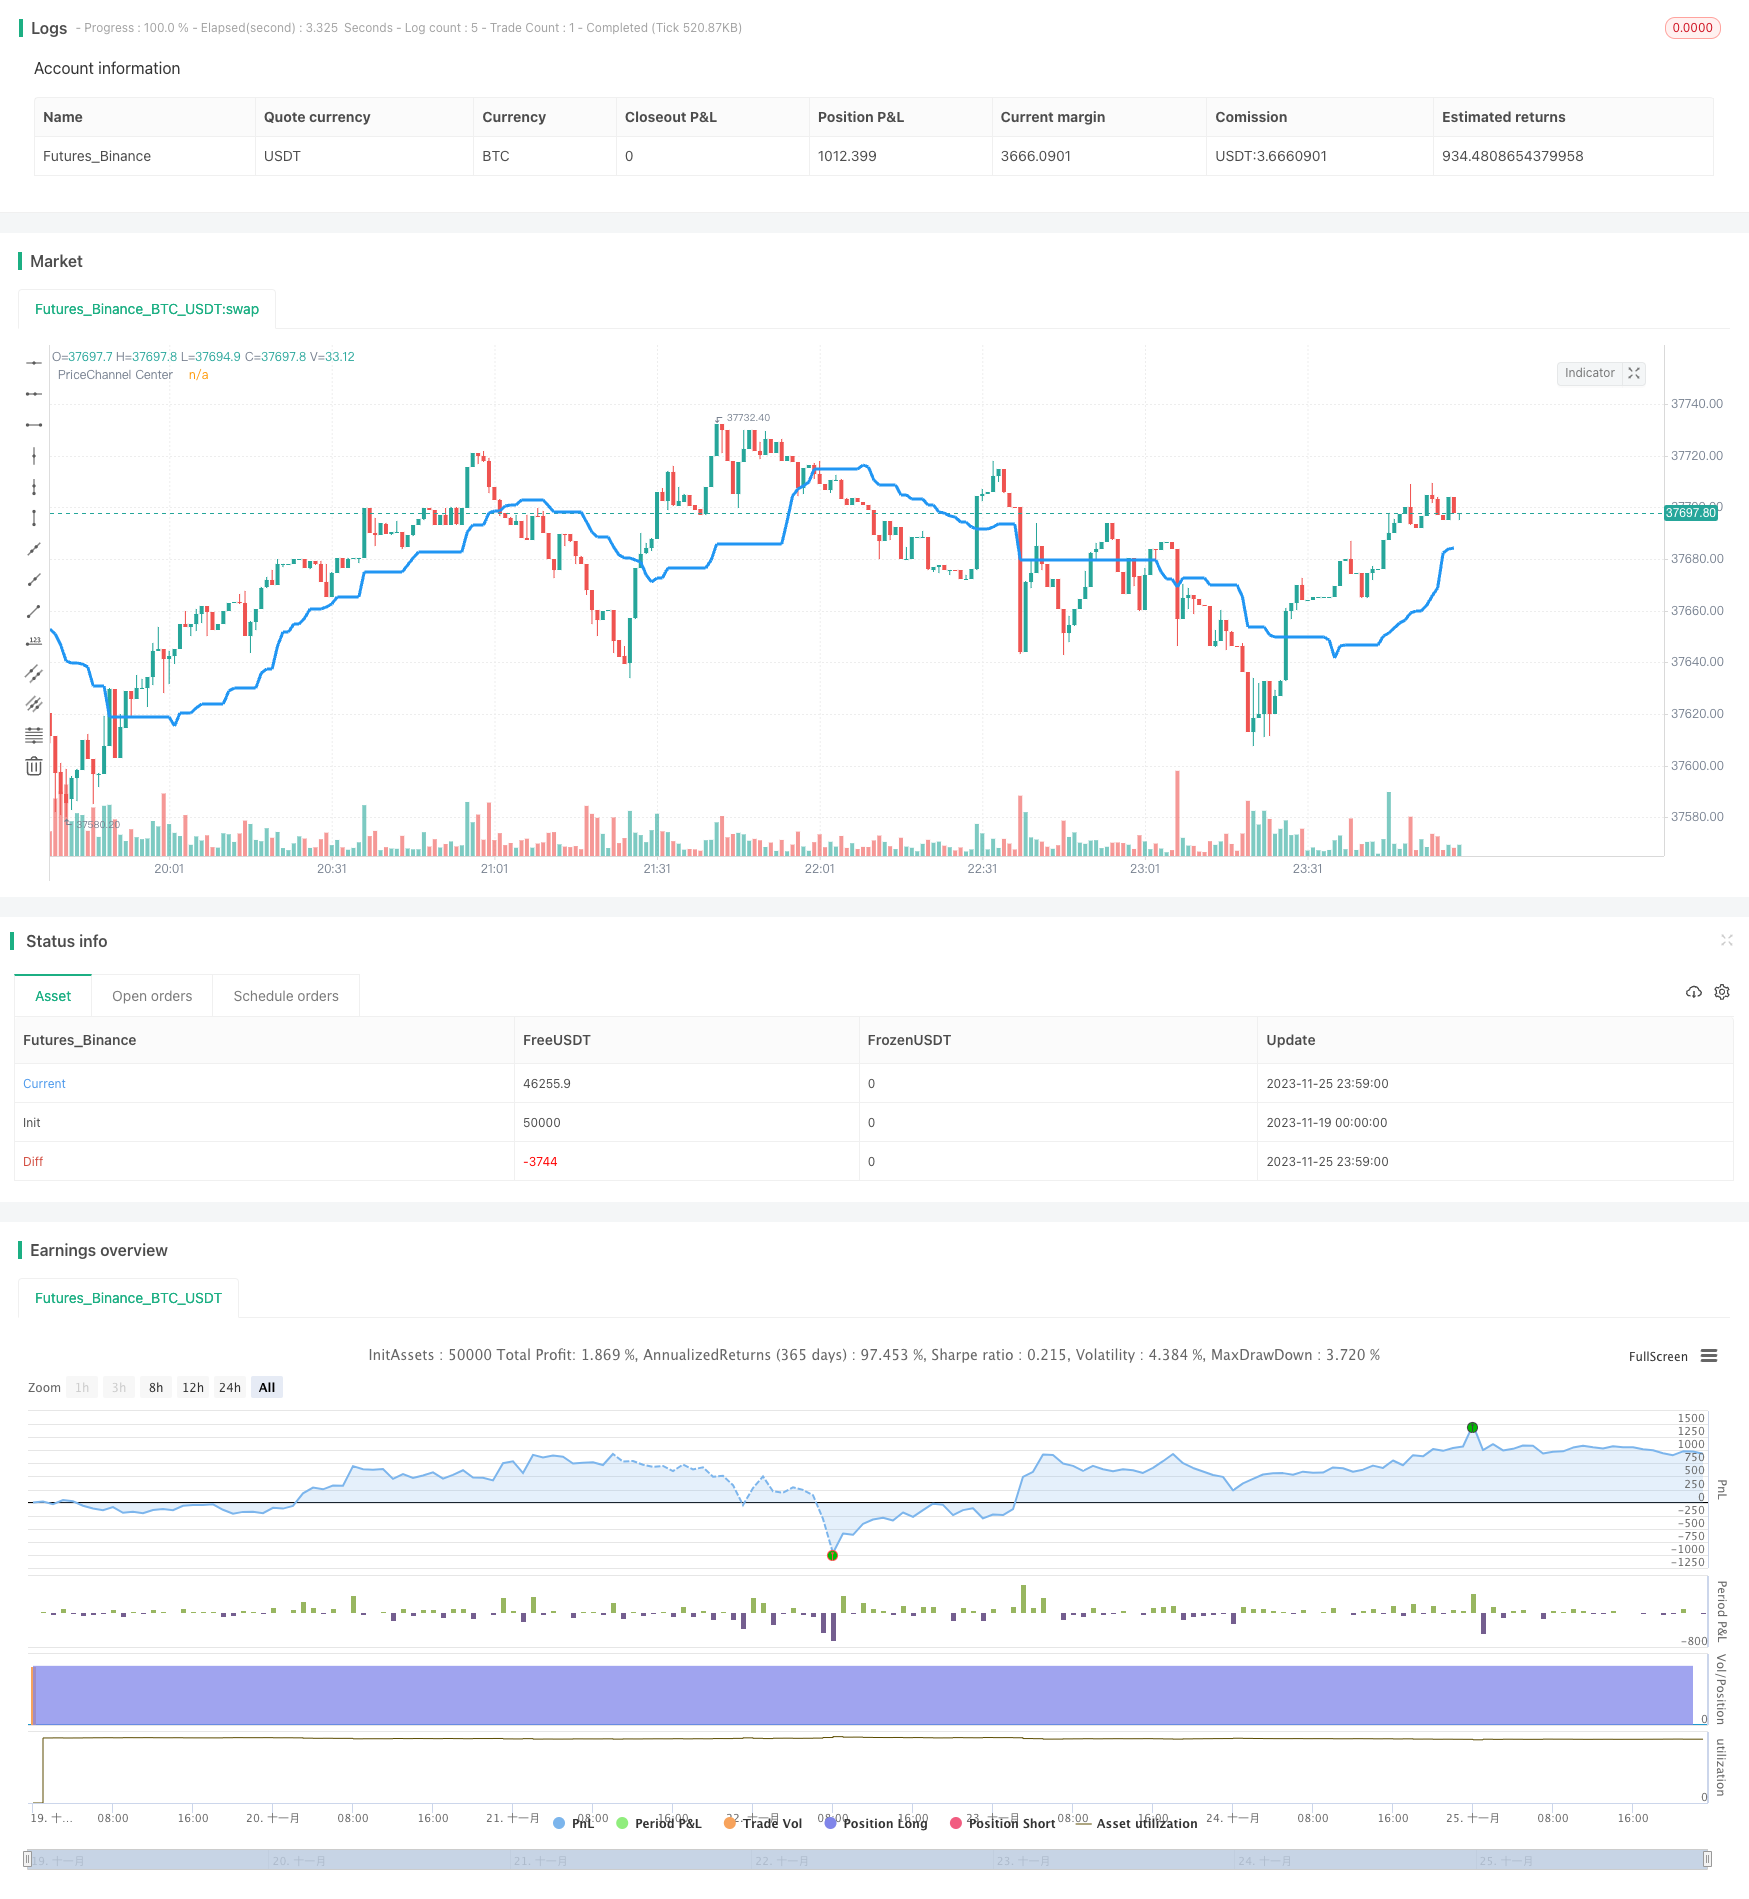
Overview
The price reversal strategy guided by price channel calculates the center line of the price channel to determine the trend direction of price fluctuations. It generates long and short signals when the price approaches the channel center line. This strategy combines multiple filter conditions to search for high probability trading opportunities.
Strategy Logic
The core indicator of this strategy is the price channel center line. It is calculated as the average of the highest price and lowest price of the most recent 30 candlesticks. When the low is higher than the center line, it is considered an uptrend. When the high is lower than the center line, it is considered a downtrend.
The strategy only generates trading signals when the trend background changes. That is, in an uptrend background, it goes short only when the candlestick turns red. In a downtrend background, it goes long only when the candlestick turns green.
In addition, the strategy also sets double filter conditions: candlestick body filter and price channel bars filter. Signals are triggered only when the candlestick body volume is greater than 20% of the average value, and there must be consecutive trend signals within the filter cycle to open positions.
Advantage Analysis
This strategy combines trend, value area and candlestick patterns, which is an efficient reversal trading strategy. The main advantages are:
- Using the price channel to determine the major trend and avoid being misled by range-bound markets.
- Selecting price levels near the price channel center line, which is the classic low-buy-high-sell area.
- Candlestick body and channel bars filters increase signal quality and reduce false signal rates.
- Open positions only at obvious reversal points to avoid chasing highs and selling lows.
Risks and Solutions
The main risks of this strategy come from missing price reversal points and unnecessary waiting for signals. It can be optimized in the following ways:
- Adjust the strictness of filter conditions and reduce filtering standards to decrease missing trades.
- Increase position size in the early stage of reversal trend to capture trend profits.
- Combine other indicators to judge the signal strength and intervene in filters manually.
Optimization Directions
This strategy can be optimized in the following aspects:
- Optimize parameters like the price channel period, number of channel bars etc.
- Add stop loss strategy to stop loss when loss reaches a certain percentage.
- Combine trading volume to intervene in filter strength. For example, relax filters when trading volume amplifies.
- Add machine learning model to judge probability of trend reversal, replacing simple filters.
Conclusion
The price reversal strategy guided by the price channel determines reversal points through price channels, and sets double filter conditions to generate high quality signals. On the basis of parameter tuning and risk control, it is a reliable quantitative strategy.
Parameters
| Name | Default | What it controls |
|---|---|---|
| v_input_1 | true | long |
| v_input_2 | true | short |
| v_input_3 | 30 | PriceChannel Period |
| v_input_4 | true | PriceChannel Bars |
| v_input_5 | true | Use color-filter |
| v_input_6 | true | Use body-filter |
| v_input_7 | false | Need trend Background? |
| v_input_8 | 1900 | From Year |
| v_input_9 | 2100 | To Year |
| v_input_10 | true | From Month |
| v_input_11 | 12 | To Month |
| v_input_12 | true | From day |
| v_input_13 | 31 | To day |
Source Pine Script
/*backtest
start: 2023-11-19 00:00:00
end: 2023-11-26 00:00:00
period: 1m
basePeriod: 1m
exchanges: [{"eid":"Futures_Binance","currency":"BTC_USDT"}]
*/

//Noro
//2018

//@version=2
strategy(title = "Noro's PriceChannel for D1 v1.0", shorttitle = "PriceChannel D1", overlay = true, default_qty_type = strategy.percent_of_equity, default_qty_value = 100.0, pyramiding = 0)

//Settings
needlong = input(true, "long")
needshort = input(true, "short")
slowlen = input(30, defval = 30, minval = 2, maxval = 200, title = "PriceChannel Period")
pcbars = input(1, defval = 1, minval = 1, maxval = 20, title = "PriceChannel Bars")
usecol = input(true, "Use color-filter")
usebod = input(true, "Use body-filter")
needbg = input(false, defval = false, title = "Need trend Background?")
fromyear = input(1900, defval = 1900, minval = 1900, maxval = 2100, title = "From Year")
toyear = input(2100, defval = 2100, minval = 1900, maxval = 2100, title = "To Year")
frommonth = input(01, defval = 01, minval = 01, maxval = 12, title = "From Month")
tomonth = input(12, defval = 12, minval = 01, maxval = 12, title = "To Month")
fromday = input(01, defval = 01, minval = 01, maxval = 31, title = "From day")
today = input(31, defval = 31, minval = 01, maxval = 31, title = "To day")

src = close

//PriceChannel
lasthigh = highest(src, slowlen)
lastlow = lowest(src, slowlen)
center = (lasthigh + lastlow) / 2

//Trend
ub = low > center ? 1 : 0
db = high < center ? 1 : 0
trend = sma(ub, pcbars) == 1 ? 1 : sma(db, pcbars) == 1 ? -1 : trend[1]

//Body
body = abs(close - open)
abody = sma(body, 10)

//Signals
up = trend == 1 and (close < open or usecol == false) and (body > abody / 5 or usebod == false)
dn = trend == -1 and (close > open or usecol == false) and (body > abody / 5 or usebod == false)

//Lines
plot(center, color = blue, linewidth = 3, transp = 0, title = "PriceChannel Center")

//Background
col = needbg == false ? na : trend == 1 ? lime : red
bgcolor(col, transp = 80)

//Trading
if up
    strategy.entry("Long", strategy.long, needlong == false ? 0 : na, when=(time > timestamp(fromyear, frommonth, fromday, 00, 00) and time < timestamp(toyear, tomonth, today, 23, 59)))

if dn
    strategy.entry("Short", strategy.short, needshort == false ? 0 : na, when=(time > timestamp(fromyear, frommonth, fromday, 00, 00) and time < timestamp(toyear, tomonth, today, 23, 59)))

if time > timestamp(toyear, tomonth, today, 23, 59)
    strategy.close_all()
Published by ChaoZhang on the FMZ strategy square · last modified 2023-11-27. Collected in the Quant Trading Vault. Unvalidated research: re-test with your own data and costs before trusting it.
Build this with AgenKit
A spec is not a trading system. Paste this into your coding agent and AgenKit runs a specialist team — architecture, test-first build, risk gates, review — with paper trading on by default.
/agenkit build a production-grade trading bot with a backtest engine, risk controls and paper trading by default from strategies/Price-Reversal-Strategy-Guided-by-Price-Channel.md- npx agenkit install engineering-kit in your project
- Paste the command into your agent and approve each phase
- Get tests, backtest, risk controls and a paper-trading switch
Understand it first
Before you run this, read the lesson behind the idea and how to backtest it honestly. Specs like this one are the survivors of an unknown number of trials; deflate their results accordingly.
Related specs
- 3 10 Oscillator Profile Flagging StrategyPine Script · Mean reversion · 1d
- A Trend Reversal Strategy Based on Moving Averages Price Patterns and VolumePine Script · Mean reversion · 1d
- Adaptive Mean Reversion Trading Strategy Based on Chande Momentum OscillatorPine Script · Mean reversion · 1d
- Adaptive Trading Strategy Combining Dynamic Trend Reversal and Stochastic IndicatorPine Script · Mean reversion · 1d
- Advanced 15 Minute Chart Trading Signal StrategyPine Script · Mean reversion · 3h
- Advanced Momentum EMA Trend Following with RSI Overbought Oversold Trading StrategyPine Script · Mean reversion · 1d