Strategy vault / Trend following
Price Volume Trend Strategy
This strategy uses momentum indicators to track short-term price movements and determine market trend directions for buy and sell operations. The strategy name "Price Volume Trend Strategy" reflects the idea of using…
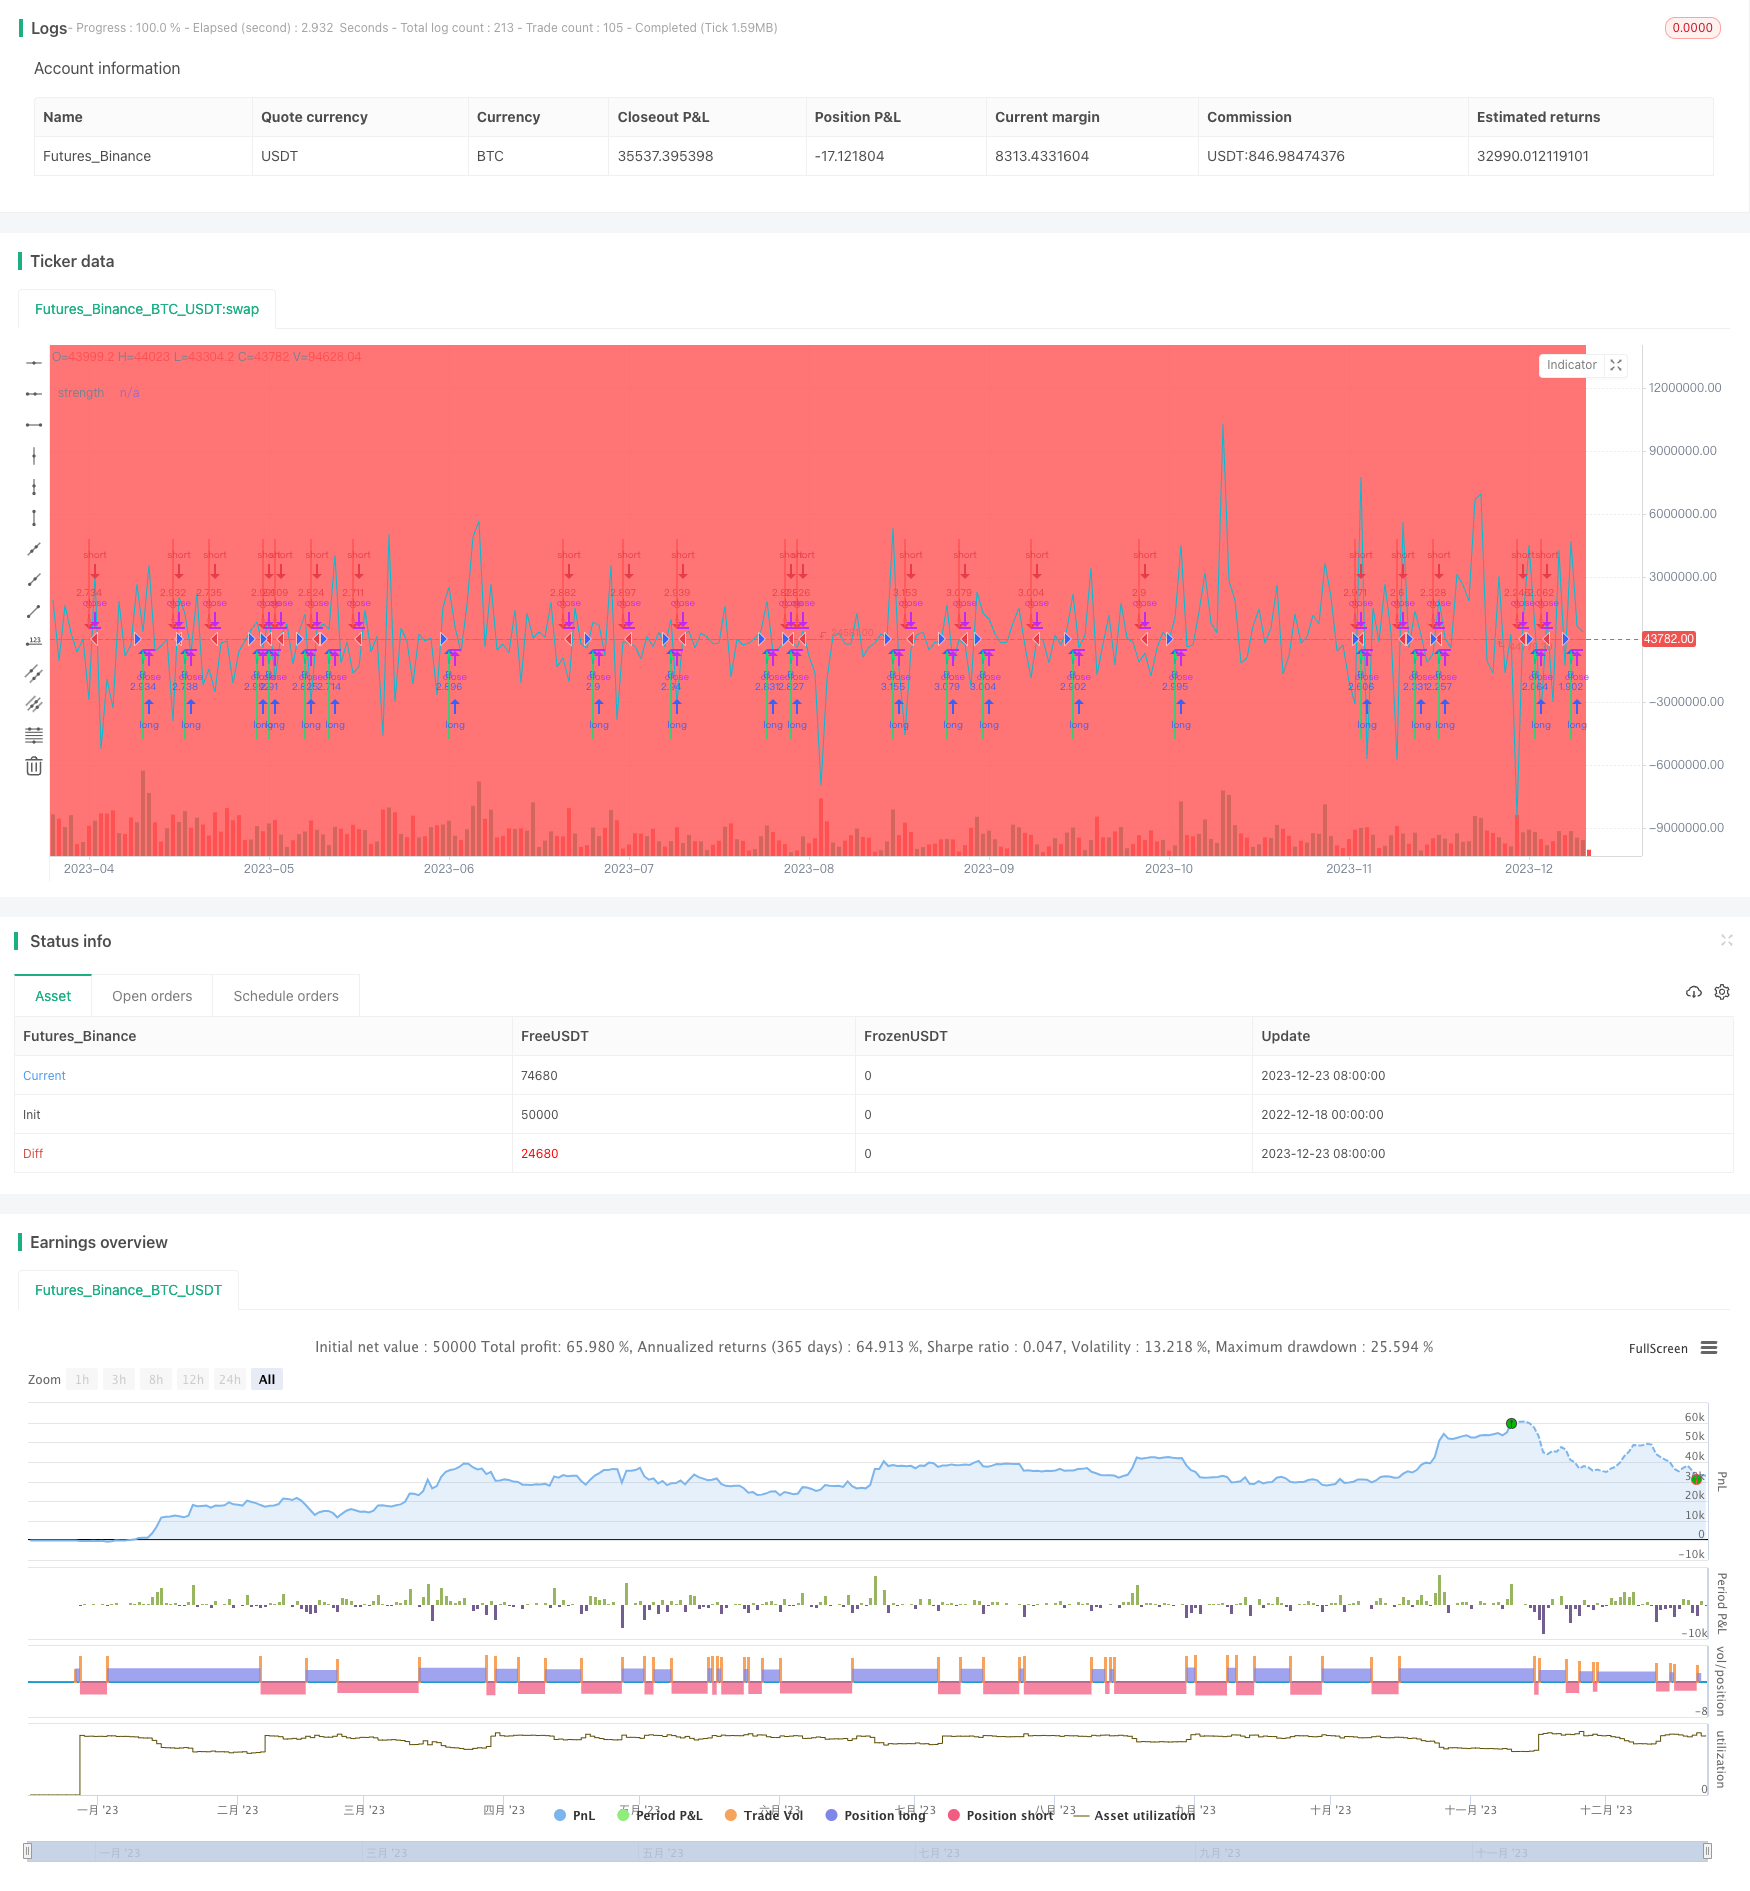
Overview
This strategy uses momentum indicators to track short-term price movements and determine market trend directions for buy and sell operations. The strategy name "Price Volume Trend Strategy" reflects the idea of using price changes and volume changes to judge the trend.
Principles
The strategy first calculates the momentum of prices. By calculating the difference between the current period price and the previous period price, it can reflect the absolute change in prices over the latest period. A positive value indicates a price increase, and a negative value indicates a price decrease. Then the moving average of this difference value is calculated for filtering to obtain the average momentum indicator.
When the latest price is greater than the average momentum, it indicates that the price is rising. When the latest price is less than the average momentum, it indicates that the price is falling. Determine the price trend direction based on this indicator. Combined with volume amplification filtering, only signals with relatively large trading volumes are selected in actual trading.
According to the identified upward and downward price trends, corresponding buy and sell operations are carried out.
Advantage Analysis
- The strategy judges trends quickly and can quickly capture short-term price movements, which is suitable for short-term operations
- Avoid being misled by false breakouts through volume filtering
- Implemented the operating logic of chasing rises and killing falls
- High trading frequency, suitable for aggressive investors
Risk Analysis
- Vulnerable to the impact of abnormal market fluctuations, with certain false signal risks
- Slippage risks caused by frequent trading
- May miss medium and long term trends, and long-term profitability needs to be verified
Optimization Directions
- Adjust the parameters of momentum indicators to optimize judgment effects
- Optimize volume filtering parameters to improve signal quality
- Increase stop-loss mechanisms to control single loss
- Incorporate more factors to ensure multi-factor driven
Conclusion
The strategy overall tracks short-term price change trends through momentum indicators, and quickly determines entry and exit timing. The advantages are fast operation, chasing rises and killing falls. The disadvantages are signal quality and long-term profitability need to be examined. Through parameter adjustments and enhanced risk control mechanisms, the strategy can become an important component of high-frequency strategies, combined with other low-frequency strategies.
Parameters
| Name | Default | What it controls |
|---|---|---|
| v_input_1 | true | From Month |
| v_input_2 | true | From Day |
| v_input_3 | 2019 | From Year |
| v_input_4 | 12 | To Month |
| v_input_5 | 31 | To Day |
| v_input_6 | 2020 | To Year |
| v_input_7 | true | strength toggle |
| v_input_8 | 600 | strength elimination |
Source Pine Script
/*backtest
start: 2022-12-18 00:00:00
end: 2023-12-24 00:00:00
period: 1d
basePeriod: 1h
exchanges: [{"eid":"Futures_Binance","currency":"BTC_USDT"}]
*/

// This source code is subject to the terms of the Mozilla Public License 2.0 at https://mozilla.org/MPL/2.0/
// © russtic

//@version=2

strategy("HA smoothed eliminator v2  ",pyramiding=1, slippage=10, default_qty_type=strategy.percent_of_equity,
     commission_type=strategy.commission.percent, commission_value=0.075, overlay=true,
     default_qty_value=100, initial_capital=1000)

FromMonth1 = input(defval=1, title="From Month", minval=1, maxval=12)
FromDay1 = input(defval=1, title="From Day", minval=1, maxval=31)
FromYear1 = input(defval=2019, title="From Year", minval=2010)
ToMonth1 = input(defval=12, title="To Month", minval=1, maxval=12)
ToDay1 = input(defval=31, title="To Day", minval=1, maxval=31)
ToYear1 = input(defval=2020, title="To Year", minval=2010)
start1 = timestamp(FromYear1, FromMonth1, FromDay1, 00, 00)
finish1 = timestamp(ToYear1, ToMonth1, ToDay1, 23, 59)
window1() => true

t1 = time(timeframe.period, "0300-1200")
t2 = time(timeframe.period, "0930-1700")
London = na(t1) ? na : green
NY = na(t2) ? na : red

bgcolor(London, title="London")
bgcolor(NY, title="New York")
///////////////////////////
// HA smoothed

len=(1 )
o=ema(open,len)
c=ema(close,len)
h=ema(high,len)
l=ema(low,len)

haclose = (o+h+l+c)/4
haopen = na(haopen[1]) ? (o + c)/2 : (haopen[1] + haclose[1]) / 2
hahigh = max (h, max(haopen,haclose))
halow = min (l, min(haopen,haclose))

len2=(len)
o2=ema(haopen, len2)
c2=ema(haclose, len2)
h2=ema(hahigh, len2)
l2=ema(halow, len2)

buy= (o2<c2)

closebuy= (o2>c2)

sell= (o2>c2)

closesell= (o2<c2)

//
/// END NEW SCRIPT

//
//
//                  MERGE SCRIPTS
a1= o2<c2
b1=o2>c2
is_uptrend = (a1)// and (p> 0)
is_downtrend =  (b1)// and (p <0)
barcolor(b1 ? red: a1 ? lime : blue)

//end


// =========================start     PVT -GIVES EACH BAR A VALUE
facton = (true)//, title="arrow elimination (factor) on ")
Length1 = 2//input(2, title="PVT Length", minval=1)

xPrice = close//input(title="Source", type=source, defval=close)
xsma = wma(xPrice, Length1)
nRes = xPrice - xsma
pos = iff(nRes > 0, 1,
	     iff(nRes < 0, -1, nz(pos[1], 0)))
forex= input(true, title = 'strength toggle ')
forexyes = (forex == true)? 10000 : (forex == false)? 1: na

plot(nRes*forexyes , color=aqua, title="strength", transp=100)
// =========================         end pvt
//
//=============================     start factor // ELIMINATES  weak signals
//                  start trend
//
factor = input(600.00, title = "strength elimination")
factor1 = factor - (factor*2)//input(-100.00, title = "sell strength elimination ")
facton1 = (facton == true) and is_uptrend == 1 and nRes*forexyes>factor ? 1 : (facton == true) and is_downtrend == 1 and nRes*forexyes<factor1 ? -1 : (facton == false)
// ==================== =====
//
//===========================    end factor
nRestrend = (nRes*forexyes)
//=========================== plot arrows
plot1 = iff(is_uptrend[1] == 1, 0 , 1)
plot2 = iff(is_downtrend[1]  == 1, 0 , 1)
uparrowcond =  is_downtrend ? false : nz(uparrowcond[1], false) == true ? uparrowcond[1] : (facton1 and is_uptrend and nRes*forexyes>factor)
downarrowcond =  is_uptrend ? false : nz(downarrowcond[1], false) == true ? downarrowcond[1] : (facton1 and is_downtrend and nRes*forexyes<factor1)
//prevarrowstate = uparrowcond  ? 1 : downarrowcond ? -1 : nz(prevarrowstate[1], 0)


candledir = (open < close)? 1: (open>close)? -1 : na // ONLY OPENS ON SAME BAR DIRECTION AS SIGNAL


up=nz(uparrowcond[1], false) == false and ( is_uptrend and nRes*forexyes>factor) and candledir ? 1:na
dn=nz(downarrowcond[1], false) == false and ( is_downtrend and nRes*forexyes<factor1) and candledir? -1:na


sig=0
if up==1
    sig:=1
else
    if dn==-1
        sig:=-1
    else
        sig:=sig[1]
plotarrow(sig[1]!=1 and sig==1?1:na, title="BUY ARROW", colorup=lime, maxheight=80, minheight=50, transp=0)// up arrow
plotarrow(sig[1]!=-1 and sig==-1?-1:na, title="SELL ARROW", colordown=red, maxheight=80, minheight=50, transp=0)// down arrow

//========================= alert condition
alertcondition(sig[1]!=1 and sig==1?1:na, title="BUY eliminator", message="BUY " )
alertcondition(sig[1]!=-1 and sig==-1?-1:na, title="SELL eliminator",  message="SELL ")


strategy.entry("B", true, when=(sig[1]!=1 and sig==1?1:na) and window1())
strategy.entry("S", false,when=(sig[1]!=-1 and sig==-1?-1:na) and window1())
Published by ChaoZhang on the FMZ strategy square · last modified 2023-12-25. Collected in the Quant Trading Vault. Unvalidated research: re-test with your own data and costs before trusting it.
Build this with AgenKit
A spec is not a trading system. Paste this into your coding agent and AgenKit runs a specialist team — architecture, test-first build, risk gates, review — with paper trading on by default.
/agenkit build a production-grade trading bot with a backtest engine, risk controls and paper trading by default from strategies/Price-Volume-Trend-Strategy.md- npx agenkit install engineering-kit in your project
- Paste the command into your agent and approve each phase
- Get tests, backtest, risk controls and a paper-trading switch
Understand it first
Before you run this, read the lesson behind the idea and how to backtest it honestly. Specs like this one are the survivors of an unknown number of trials; deflate their results accordingly.
Related specs
- CM Multiple EMA Crossover StrategyPine Script · Trend following · 6h
- Dynamic Dual EMA Trend Following StrategyPine Script · Trend following · 1d
- EMA 200 Crossover with Volume and Trend StrategyPine Script · Trend following · 1d
- EMA SMA Trend Following with Swing Trading Strategy Combined Volume Filter and Percentage Take Profit Stop Loss SystemPine Script · Trend following · 1d
- Fixed Range Volume Profile And Anchored VWAP Trend Identification Strategy With Dynamic Stop LossPine Script · Trend following · 1h
- Multi Exponential Moving Average Crossover Strategy with Volume Based ATR Dynamic Stop Loss OptimizationPine Script · Trend following · 2d