Strategy vault / Mean reversion
Quant W Pattern Master Strategy
This strategy is named "Quant W Pattern Master Strategy". It combines the W pattern and high volume energy strategies to identify buying opportunities when the price W pattern coincides with high trading volumes…
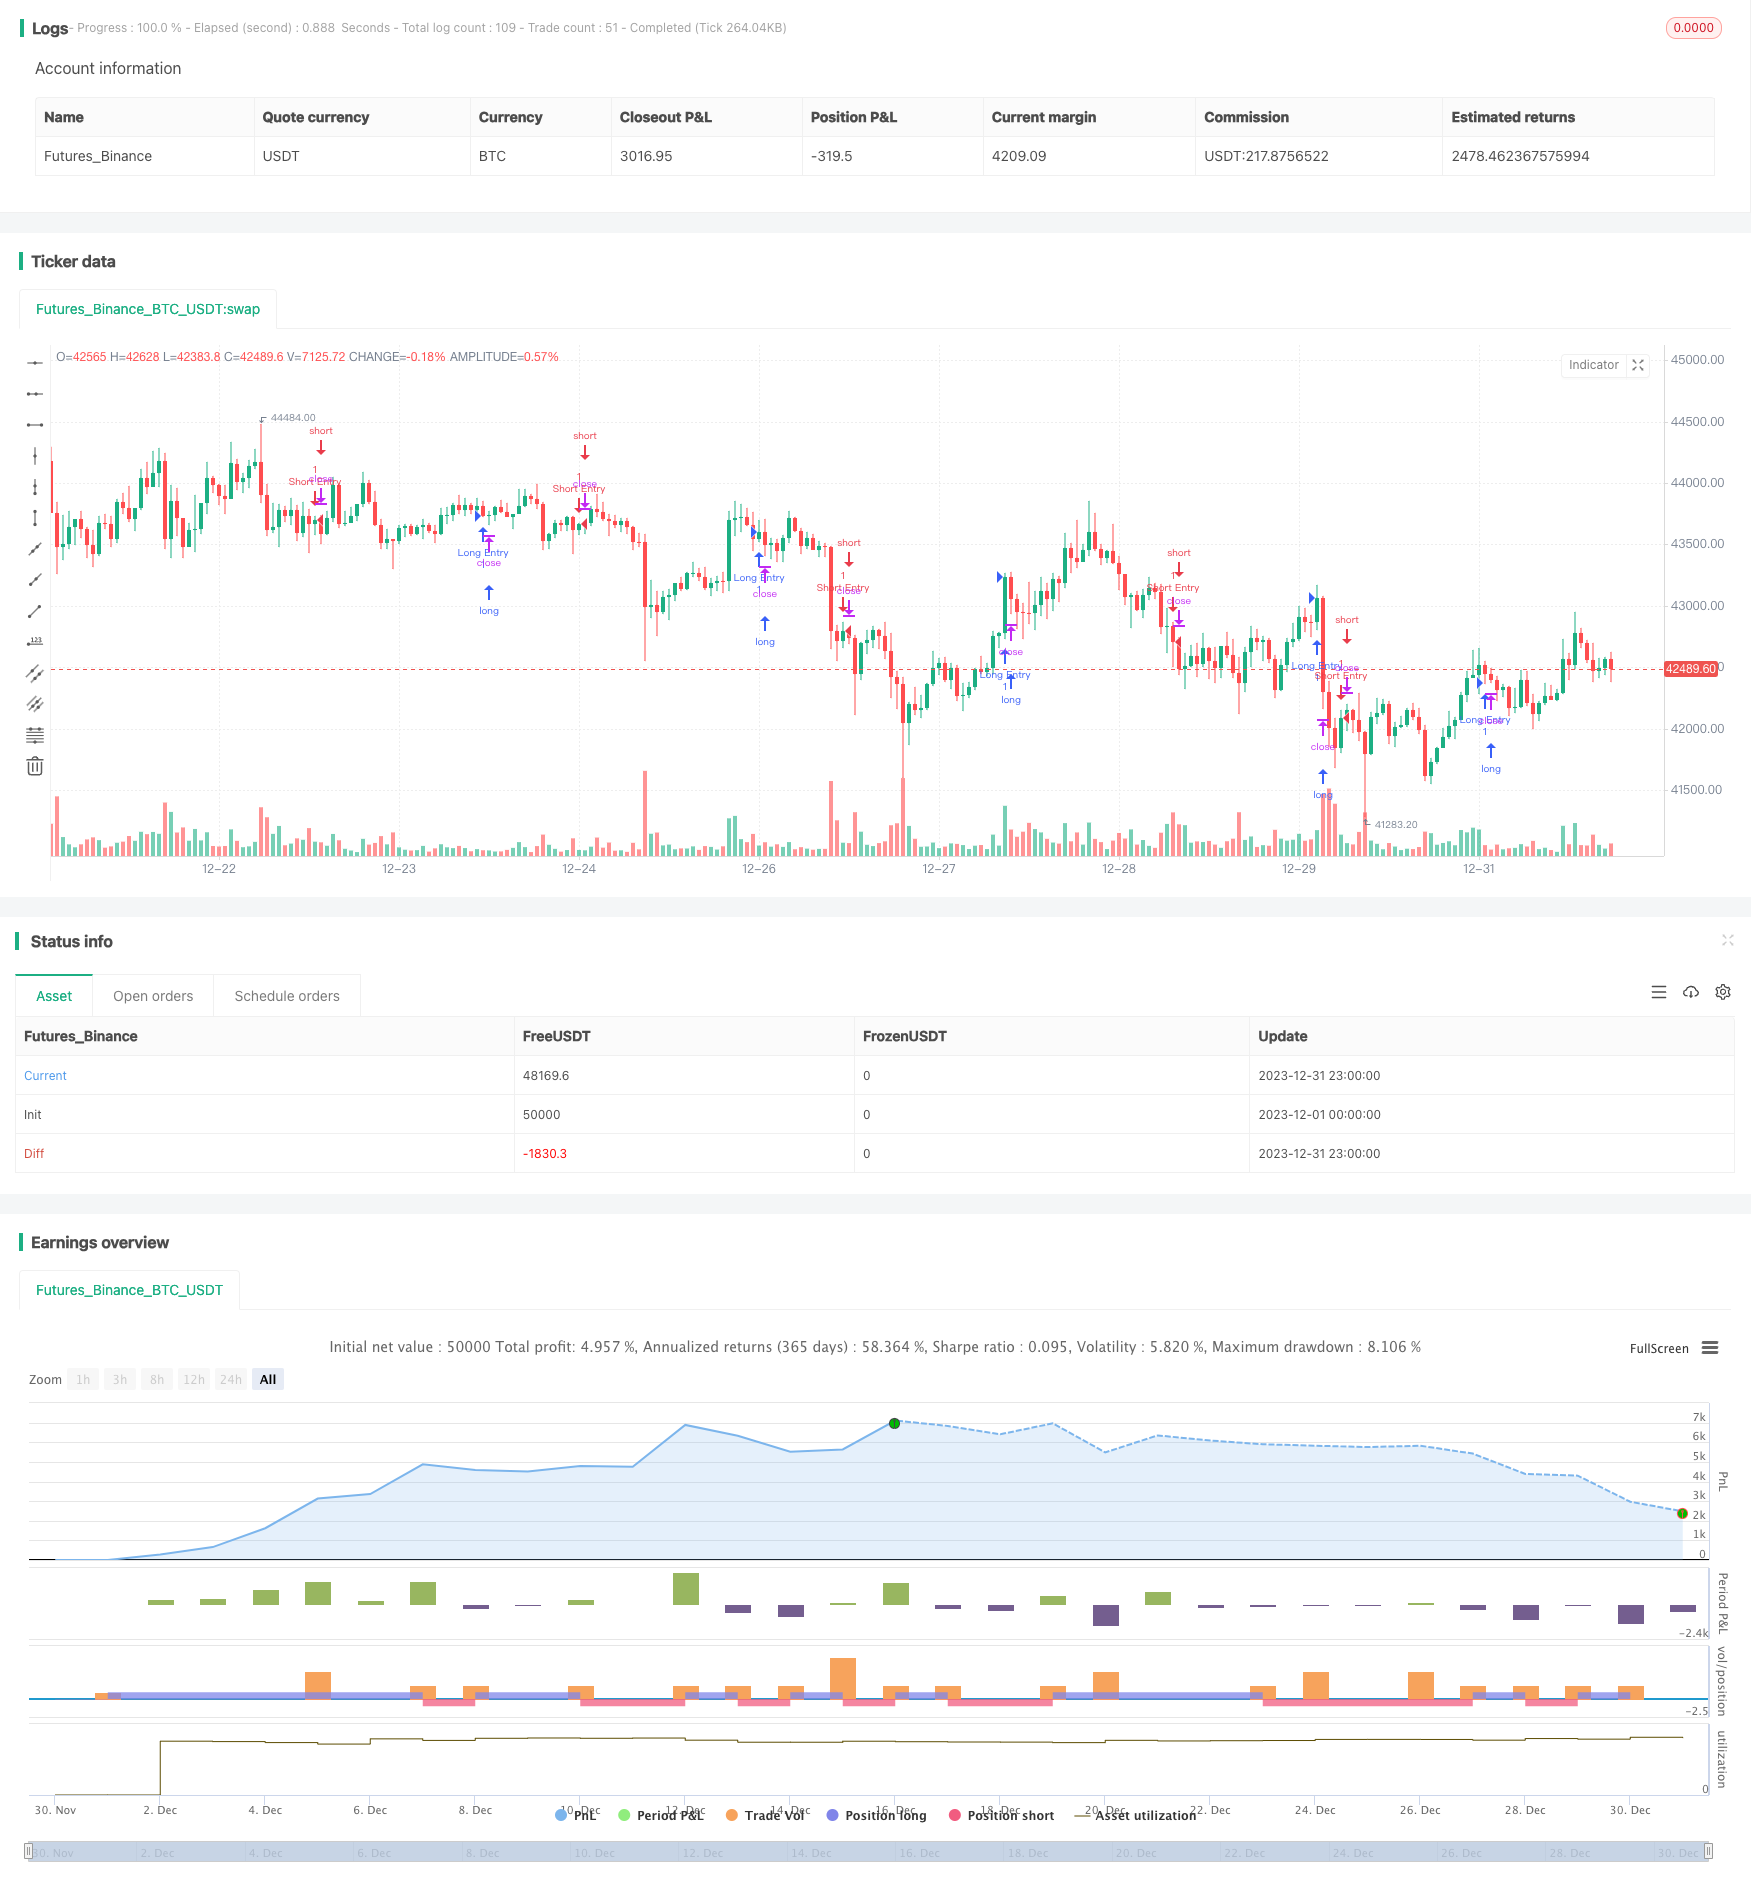
Overview
This strategy is named "Quant W Pattern Master Strategy". It combines the W pattern and high volume energy strategies to identify buying opportunities when the price W pattern coincides with high trading volumes through quantitative indicators.
Strategy Logic
This strategy mainly relies on two indicators for quantitative trading signals. The first one is the W pattern indicator, which identifies W patterns in price by the bullish crossover of the fast simple moving average (10 periods) crossing above the slow simple moving average (30 periods). The second one is the volume indicator, which compares the current volume to 2 times the simple moving average of volume (20 periods). If current volume is greater than 2 times the average, then high volume energy is identified. The strategy generates buy signals when the price W pattern coincides with high trading volume.
Specifically, the strategy identifies trading opportunities through the following steps:
Calculate the 10-period and 30-period simple moving averages;
Identify W pattern when the fast line crosses above the slow line, accompanied by a previous crossover in the opposite direction;
Calculate 20-period simple moving average of volume, recognize high volume when current volume is greater than 2 times the average;
Generate buy signals when W pattern and high volume occur together.
Through quantitative judgments based on multiple indicators, this strategy can effectively identify price reversal opportunities and form profitable trades.
Advantage Analysis
The biggest advantage of this strategy lies in the quantitative judgments based on multiple indicators, making trading signals more accurate and reliable. Specific advantages include:
W pattern indicator accurately identifies price reversals with high quality;
High volume verification avoids false signals and increases reliability;
Combination of multiple indicators makes the strategy more comprehensive and stereoscopic with higher win rate;
High flexibility for parameter tuning and optimization for different market environments.
In summary, this strategy successfully combines technical pattern with volume indicator through quantitative techniques to identify high-quality trading opportunities with strong reliability, wide adaptability and advanced concepts.
Risk Analysis
This strategy also carries some risks, mainly in the following aspects:
W pattern cannot perfectly predict price reversals, some false signals may exist;
High volume validation may also miss some opportunities and cannot identify all buying points;
Parameter settings like moving average periods need adjustments based on changing market environments, otherwise it will affect strategy performance;
No technical indicator can perfectly predict the market, and the multiple indicator approach cannot completely avoid losses.
To address the above risks, we can make further improvements from the following perspectives:
Add stop loss points to strictly control single trade loss;
Optimize parameter settings and adjust moving average periods etc;
Increase model ensemble approaches with more technical indicators;
Add risk management modules to adjust position sizes based on market regimes.
Optimization Directions
This strategy has room for further optimizations:
Parameter tuning: find optimal parameter combinations through more backtesting and scanning, e.g. moving average periods, volume multiplier etc;
Model ensemble: increase more technical indicators and ensemble models to improve stability;
Dynamic position sizing: build dynamic position management models based on market indicators to lower position sizes during high-risk environments;
Stop loss strategy: set proper stop loss points to control losses;
Backtest validation: test this strategy in more market conditions to verify robustness.
With continuous improvements in the above directions, the strategy's stability and profitability could be further enhanced.
Conclusion
The "Quant W Pattern Master Strategy" successfully combines price technical pattern with volume indicators through quantitative techniques to identify high-quality buying opportunities. The advantage lies in its comprehensive indicator combination, high reliability and wide adaptability. But some risks of false signals remain, requiring parameter tuning, ensemble models and dynamic position management to improve stability. As a representative multi-indicator quantitative trading strategy, with continuous optimizations it will become a powerful weapon for algorithmic trading.
Parameters
| Name | Default | What it controls |
|---|---|---|
| v_input_int_1 | 3 | W Bottom Depth |
| v_input_int_2 | 2 | Volume Multiplier |
Source Pine Script
/*backtest
start: 2023-12-01 00:00:00
end: 2023-12-31 23:59:59
period: 1h
basePeriod: 15m
exchanges: [{"eid":"Futures_Binance","currency":"BTC_USDT"}]
*/

//@version=5
strategy("Combined Strategy", overlay=true)

// Input parameters for the W pattern with high volume
wBottomDepth_W = input.int(3, title="W Bottom Depth", minval=1)
volumeMultiplier_W = input.int(2, title="Volume Multiplier", minval=1)

// Calculate moving averages for the W pattern
maShort = ta.sma(close, 10)
maLong = ta.sma(close, 30)

// Find W pattern
wBottom = ta.crossover(maShort, maLong) and ta.crossover(maShort[1], maLong[1])

// Check for high volume
isHighVolume = volume > volumeMultiplier_W * ta.sma(volume, 20)

// Strategy logic for the W pattern with high volume
if (wBottom and isHighVolume)
    strategy.entry("W Pattern Buy", strategy.long)

// Plot shapes to highlight W pattern and high volume
plotshape(series=wBottom and isHighVolume, title="W Bottom with High Volume", color=color.new(color.green, 0), style=shape.triangleup, location=location.belowbar, size=size.small)

// Strategy logic for the second strategy
longCondition_My = ta.crossover(ta.sma(close, 14), ta.sma(close, 28))
if (longCondition_My)
    strategy.entry("Long Entry", strategy.long)

shortCondition_My = ta.crossunder(ta.sma(close, 14), ta.sma(close, 28))
if (shortCondition_My)
    strategy.entry("Short Entry", strategy.short)
Published by ChaoZhang on the FMZ strategy square · last modified 2024-01-31. Collected in the Quant Trading Vault. Unvalidated research: re-test with your own data and costs before trusting it.
Build this with AgenKit
A spec is not a trading system. Paste this into your coding agent and AgenKit runs a specialist team — architecture, test-first build, risk gates, review — with paper trading on by default.
/agenkit build a production-grade trading bot with a backtest engine, risk controls and paper trading by default from strategies/Quant-W-Pattern-Master-Strategy.md- npx agenkit install engineering-kit in your project
- Paste the command into your agent and approve each phase
- Get tests, backtest, risk controls and a paper-trading switch
Understand it first
Before you run this, read the lesson behind the idea and how to backtest it honestly. Specs like this one are the survivors of an unknown number of trials; deflate their results accordingly.
Related specs
- 3 10 Oscillator Profile Flagging StrategyPine Script · Mean reversion · 1d
- A Trend Reversal Strategy Based on Moving Averages Price Patterns and VolumePine Script · Mean reversion · 1d
- Adaptive Mean Reversion Trading Strategy Based on Chande Momentum OscillatorPine Script · Mean reversion · 1d
- Adaptive Trading Strategy Combining Dynamic Trend Reversal and Stochastic IndicatorPine Script · Mean reversion · 1d
- Advanced 15 Minute Chart Trading Signal StrategyPine Script · Mean reversion · 3h
- Advanced Momentum EMA Trend Following with RSI Overbought Oversold Trading StrategyPine Script · Mean reversion · 1d