Quantitative Breakthrough Uptrend Reference Strategy
This strategy is a long-term holding strategy based on determining the trend direction with simple moving average lines and forming breakthrough signals with resistance and support lines. By calculating the price…
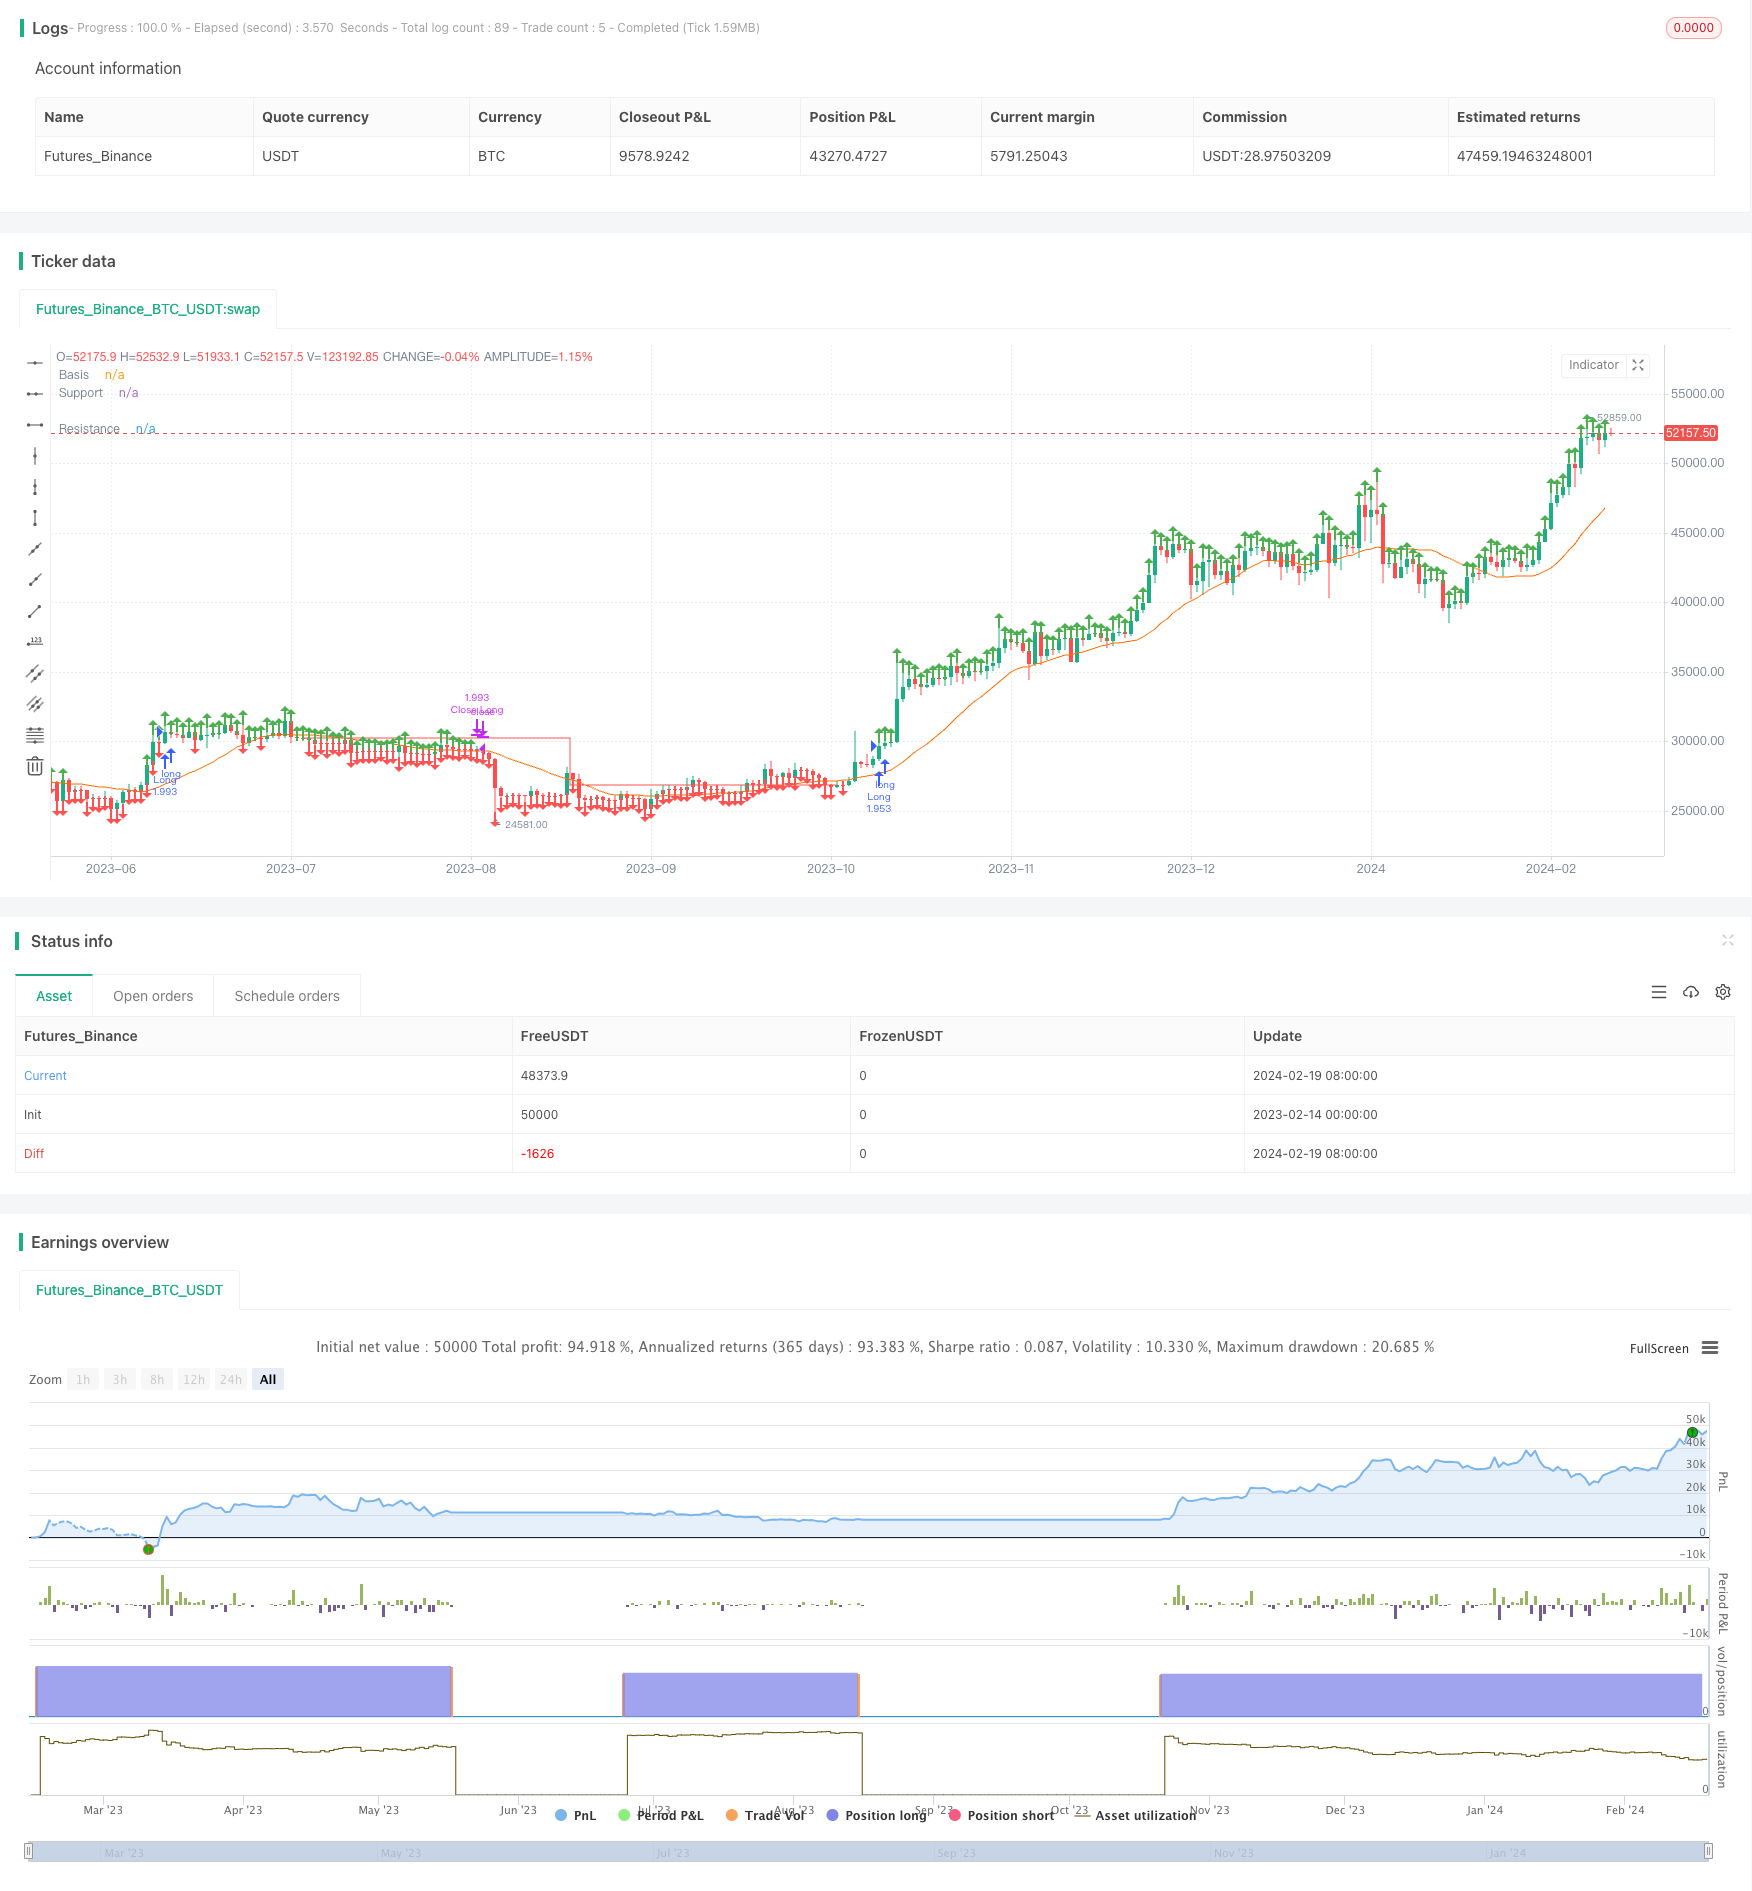
Overview
This strategy is a long-term holding strategy based on determining the trend direction with simple moving average lines and forming breakthrough signals with resistance and support lines. By calculating the price Pivot High and Pivot Low points, plotting the resistance and support lines, going long when the price breaks through the resistance line, and closing positions when the price breaks through the support line. This strategy is suitable for stocks with obvious trends and can obtain a good risk-reward ratio.
Strategy Principle
- Calculate the 20-day simple moving average line as the baseline for determining the trend
- Calculate the Pivot High and Pivot Low points based on user input parameters
- Plot the resistance and support lines based on the Pivot High and Pivot Low points
- Go long when the closing price is higher than the resistance line
- Close positions when the support line crosses below the resistance line
This strategy uses simple moving averages to determine the overall trend direction, and then uses key point breakthroughs to generate trading signals, which is a typical breakout strategy. By judging key points and trends, false breakouts can be effectively filtered out.
Advantage Analysis
- The strategy has sufficient opportunities and is suitable for high volatility stocks, making it easy to capture trends
- Good risk control for long positions, high risk-reward ratio
- Use breakthrough signals to avoid the risk of false breakouts
- Customizable parameters, high adaptability
Risk Analysis
- Rely on parameter optimization, improper parameters will increase the probability of false breakouts
- Delay in breakthrough signals, may miss some opportunities
- Easy to be stopped out in volatile markets
- Failure to adjust the support line in time may lead to losses
Risks can be reduced by optimizing parameters through live trading, and incorporating stop loss/take profit strategies.
Optimization Directions
- Optimize moving average period parameters
- Optimize resistance and support line parameters
- Add stop loss/take profit strategies
- Increase breakthrough confirmation mechanisms
- Filter signals with trading volume and other indicators
Summary
Overall, this strategy is a typical breakout strategy that relies on parameter optimization and liquidity, suitable for trend traders. As a reference framework, it can be extended according to actual needs by adding mechanisms like stop loss/take profit, signal filtering to reduce risk and improve stability.
Parameters
| Name | Default | What it controls |
|---|---|---|
| v_input_int_1 | 20 | length |
| v_input_1_close | 0 | Source: close | high | low | open | hl2 | hlc3 | hlcc4 | ohlc4 |
| v_input_int_2 | false | Offset |
| v_input_int_3 | 46 | LookbackLeft |
| v_input_int_4 | 32 | LookbackRight |
| v_input_float_1 | 2 | Take Profit |
| v_input_float_2 | 1.75 | Stop Loss |
Source Pine Script
/*backtest
start: 2023-02-14 00:00:00
end: 2024-02-20 00:00:00
period: 1d
basePeriod: 1h
exchanges: [{"eid":"Futures_Binance","currency":"BTC_USDT"}]
*/

// This source code is subject to the terms of the Mozilla Public License 2.0 at https://mozilla.org/MPL/2.0/
// © CheatCode1

//@version=5
strategy("Quantitative Trend Strategy- Uptrend long", 'Steady Uptrend Strategy', overlay=true, initial_capital = 1500, default_qty_value = 100, commission_type = strategy.commission.percent, commission_value = 0.01, default_qty_type = strategy.percent_of_equity)


length = input.int(20, minval=1)
src = input(close, title="Source")
basis = ta.sma(src, length)
offset = input.int(0, "Offset", minval = -500, maxval = 500)
plot(basis, "Basis", color=#FF6D00, offset = offset)

inp1 = input.int(46, 'LookbackLeft')
inp2 = input.int(32, 'LookbackRight')

l1 = ta.pivothigh(close, inp1, inp2)
S1 = ta.pivotlow(close, inp1, inp2)

// plot(l1, 'Pivothigh', color.red, 1)
// // plot(S1, 'Pivot Low', color.red)

l1V = ta.valuewhen(l1, close, 0)
S1V = ta.valuewhen(S1, close, 0)

Plotl1 = not na(l1) ? l1V : na
PlotS1 = not na(S1) ? S1V : na

plot(Plotl1, 'Resistance', color.green, 1, plot.style_stepline, true)
plot(PlotS1, 'Support', color.red, 1, plot.style_stepline, true)

Priceforlong = close > l1V ? true : na
Priceforshort = close < S1V ? true : na

plotshape(Priceforlong ? high : na, 'p', shape.arrowup, location.abovebar, color.green, size = size.small)
plotshape(Priceforshort ? low : na, 's', shape.arrowdown, location.belowbar, color.red, size = size.small)

vol = volume
volma = ta.sma(vol, 20)

Plotl1C = ta.valuewhen(na(Plotl1), l1V, 0)
PlotS1C = ta.valuewhen(na(PlotS1), S1V, 0)
//Strategy Execution
volc = volume > volma

Lc1 = Priceforlong

Sc1 = Priceforshort

sL = Plotl1 < PlotS1 ? close : na
sS = PlotS1 > Plotl1 ? close : na


if Lc1
    strategy.entry('Long', strategy.long)
// if Sc1 and C2
//     strategy.entry('Short', strategy.short)

if Priceforshort
    strategy.cancel('Long')
if Priceforlong
    strategy.cancel('Short')


// Stp1 = ta.crossover(k, d)
// Ltp1 = ta.crossunder(k, d)
// Ltp = d > 70  ? Ltp1 : na
// Stp = d < 30  ? Stp1 : na


if strategy.openprofit >= 0 and sL
    strategy.close('Long')
if strategy.openprofit >= 0 and sS
    strategy.close('Short')
takeP = input.float(2, title='Take Profit') / 100
stopL = input.float(1.75, title='Stop Loss') / 100


// // Pre Directionality

Stop_L = strategy.position_avg_price * (1 - stopL)

Stop_S = strategy.position_avg_price * (1 + stopL)

Take_S= strategy.position_avg_price * (1 - takeP)

Take_L = strategy.position_avg_price * (1 + takeP)

// sL = Plotl1 < PlotS1 ? close : na
// sS = PlotS1 < Plotl1 ? close : na

// //Post Excecution
if strategy.position_size > 0 and not (Lc1)
    strategy.exit("Close Long", stop = Stop_L, limit = Take_L)

if strategy.position_size < 0 and not (Sc1)
strategy.exit("Close Short", stop = Stop_S, limit = Take_S)Published by ChaoZhang on the FMZ strategy square · last modified 2024-02-21. Collected in the Quant Trading Vault. Unvalidated research: re-test with your own data and costs before trusting it.
Build this with AgenKit
A spec is not a trading system. Paste this into your coding agent and AgenKit runs a specialist team — architecture, test-first build, risk gates, review — with paper trading on by default.
/agenkit build a production-grade trading bot with a backtest engine, risk controls and paper trading by default from strategies/Quantitative-Breakthrough-Uptrend-Reference-Strategy.md- npx agenkit install engineering-kit in your project
- Paste the command into your agent and approve each phase
- Get tests, backtest, risk controls and a paper-trading switch
Understand it first
Before you run this, read the lesson behind the idea and how to backtest it honestly. Specs like this one are the survivors of an unknown number of trials; deflate their results accordingly.
Related specs
- Bollinger Bands Breakout Trading StrategyPine Script · Breakout · 1h
- Bollinger Bands Dynamic Breakout StrategyPine Script · Breakout · 1h
- Dynamic Support Resistance Breakout Moving Average Crossover StrategyPine Script · Breakout · 1d
- Exponential Moving Average Candle Stop Trading StrategyPine Script · Breakout · 1d
- Kana Candle Breakout Strategy Based on Moving Average and Support ResistancePine Script · Breakout · 1h
- Momentum Breakout Moving Average StrategyPine Script · Breakout · 1d