Strategy vault / Mean reversion
Quantitative Dual Factor Reversal Inertia Trading Strategy
The Quantitative Dual Factor Reversal Inertia Trading Strategy is a quantitative trading strategy that combines price reversal signals and market inertia signals. The strategy first uses the Stochastic indicator to…
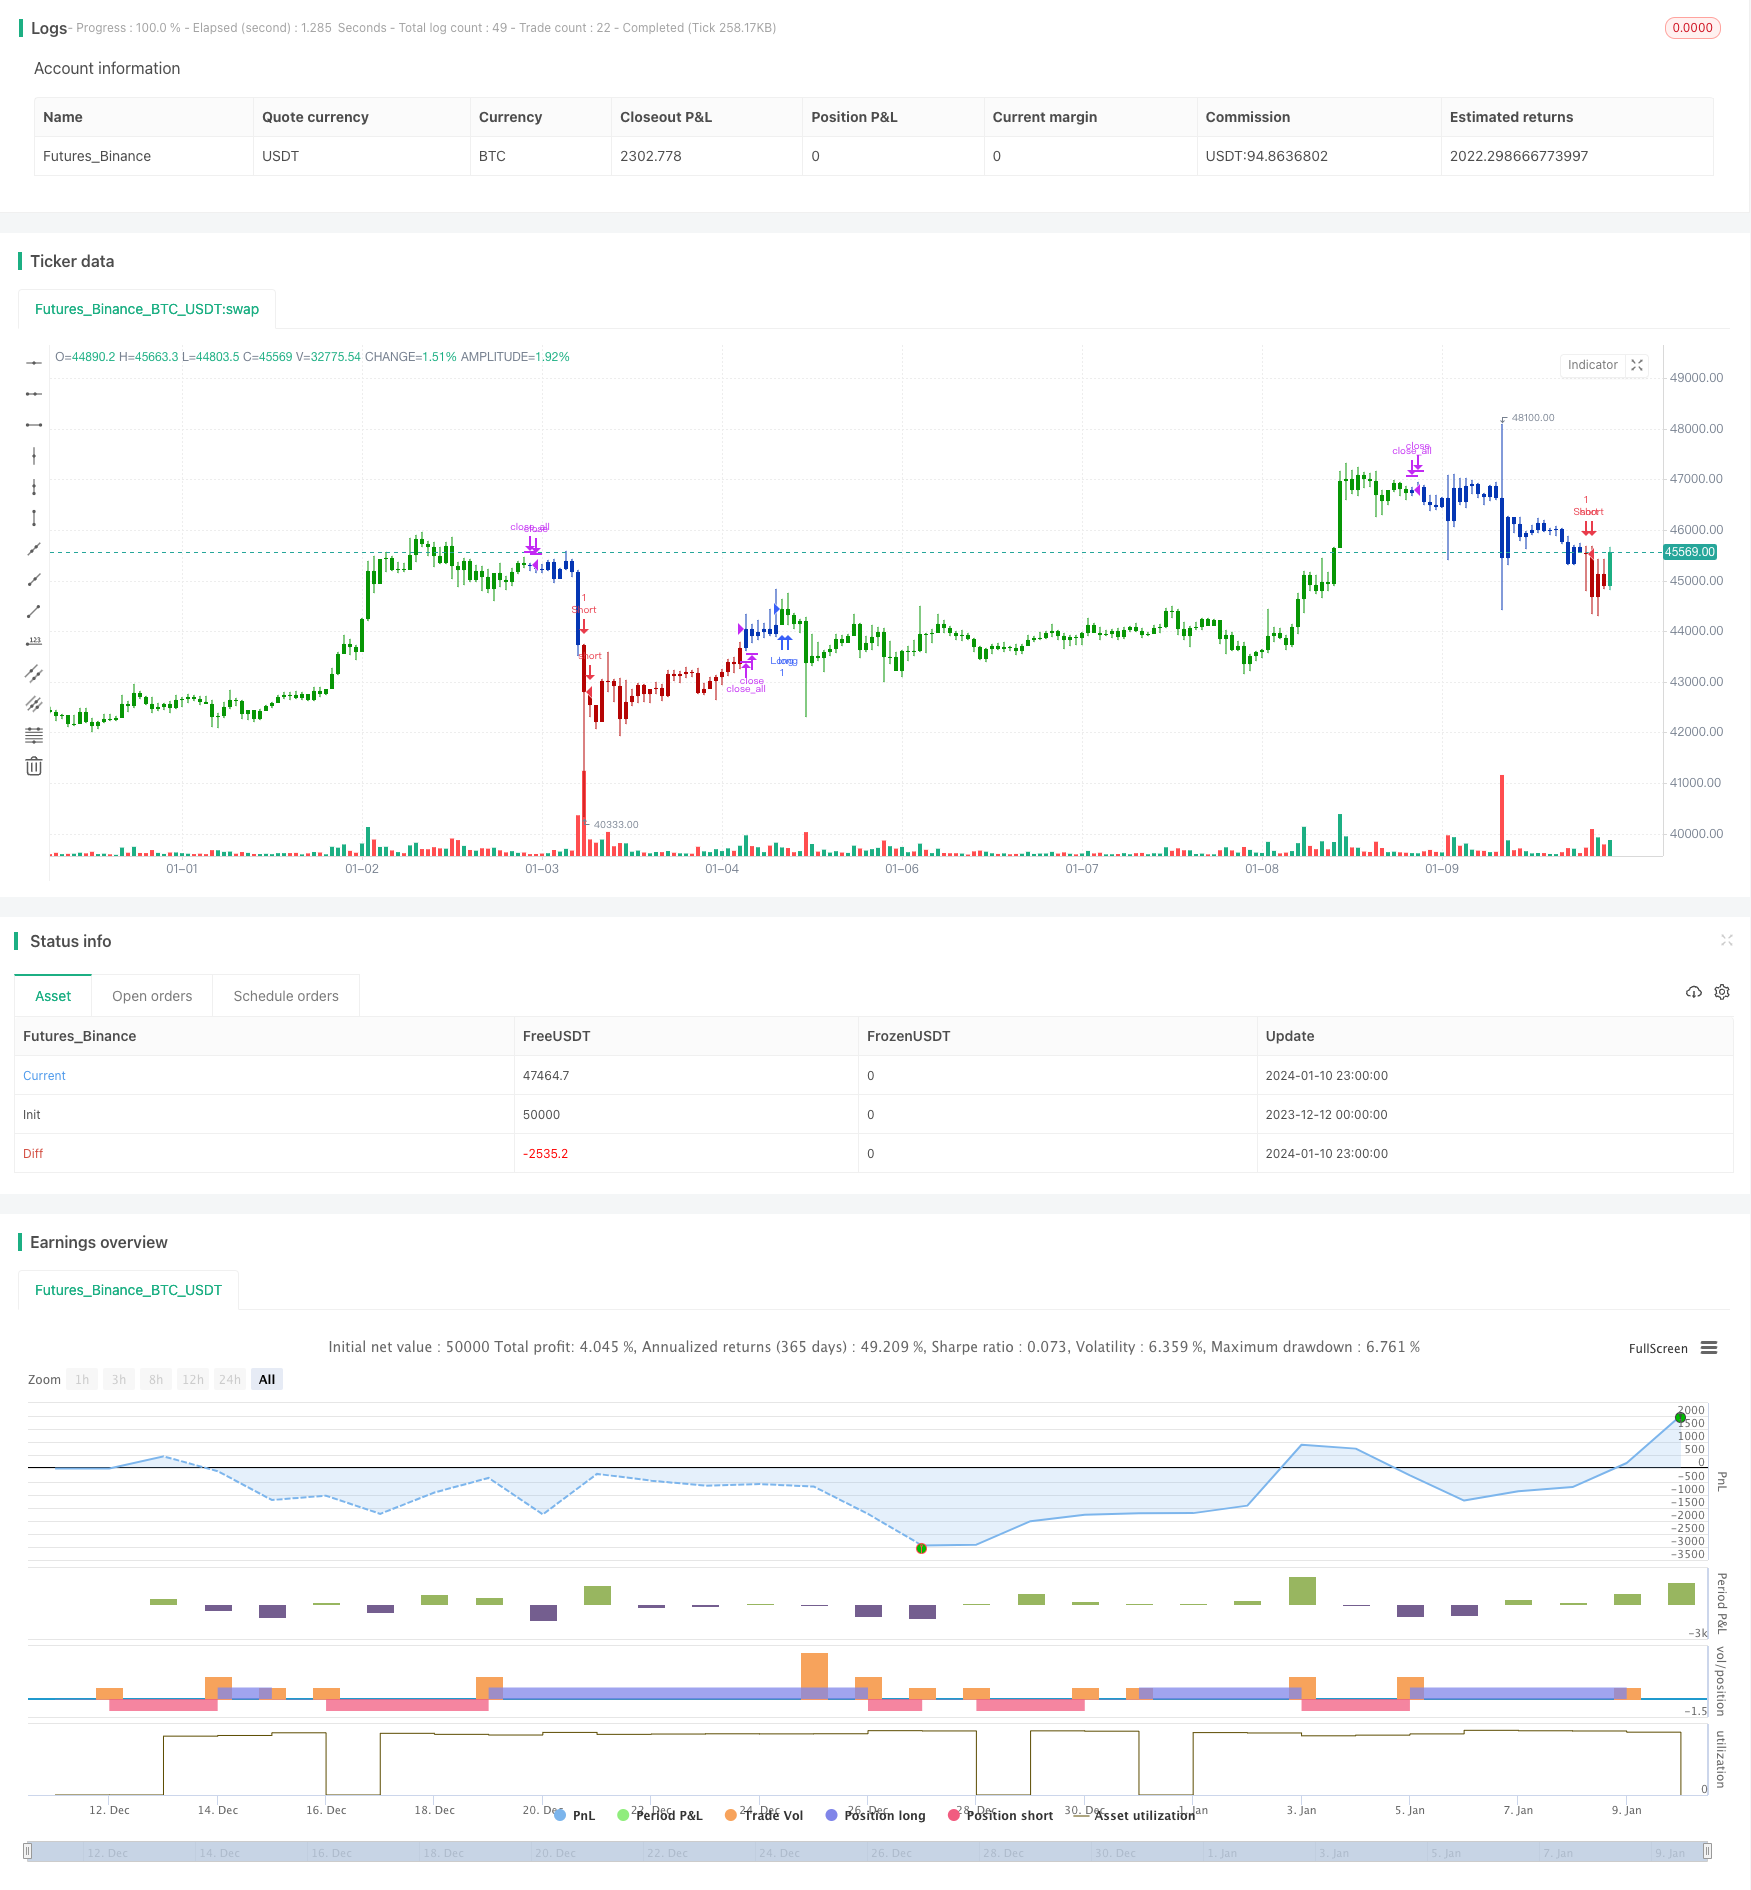
Overview
The Quantitative Dual Factor Reversal Inertia Trading Strategy is a quantitative trading strategy that combines price reversal signals and market inertia signals. The strategy first uses the Stochastic indicator to generate price reversal signals, then incorporates the market inertia signals from the Relative Volatility Index (RVI), and finally makes trading decisions driven by the dual factors.
Principles
The strategy consists of two main parts:
The price reversal part adopts the idea proposed by Ulf Jensen in his book, specifically: when the closing price rises continuously for 2 days and the 9-day Slow Stochastic is below 50, go long; when the closing price falls continuously for 2 days and the 9-day Fast Stochastic is above 50, go short.
The market inertia part uses the Relative Volatility Index (RVI). The value of this indicator fluctuates between 0 and 100. Above 50 indicates the long-term trend of the market is upward; below 50 indicates the long-term trend of the market is downward.
In summary, this strategy integrates price reversal signals and market inertia signals to finally determine the current market direction. Trading signals are generated when the signals from both parts align.
Advantage Analysis
The biggest advantage of this strategy is that it combines two major trading ideas – reversal and trend-following. Reversal signals can capture short-term corrections and provide trading opportunities. Inertia signals ensure opening positions only when long-term trends align to effectively filter out noise.
In addition, the dual-factor driven mechanism can improve signal quality. Optimizing the Stochastic parameters and smoothing the RVI also provide room for strategy optimization.
Risk Analysis
The main risks faced by this strategy include:
The risk that reversal signals are identified inaccurately. The reasonableness of parameters needs to be verified.
The risk that inertia signals generate incorrect signals. The RVI itself has a lag that requires adjusting the smoothing parameter.
The risk of missing trading opportunities due to poor alignment of timing of the dual-factor signals. The matching situation under different parameters needs testing.
In addition, reversal strategies face increased loss risks in trending markets. Strictly adhering to stop loss rules is necessary.
Optimization Directions
The strategy can be optimized in the following aspects:
Optimize the parameters of the Stochastic indicator to improve quality and timeliness of identifying reversal signals.
Optimize the smoothing parameter of the RVI indicator to increase the accuracy of inertia judgment.
Test different holding periods to determine the optimal holding cycle.
Incorporate stop loss mechanisms. Backtest different stop loss points to find the optimal stop loss position.
Consider incorporating other factor signals such as trading volume aberrations to form multi-factor driven strategies.
Summary
The Quantitative Dual Factor Reversal Inertia Trading Strategy comprehensively considers reversal and trend factors, using the Stochastic indicator and RVI indicator to generate trading signals. The strategy has advantages like dual-factor driven, capturing reversal opportunities, and signal filtering. It can be further improved through multi-faceted parameter optimization. Risk control through strict stop loss enforcement is also crucial. The strategy provides good ideas for quantitative trading.
Parameters
| Name | Default | What it controls |
|---|---|---|
| v_input_1 | 14 | Length |
| v_input_2 | true | KSmoothing |
| v_input_3 | 3 | DLength |
| v_input_4 | 50 | Level |
| v_input_5 | 10 | Period |
| v_input_6 | 14 | Smooth |
| v_input_7 | false | Trade reverse |
Source Pine Script
/*backtest
start: 2023-12-12 00:00:00
end: 2024-01-11 00:00:00
period: 1h
basePeriod: 15m
exchanges: [{"eid":"Futures_Binance","currency":"BTC_USDT"}]
*/

//@version=4
////////////////////////////////////////////////////////////
//  Copyright by HPotter v1.0 27/11/2020
// This is combo strategies for get a cumulative signal.
//
// First strategy
// This System was created from the Book "How I Tripled My Money In The
// Futures Market" by Ulf Jensen, Page 183. This is reverse type of strategies.
// The strategy buys at market, if close price is higher than the previous close
// during 2 days and the meaning of 9-days Stochastic Slow Oscillator is lower than 50.
// The strategy sells at market, if close price is lower than the previous close price
// during 2 days and the meaning of 9-days Stochastic Fast Oscillator is higher than 50.
//
// Second strategy
// The inertia indicator measures the market, stock or currency pair momentum and
// trend by measuring the security smoothed RVI (Relative Volatility Index).
// The RVI is a technical indicator that estimates the general direction of the
// volatility of an asset.
// The inertia indicator returns a value that is comprised between 0 and 100.
// Positive inertia occurs when the indicator value is higher than 50. As long as
// the inertia value is above 50, the long-term trend of the security is up. The inertia
// is negative when its value is lower than 50, in this case the long-term trend is
// down and should stay down if the inertia stays below 50.
//
// You can change long to short in the Input Settings
// Please, use it only for learning or paper trading. Do not for real trading.
//
// WARNING:
// - For purpose educate only
// - This script to change bars colors.
////////////////////////////////////////////////////////////
Reversal123(Length, KSmoothing, DLength, Level) =>
    vFast = sma(stoch(close, high, low, Length), KSmoothing)
    vSlow = sma(vFast, DLength)
    pos = 0.0
    pos := iff(close[2] < close[1] and close > close[1] and vFast < vSlow and vFast > Level, 1,
	         iff(close[2] > close[1] and close < close[1] and vFast > vSlow and vFast < Level, -1, nz(pos[1], 0)))
	pos

Inertia(Period, Smooth) =>
    pos = 0.0
    nU = 0.0
    nD = 0.0
    xPrice = close
    StdDev = stdev(xPrice, Period)
    d = iff(close > close[1], 0, StdDev)
    u = iff(close > close[1], StdDev, 0)
    nU := (13 * nz(nU[1],0) + u) / 14
    nD := (13 * nz(nD[1],0) + d) / 14
    nRVI = 100 * nU / (nU + nD)
    nRes = ema(nRVI, Smooth)
    pos :=iff(nRes > 50, 1,
    	   iff(nRes < 50, -1, nz(pos[1], 0)))
    pos

strategy(title="Combo Backtest 123 Reversal & Inertia Strategy", shorttitle="Combo", overlay = true)
Length = input(14, minval=1)
KSmoothing = input(1, minval=1)
DLength = input(3, minval=1)
Level = input(50, minval=1)
//-------------------------
Period = input(10, minval=1)
Smooth = input(14, minval=1)
reverse = input(false, title="Trade reverse")
posReversal123 = Reversal123(Length, KSmoothing, DLength, Level)
posInertia = Inertia(Period, Smooth)
pos = iff(posReversal123 == 1 and posInertia == 1 , 1,
	   iff(posReversal123 == -1 and posInertia == -1, -1, 0))
possig = iff(reverse and pos == 1, -1,
          iff(reverse and pos == -1 , 1, pos))
if (possig == 1)
    strategy.entry("Long", strategy.long)
if (possig == -1)
    strategy.entry("Short", strategy.short)
if (possig == 0)
    strategy.close_all()
barcolor(possig == -1 ? #b50404: possig == 1 ? #079605 : #0536b3 )Published by ChaoZhang on the FMZ strategy square · last modified 2024-01-12. Collected in the Quant Trading Vault. Unvalidated research: re-test with your own data and costs before trusting it.
Build this with AgenKit
A spec is not a trading system. Paste this into your coding agent and AgenKit runs a specialist team — architecture, test-first build, risk gates, review — with paper trading on by default.
/agenkit build a production-grade trading bot with a backtest engine, risk controls and paper trading by default from strategies/Quantitative-Dual-Factor-Reversal-Inertia-Trading-Strategy.md- npx agenkit install engineering-kit in your project
- Paste the command into your agent and approve each phase
- Get tests, backtest, risk controls and a paper-trading switch
Understand it first
Before you run this, read the lesson behind the idea and how to backtest it honestly. Specs like this one are the survivors of an unknown number of trials; deflate their results accordingly.
Related specs
- Advanced 15 Minute Chart Trading Signal StrategyPine Script · Mean reversion · 3h
- Dynamic Adaptive Multi Timeframe Trend Following and Range Reversal Hybrid StrategyPine Script · Mean reversion · 2d
- Multi Strategy Technical Analysis Trading SystemPine Script · Mean reversion · 1d
- Oma and Apollo Dual Rail Trading StrategyPine Script · Mean reversion · 5m
- Stochastic Moving Average StrategyPine Script · Mean reversion · 1h
- 3EMA with Stochastic RSI StrategyPine Script · Mean reversion · 1h