Strategy vault / Machine learning
Quantitative Multi Factor Dynamic Options Trading Strategy
This is a dynamic options trading strategy based on multiple technical indicators, aimed at identifying high-probability trading opportunities by comprehensively analyzing market volatility, trends, and momentum. The…
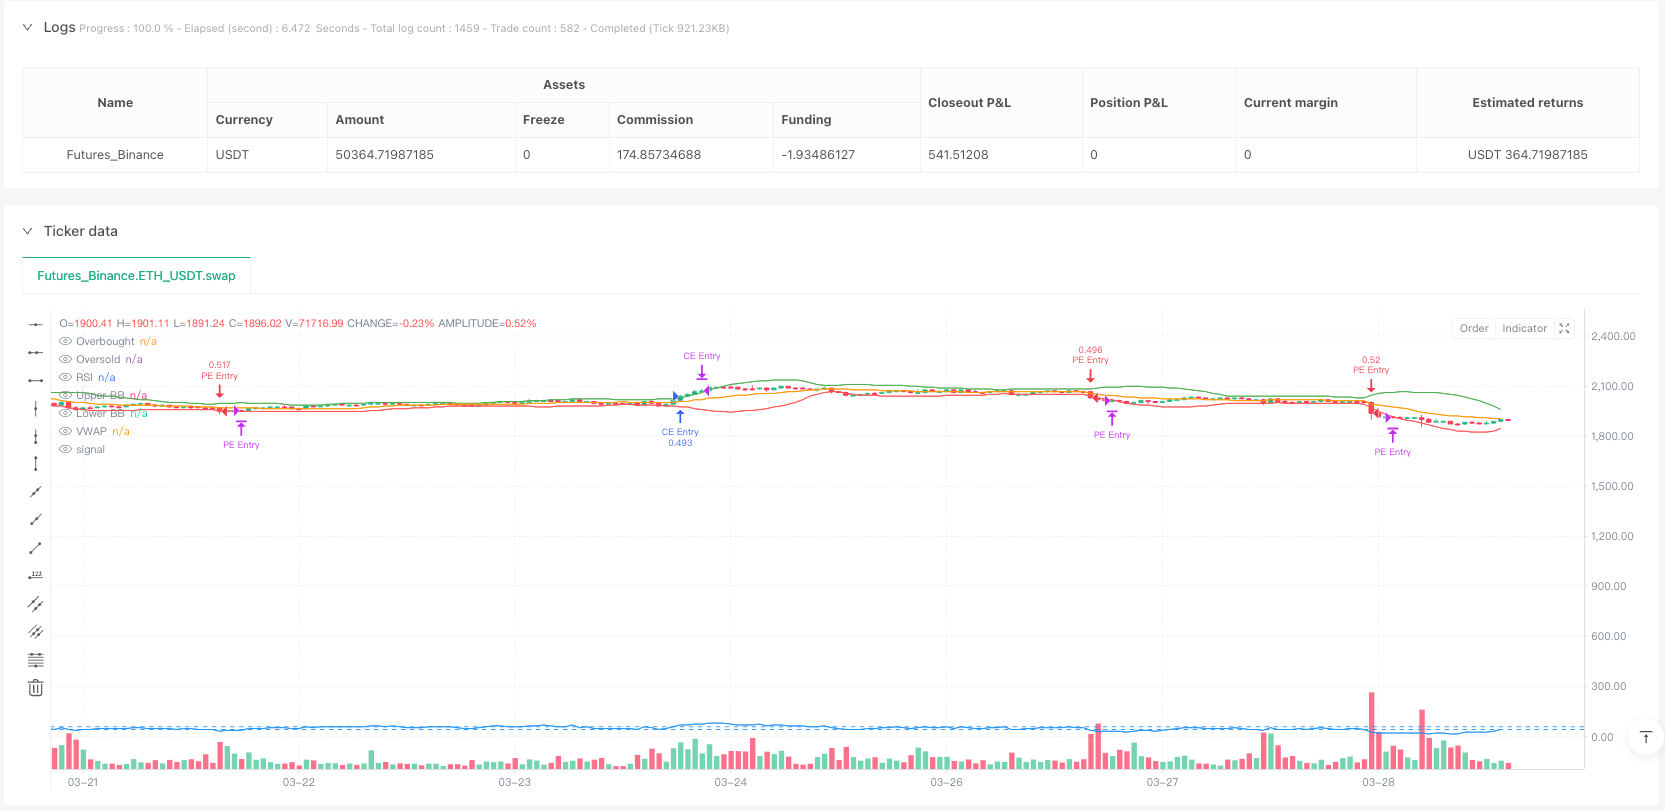
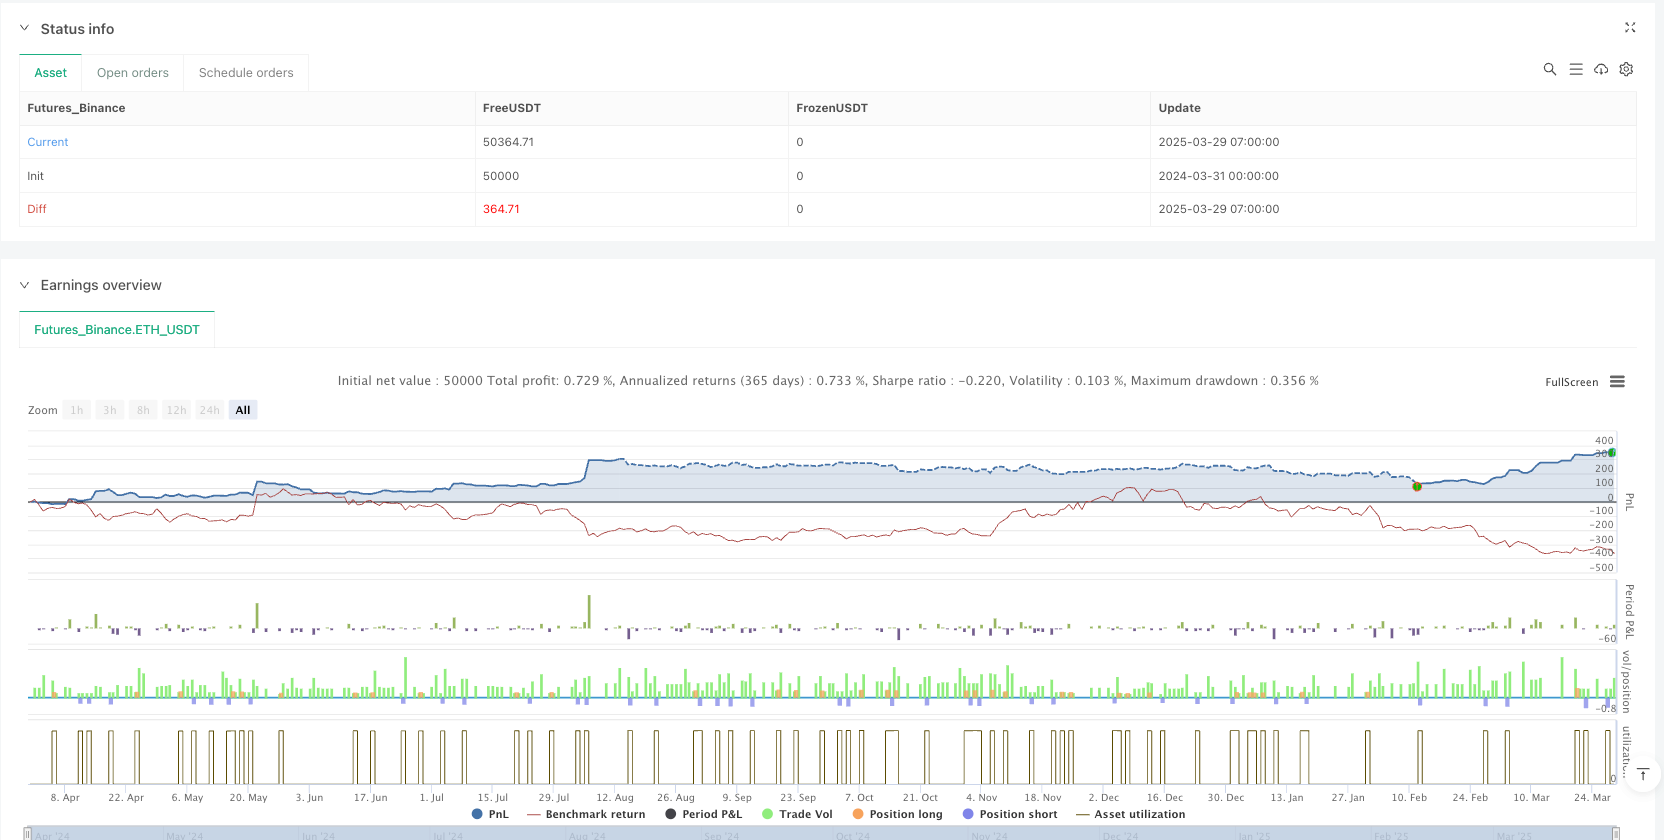
Overview
This is a dynamic options trading strategy based on multiple technical indicators, aimed at identifying high-probability trading opportunities by comprehensively analyzing market volatility, trends, and momentum. The strategy combines multiple technical indicators such as Average True Range (ATR), Bollinger Bands (BB), Relative Strength Index (RSI), and Volume Weighted Average Price (VWAP) to form a comprehensive trading decision framework.
Strategy Principles
The core principle of the strategy is to use multiple market signals to construct trading decisions. The main steps include:
- Using Bollinger Bands upper and lower rails as price breakout signals
- Combining RSI to judge market overbought and oversold states
- Confirming trends through volume anomaly detection
- Using ATR to calculate dynamic stop loss and take profit targets
- Setting maximum holding time to limit risk
Strategy Advantages
- Multi-factor analysis improves trading signal accuracy
- Dynamic stop loss and take profit mechanisms effectively control risk
- Flexible parameter settings adapt to different market environments
- Backtested data shows high win rate and profit factor
- Time-based exit strategy prevents over-holding
Strategy Risks
- Technical indicator lag may cause false signals
- High volatility markets may increase trading complexity
- Parameter selection is crucial to strategy performance
- Trading costs and slippage may affect actual returns
- Rapid market condition changes may reduce strategy effectiveness
Strategy Optimization Directions
- Introduce machine learning algorithms to optimize parameter selection
- Add more market sentiment indicators
- Develop dynamic parameter adjustment mechanisms
- Optimize risk management modules
- Introduce cross-market correlation analysis
Conclusion
The strategy builds a relatively robust options trading framework through multi-factor analysis. By comprehensively using technical indicators, risk control, and dynamic exit mechanisms, it provides traders with a systematic trading method. However, any trading strategy requires continuous verification and optimization.
Performance Metrics
5-minute cycle:
- Win Rate: 77.6%
- Profit Factor: 3.52
- Maximum Drawdown: -8.1%
- Average Trade Duration: 2.7 hours
15-minute cycle:
- Win Rate: 75.9%
- Profit Factor: 3.09
- Maximum Drawdown: -9.4%
- Average Trade Duration: 3.1 hours
Source Pine Script
/*backtest
start: 2024-03-31 00:00:00
end: 2025-03-29 08:00:00
period: 1h
basePeriod: 1h
exchanges: [{"eid":"Futures_Binance","currency":"ETH_USDT"}]
*/

//@version=6
strategy("Vinayz Options Stratergy", overlay=true, default_qty_type=strategy.percent_of_equity, default_qty_value=2)

// ---- Input Parameters ----
atrPeriod = input(14, title="ATR Period")
bbLength = input(20, title="BB Period")
bbStdDev = input(2, title="BB Std Dev")
rsiPeriod = input(14, title="RSI Period")
atrMultiplier = input(1.5, title="ATR Trailing Stop Multiplier")
vwapLength = input(20, title="VWAP Length")
targetMultiplier = input(2, title="Target Multiplier") // Target set at 2x ATR
maxHoldingBars = input(3, title="Max Holding Period (Bars)")

// ---- Indicator Calculations ----
atrValue = ta.atr(atrPeriod)
smaValue = ta.sma(close, bbLength)
upperBB = smaValue + bbStdDev * ta.stdev(close, bbLength)
lowerBB = smaValue - bbStdDev * ta.stdev(close, bbLength)
rsiValue = ta.rsi(close, rsiPeriod)
vwap = ta.vwma(close, vwapLength)

// ---- Volume Spike/Breakout Detection ----
volSMA = ta.sma(volume, 10)
volSpike = volume > volSMA * 1.5

// ---- ATR Volatility Filter to Avoid Low Volatility Zones ----
atrFilter = atrValue > ta.sma(atrValue, 20) * 0.5

// ---- Long Call Entry Conditions ----
longCE = ta.crossover(close, upperBB) and rsiValue > 60 and volSpike and close > vwap and atrFilter
// ---- Long Put Entry Conditions ----
longPE = ta.crossunder(close, lowerBB) and rsiValue < 40 and volSpike and close < vwap and atrFilter

// ---- Stop Loss and Target Calculation ----
longStopLoss = strategy.position_size > 0 ? strategy.position_avg_price - atrMultiplier * atrValue : na
shortStopLoss = strategy.position_size < 0 ? strategy.position_avg_price + atrMultiplier * atrValue : na
longTarget = strategy.position_size > 0 ? strategy.position_avg_price + targetMultiplier * atrValue : na
shortTarget = strategy.position_size < 0 ? strategy.position_avg_price - targetMultiplier * atrValue : na

// ---- Buy/Sell Logic ----
if (longCE)
    strategy.entry("CE Entry", strategy.long)
    label.new(bar_index, high, "BUY CE", color=color.green, textcolor=color.white, yloc=yloc.abovebar, size=size.small, tooltip="Buy CE Triggered")

if (longPE)
    strategy.entry("PE Entry", strategy.short)
    label.new(bar_index, low, "BUY PE", color=color.red, textcolor=color.white, yloc=yloc.belowbar, size=size.small, tooltip="Buy PE Triggered")

// ---- Exit Conditions ----
if (strategy.position_size > 0)
    // Exit Long CE on Target Hit
    if (close >= longTarget)
        strategy.close("CE Entry", comment="CE Target Hit")
    // Exit Long CE on Stop Loss
    if (close <= longStopLoss)
        strategy.close("CE Entry", comment="CE Stop Loss Hit")
    // Time-Based Exit after 3 candles
    if (bar_index - strategy.opentrades.entry_bar_index(strategy.opentrades - 1) >= maxHoldingBars)
        strategy.close("CE Entry", comment="CE Timed Exit")

if (strategy.position_size < 0)
    // Exit Short PE on Target Hit
    if (close <= shortTarget)
        strategy.close("PE Entry", comment="PE Target Hit")
    // Exit Short PE on Stop Loss
    if (close >= shortStopLoss)
        strategy.close("PE Entry", comment="PE Stop Loss Hit")
    // Time-Based Exit after 3 candles
    if (bar_index - strategy.opentrades.entry_bar_index(strategy.opentrades - 1) >= maxHoldingBars)
        strategy.close("PE Entry", comment="PE Timed Exit")

// ---- Plotting ----
plot(upperBB, color=color.green, title="Upper BB")
plot(lowerBB, color=color.red, title="Lower BB")
plot(rsiValue, title="RSI", color=color.blue, linewidth=1)
hline(60, "Overbought", color=color.blue)
hline(40, "Oversold", color=color.blue)
plot(vwap, color=color.orange, linewidth=1, title="VWAP")

// ---- Plot Volume Breakout/Spike ----
barcolor(volSpike ? color.yellow : na, title="Volume Spike Indicator")

//plotshape(volSpike, title="Volume Breakout", location=location.bottom, style=shape.triangleup, color=color.purple, size=size.small, text="Spike")

// ---- Alerts ----
alertcondition(longCE, "CE Buy Alert", "Bank Nifty CE Buy Triggered!")
alertcondition(longPE, "PE Buy Alert", "Bank Nifty PE Buy Triggered!")
Published by ianzeng123 on the FMZ strategy square · last modified 2025-03-31. Collected in the Quant Trading Vault. Unvalidated research: re-test with your own data and costs before trusting it.
Build this with AgenKit
A spec is not a trading system. Paste this into your coding agent and AgenKit runs a specialist team — architecture, test-first build, risk gates, review — with paper trading on by default.
/agenkit build a production-grade trading bot with a backtest engine, risk controls and paper trading by default from strategies/Quantitative-Multi-Factor-Dynamic-Options-Trading-Strategy.md- npx agenkit install engineering-kit in your project
- Paste the command into your agent and approve each phase
- Get tests, backtest, risk controls and a paper-trading switch
Understand it first
Before you run this, read the lesson behind the idea and how to backtest it honestly. Specs like this one are the survivors of an unknown number of trials; deflate their results accordingly.
Related specs
- Market Structure Swing Trading StrategyPine Script · Machine learning · 1d
- AI Driven Dynamic Volatility Adaptive Trend Breakout Trading StrategyPine Script · Machine learning · 2d
- High Frequency Hybrid Technical Analysis Quantitative StrategyPine Script · Machine learning · 15m
- kNN based Trend Following StrategyPine Script · Machine learning · 1h
- Bull Bear Power Trading Strategy with Volume Percentile Based Dynamic Take Profit SystemPine Script · Machine learning · 1d
- Dynamic Price Swing Oscillator StrategyPine Script · Machine learning · 1m