Strategy vault / Mean reversion
Quantitative Qualitative Estimation
The QQE indicator is a momentum based indicator to determine trend and sideways. The Qualitative Quantitative Estimation (QQE) indicator works like a smoother version of the popular Relative Strength Index ( RSI )…
The QQE indicator is a momentum based indicator to determine trend and sideways.
The Qualitative Quantitative Estimation (QQE) indicator works like a smoother version of the popular Relative Strength Index ( RSI ) indicator. QQE expands on RSI by adding two volatility based trailing stop lines. These trailing stop lines are composed of a fast and a slow moving Average True Range (ATR). These ATR lines are smoothed making this indicator less susceptible to short term volatility .
The most common method of using QQE is to look for crosses of the fast and slow moving trailing stop lines during periods when the QQE line reflects overbought or oversold conditions
Qualitative Quantitative Estimation made up of a smoothed Relative Strength Index ( RSI ) indicator plus fast and slow volatility-based trailing levels.
Qualitative Quantitative Estimation can be used in two directions:
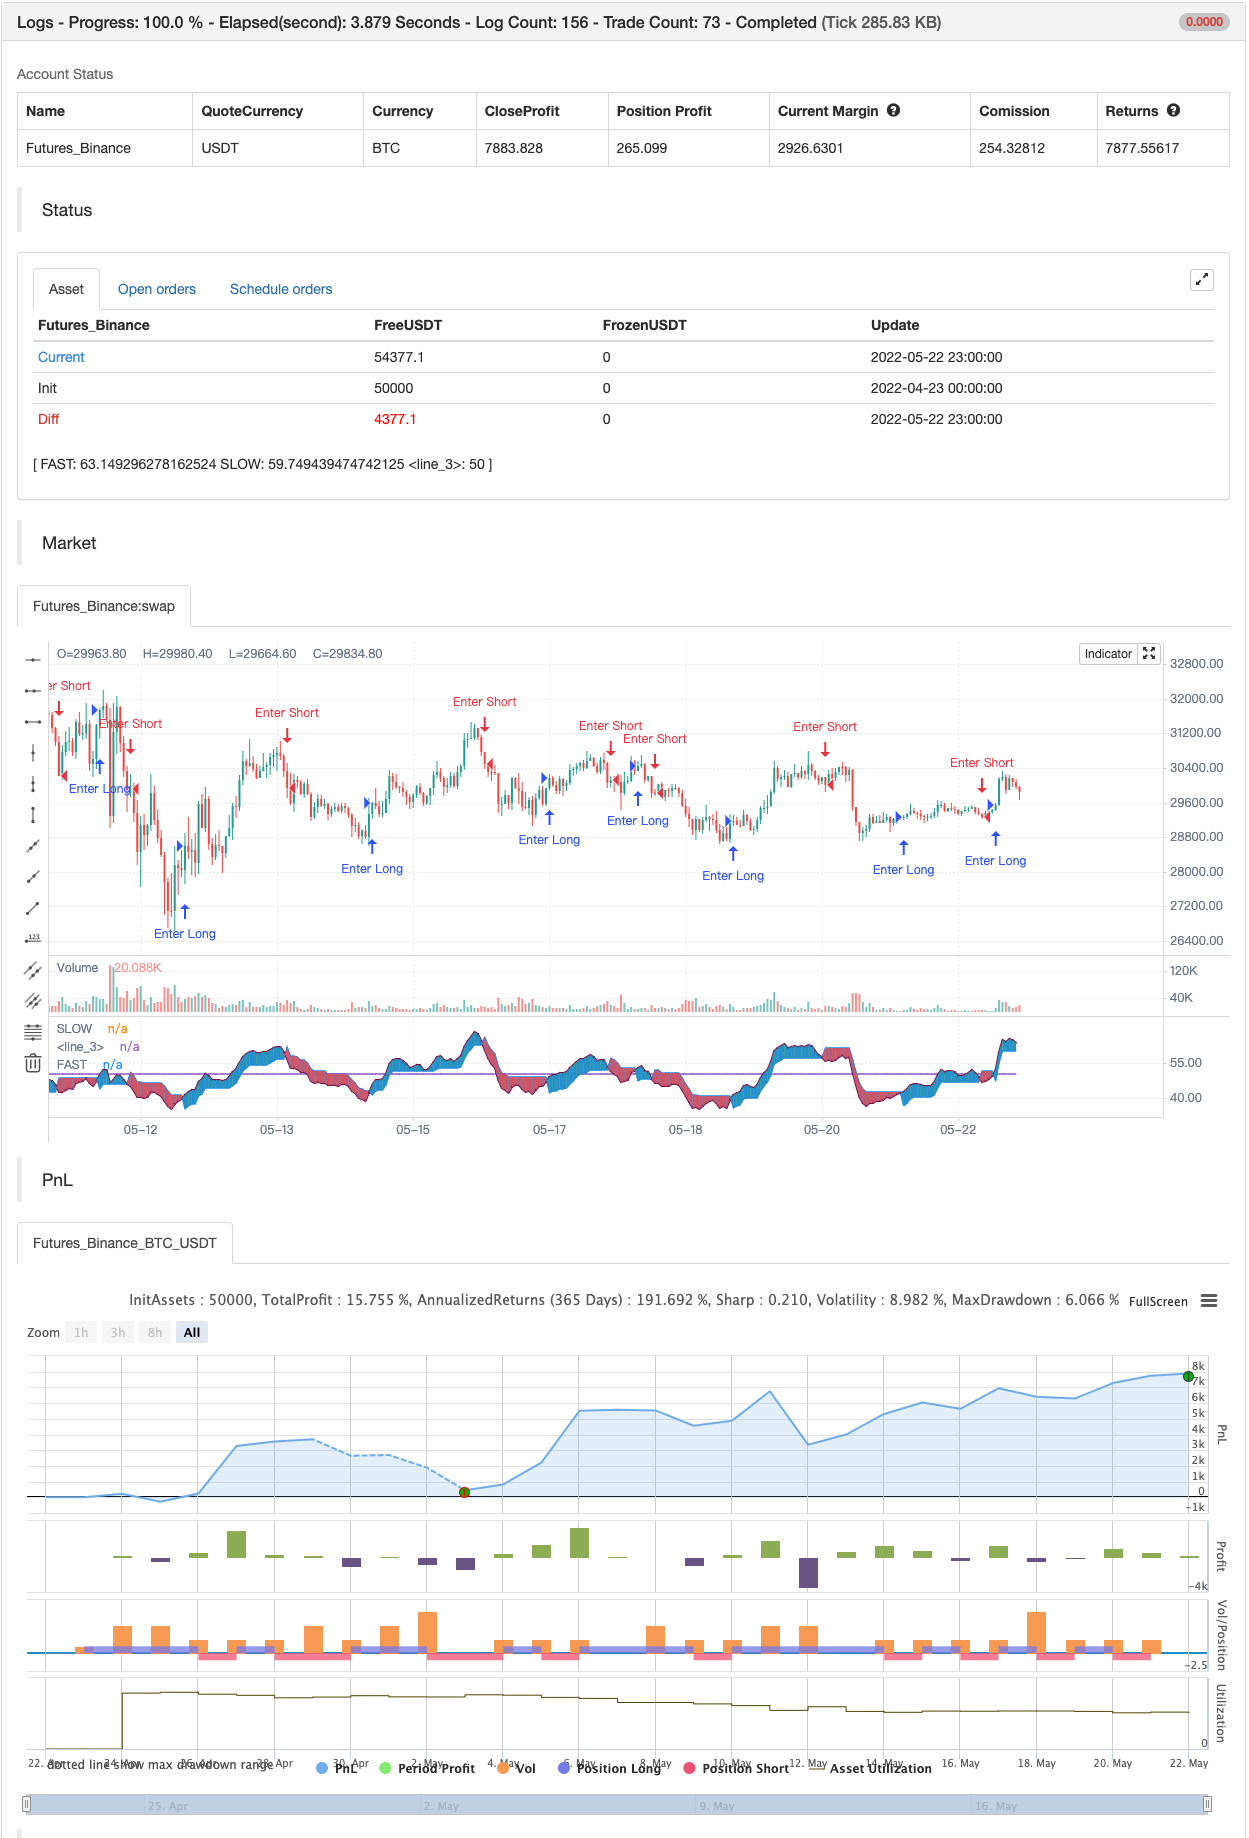
1.Determine the trend, i.e. if the line is above the 50 level, the trend is ascending, if below - descending; 2.Search for signals at the moment of crossing of the QQE FAST (maroon) and QQE SLOW (blue) lines.
The QQE itself is generally considered to indicate an up-trend ifQQE FAST is above QQE SLOW, and a down-trend if below QQE SLOW. Often a middle-range between 40 and 60 is set and if the indicator is in that range, then the market is considered to be tracking sideways, or in no trend.
You will need to set only one parameter – "SF" "RSI SMoothing Factor", an analogue of the period in RSI . By the way, judging from the open source information, the algorithm used the standard strength index with a period of 14 for calculations.
Various signals can be created from the indicator such as: -Buy when QQE FAST crosses above QQE SLOW below 50 level or just buy when QQE lines crosses above 50 level. -Sell when QQE FAST crosses below QQE SLOW above 50 level or just sell when QQE lines crosses below 50 level.
WARNING: QQE IS A RSI BASED INDICATOR SO THAT IT CAN TRIGGER FALSE SIGNALS DURING DIVERGENCES!
Kıvanç Özbilgiç
backtest
Parameters
| Name | Default | What it controls |
|---|---|---|
| v_input_1_close | 0 | src: close | high | low | open | hl2 | hlc3 | hlcc4 | ohlc4 |
| v_input_2 | 14 | RSI Length |
| v_input_3 | 5 | SF RSI SMoothing Factor |
| v_input_4 | true | Show Crossing Signals? |
| v_input_5 | true | Highlighter On/Off ? |
Source Pine Script
/*backtest
start: 2022-04-23 00:00:00
end: 2022-05-22 23:59:00
period: 1h
basePeriod: 15m
exchanges: [{"eid":"Futures_Binance","currency":"BTC_USDT"}]
*/

// This source code is subject to the terms of the Mozilla Public License 2.0 at https://mozilla.org/MPL/2.0/
// © KivancOzbilgic

//@version=4
study("Quantitative Qualitative Estimation", shorttitle="QQE",precision=4, resolution="")
src=input(close)
length = input(14,"RSI Length", minval=1)
SSF=input(5, "SF RSI SMoothing Factor", minval=1)
showsignals = input(title="Show Crossing Signals?", type=input.bool, defval=true)
highlighting = input(title="Highlighter On/Off ?", type=input.bool, defval=true)
RSII=ema(rsi(src,length),SSF)
TR=abs(RSII-RSII[1])
wwalpha = 1/ length
WWMA = 0.0
WWMA := wwalpha*TR + (1-wwalpha)*nz(WWMA[1])
ATRRSI=0.0
ATRRSI := wwalpha*WWMA + (1-wwalpha)*nz(ATRRSI[1])
QQEF=ema(rsi(src,length),SSF)
QUP=QQEF+ATRRSI*4.236
QDN=QQEF-ATRRSI*4.236
QQES=0.0
QQES:=QUP<nz(QQES[1]) ? QUP : QQEF>nz(QQES[1]) and QQEF[1]<nz(QQES[1]) ? QDN :  QDN>nz(QQES[1]) ? QDN : QQEF<nz(QQES[1]) and QQEF[1]>nz(QQES[1]) ? QUP : nz(QQES[1])
QQF=plot(QQEF,"FAST",color.maroon,2)
QQS=plot(QQES,"SLOW",color=color.blue, linewidth=1)
plot(50,color=color.gray,style=6)
longFillColor = highlighting ? (QQEF>QQES ? color.green : na) : na
shortFillColor = highlighting ? (QQEF<QQES ? color.red : na) : na
fill(QQF, QQS, title="UpTrend Highligter", color=longFillColor)
fill(QQF, QQS, title="DownTrend Highligter", color=shortFillColor)
buySignalr = crossover(QQEF, QQES)
plotshape(buySignalr and showsignals ? QQES*0.995 : na, title="Buy", text="Buy", location=location.absolute, style=shape.labelup, size=size.tiny, color=color.green, textcolor=color.white, transp=0)
sellSignallr = crossunder(QQEF, QQES)
plotshape(sellSignallr and showsignals ? QQES*1.005 : na, title="Sell", text="Sell", location=location.absolute, style=shape.labeldown, size=size.tiny, color=color.red, textcolor=color.white, transp=0)

alertcondition(cross(QQEF, QQES), title="Cross Alert", message="QQE Crossing Signal!")
alertcondition(crossover(QQEF, QQES), title="Crossover Alarm", message="QQE BUY SIGNAL!")
alertcondition(crossunder(QQEF, QQES), title="Crossunder Alarm", message="QQE SELL SIGNAL!")
alertcondition(crossover(QQEF, 50), title="Cross 50 Up Alert", message="QQE FAST Crossing 50 UP!")
alertcondition(crossunder(QQEF, 50), title="Cross 50 Down Alert", message="QQE FAST Crossing 50 DOWN!")

if buySignalr and showsignals
    strategy.entry("Enter Long", strategy.long)
else if sellSignallr and showsignals
    strategy.entry("Enter Short", strategy.short)
Published by ChaoZhang on the FMZ strategy square · last modified 2022-05-24. Collected in the Quant Trading Vault. Unvalidated research: re-test with your own data and costs before trusting it.
Build this with AgenKit
A spec is not a trading system. Paste this into your coding agent and AgenKit runs a specialist team — architecture, test-first build, risk gates, review — with paper trading on by default.
/agenkit build a production-grade trading bot with a backtest engine, risk controls and paper trading by default from strategies/Quantitative-Qualitative-Estimation.md- npx agenkit install engineering-kit in your project
- Paste the command into your agent and approve each phase
- Get tests, backtest, risk controls and a paper-trading switch
Understand it first
Before you run this, read the lesson behind the idea and how to backtest it honestly. Specs like this one are the survivors of an unknown number of trials; deflate their results accordingly.
Related specs
- ATR and EMA based Dynamic Take Profit and Stop Loss Adaptive StrategyPine Script · Mean reversion · 1h
- Advanced Momentum EMA Trend Following with RSI Overbought Oversold Trading StrategyPine Script · Mean reversion · 1d
- Customizable Non Repainting HTF MACD MFI Scalable Bot StrategyPine Script · Mean reversion · 1d
- Dynamic Adaptive Multi Timeframe Trend Following and Range Reversal Hybrid StrategyPine Script · Mean reversion · 2d
- Improved RSI MACD Moving Average StrategyPine Script · Mean reversion · 1d
- MACD Cross Period Trading StrategyPine Script · Mean reversion · 1d