Strategy vault / Mean reversion
Quantitative Trading Dual Indicator Strategy
The strategy is named "Quantitative Trading Dual Indicator Strategy". It utilizes both Bollinger Bands and the Relative Strength Index (RSI) as trading signals to implement a dual indicator filtered trading strategy.
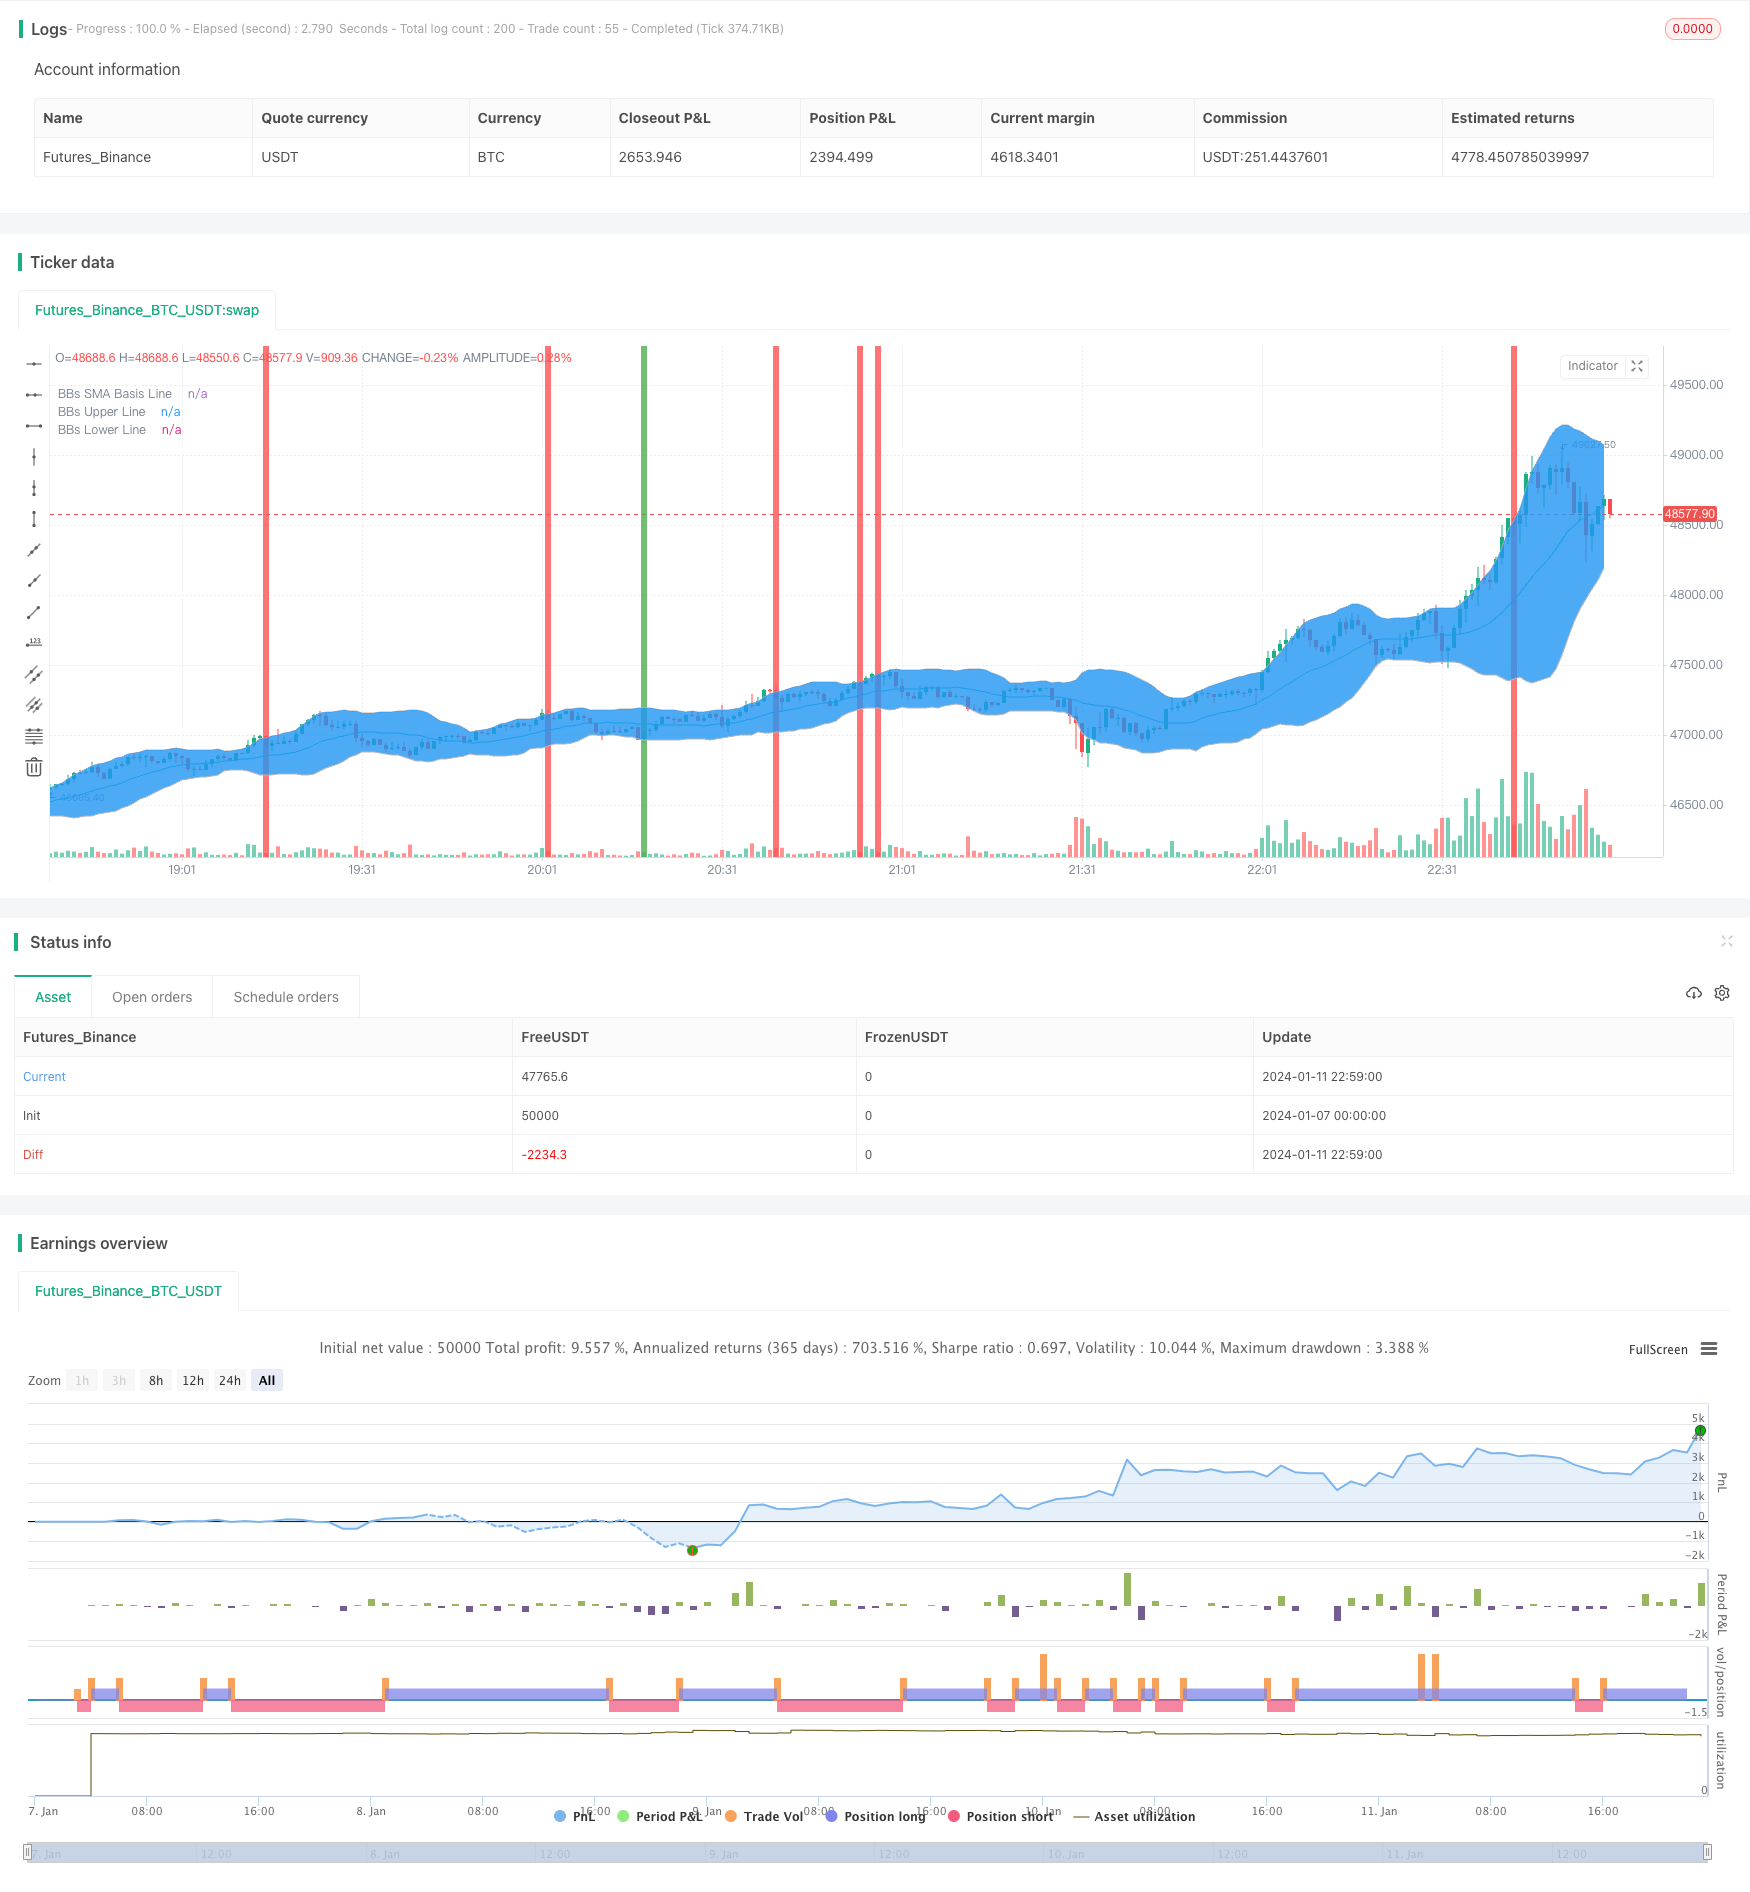
Overview
The strategy is named "Quantitative Trading Dual Indicator Strategy". It utilizes both Bollinger Bands and the Relative Strength Index (RSI) as trading signals to implement a dual indicator filtered trading strategy.
Strategy Logic
The core logic of this strategy is to use both Bollinger Bands and RSI to judge overbought and oversold conditions in the market for trading signal filtering.
Specifically, Bollinger Bands upper and lower bands can determine if prices are outside the volatility range, thereby judging if the market is overbought or oversold. The Relative Strength Index (RSI) can judge the strength of market forces. RSI above 55 is an overbought signal, and below 45 an oversold signal.
The strategy is set so that buy or sell operations are only carried out when Bollinger Bands and RSI both display overbought or oversold signals at the same time. This filters out some misleading signals and improves the stability of the strategy.
Advantages of the Strategy
The biggest advantage of this strategy is the use of dual indicators for filtering, which can reduce misleading trades and improve signal reliability.
Compared to a single Bollinger Bands indicator, the dual indicator strategy can greatly reduce the probability of false signals. Compared to a single RSI indicator, Bollinger Bands can be used to determine if it is currently outside the oscillation range to prevent wrong signals in an oscillating market.
Overall, the dual indicator strategy comprehensively considers multiple situations and has better adaptability and stability.
Risks of the Strategy and Solutions
The main risk of this strategy is that the parameter settings of both Bollinger Bands and RSI may be inappropriate. If Bollinger Bands parameters are set to be too sensitive, it is prone to generate redundant signals. If RSI parameters are set too loose, the effect will be weakened.
In addition, the dual indicator combination itself means fewer signals. If the market only meets the signals of one indicator while the other has not reached the trigger level, this strategy will not generate any signals. Therefore, compared to single indicator strategies, the trading frequency of this strategy will be lower.
The solutions mainly include setting more appropriate parameters, modifying RSI and Bollinger Bands trigger levels, etc. If the trading frequency is too low, consider reducing parameter requirements to increase entry opportunities.
Optimization Directions
This strategy can be optimized in the following aspects:
Test different combinations of Bollinger Bands and RSI parameters to find better matches. Existing parameters may not be suitable for all products and time periods.
Add stop loss and take profit strategies to improve profitability. Currently there are no considerations in these regards.
Add position sizing mechanisms. Use dynamic position sizing to increase positions when the trend goes well, and reduce losses when the trend goes badly.
Add parameter self-adaptivity based on historical data. Allow indicator parameters to be automatically optimized to suit latest market conditions.
Conclusion
As a dual indicator filtered strategy, this strategy has good overall stability and adaptability. While reducing the proportion of false signals, it also reduces the trading frequency. By optimizing indicator parameters and adding auxiliary functions, the profit potential of the strategy can be further enhanced.
Parameters
| Name | Default | What it controls |
|---|---|---|
| v_input_1 | 20 | Bollinger Bands SMA Period Length |
| v_input_2 | 2 | Bollinger Bands Standard Deviation |
| v_input_3_close | 0 | Source: close | high | low | open | hl2 | hlc3 | hlcc4 | ohlc4 |
| v_input_4 | 16 | RSI Period Length |
| v_input_5 | 45 | RSI Value Range |
| v_input_6 | true | Enable Bar Color? |
| v_input_7 | true | Enable Background Color? |
Source Pine Script
/*backtest
start: 2024-01-07 00:00:00
end: 2024-01-11 23:00:00
period: 1m
basePeriod: 1m
exchanges: [{"eid":"Futures_Binance","currency":"BTC_USDT"}]
*/

//@version=2
strategy("Bollinger Bands + RSI, Double Strategy (by SlumdogTrader)", shorttitle="BolBand_RSI_Strat", overlay=true)

// SlumdogTrader's Bollinger Bands + RSI Double Strategy - Profit Trailer
//
// Version 1.0
// Script by SlumdogTrader on July Fri 13(!), 2018.
//
// This strategy uses a normalise Bollinger Bands + RSI.
//
// Bollinger Band triggers
// SELL - when the price is above the upper band.
// BUY - when the price is below the lower band.
//
// RSI triggers
// SELL - when the price is above 55.
// BUY - when the price is below 45.
//
// This simple strategy only triggers when
// both the BB and the RSI
// indicators, at the same time, are in
// a overbought or oversold condition.
//
// Visit my TradingView work at:
// https://www.tradingview.com/u/SlumdogTrader/
//
// Visit my website at:
// https://www.slumdogtrader.com
//

///////////// Bollinger Bands Settings
BBlength = input(20, minval=1,title="Bollinger Bands SMA Period Length")
BBmult = input(2.0, minval=0.001, maxval=50,title="Bollinger Bands Standard Deviation")
price = input(close, title="Source")
BBbasis = sma(price, BBlength)
BBdev = BBmult * stdev(price, BBlength)
BBupper = BBbasis + BBdev
BBlower = BBbasis - BBdev
source = close
buyEntry = crossover(source, BBlower)
sellEntry = crossunder(source, BBupper)
plot(BBbasis, color=aqua,title="BBs SMA Basis Line")
p1 = plot(BBupper, color=silver,title="BBs Upper Line")
p2 = plot(BBlower, color=silver,title="BBs Lower Line")
fill(p1, p2)

///////////// RSI Settings
RSIlength = input( 16 ,title="RSI Period Length")
RSIvalue = input( 45 ,title="RSI Value Range")
RSIoverSold = 0 + RSIvalue
RSIoverBought = 100 - RSIvalue
vrsi = rsi(price, RSIlength)


///////////// Colour Settings
switch1=input(true, title="Enable Bar Color?")
switch2=input(true, title="Enable Background Color?")
TrendColor = RSIoverBought and (price[1] > BBupper and price < BBupper) ? red : RSIoverSold and (price[1] < BBlower and price > BBlower)  ? green : na
barcolor(switch1?TrendColor:na)
bgcolor(switch2?TrendColor:na,transp=50)


///////////// RSI + Bollinger Bands Strategy
if (not na(vrsi))

    if (crossover(vrsi, RSIoverSold) and crossover(source, BBlower))
        strategy.entry("RSI_BB_L", strategy.long, stop=BBlower,  comment="RSI_BB_L")
    else
        strategy.cancel(id="RSI_BB_L")

    if (crossunder(vrsi, RSIoverBought) and crossunder(source, BBupper))
        strategy.entry("RSI_BB_S", strategy.short, stop=BBupper,  comment="RSI_BB_S")
    else
        strategy.cancel(id="RSI_BB_S")

//plot(strategy.equity, title="equity", color=red, linewidth=2, style=areabr)
Published by ChaoZhang on the FMZ strategy square · last modified 2024-01-15. Collected in the Quant Trading Vault. Unvalidated research: re-test with your own data and costs before trusting it.
Build this with AgenKit
A spec is not a trading system. Paste this into your coding agent and AgenKit runs a specialist team — architecture, test-first build, risk gates, review — with paper trading on by default.
/agenkit build a production-grade trading bot with a backtest engine, risk controls and paper trading by default from strategies/Quantitative-Trading-Dual-Indicator-Strategy.md- npx agenkit install engineering-kit in your project
- Paste the command into your agent and approve each phase
- Get tests, backtest, risk controls and a paper-trading switch
Understand it first
Before you run this, read the lesson behind the idea and how to backtest it honestly. Specs like this one are the survivors of an unknown number of trials; deflate their results accordingly.
Related specs
- Advanced 15 Minute Chart Trading Signal StrategyPine Script · Mean reversion · 3h
- Advanced Quantitative Trading Strategy Combining RSI Divergence and Moving AveragesPine Script · Mean reversion · 1h
- Bollinger Bands Stochastic RSI Extreme Strategy BBSR Extreme StrategyPine Script · Mean reversion · 1h
- Dual Moving Average RSI Synergy Options Quantitative Trading StrategyPine Script · Mean reversion · 1h
- Gods Bollinger Bands RSI Trading StrategyPine Script · Mean reversion · 1d
- Multi Indicator Reversal Point Capture Trading StrategyPine Script · Mean reversion · 1d