Strategy vault / Mean reversion
Quantitative Trading Strategy Based on Bollinger Bands and RSI
This strategy designs a quantitative trading strategy based on Bollinger Bands and the Relative Strength Index (RSI). It combines trend tracking and overbought/oversold judgment to enter the market at the beginning…
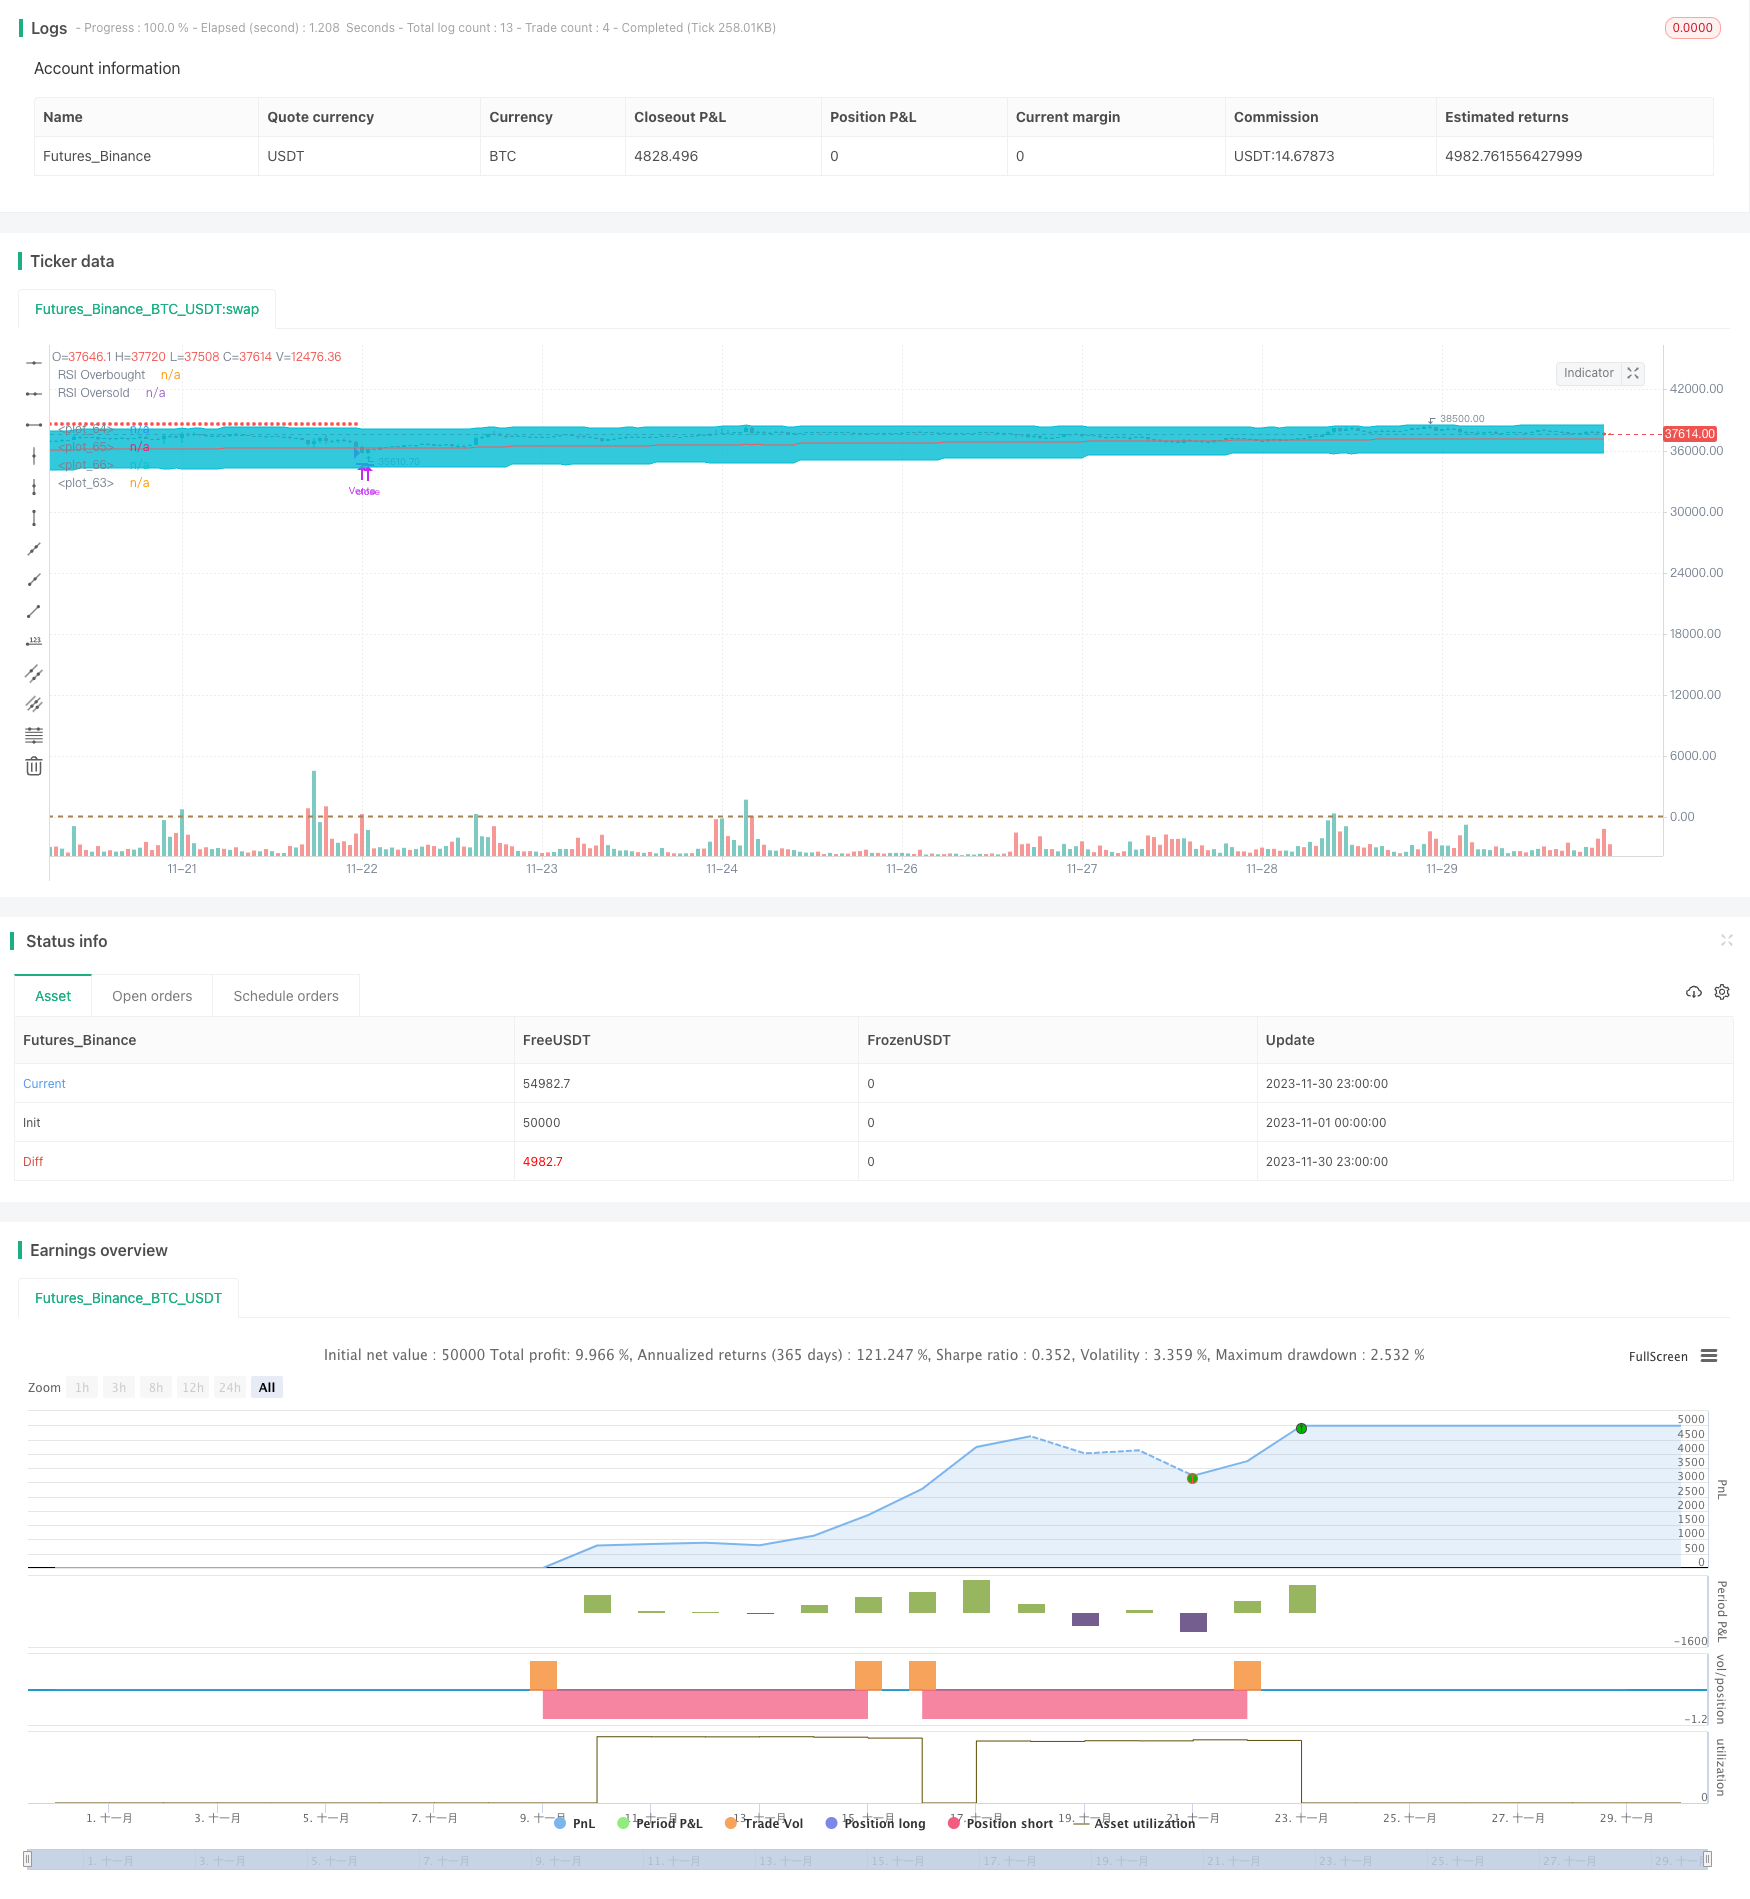
Overview
This strategy designs a quantitative trading strategy based on Bollinger Bands and the Relative Strength Index (RSI). It combines trend tracking and overbought/oversold judgment to enter the market at the beginning of a trend and exit at overbought/oversold levels to profit.
Strategy Principle
The strategy uses Bollinger Bands to determine price trends and support/resistance levels. Prices approaching the lower Bollinger Band are seen as an oversold signal, while prices approaching the upper Bollinger Band are seen as an overbought signal. At the same time, it incorporates the RSI indicator to determine if oversold or overbought conditions exist.
The specific trading rules are: go long when the price is below the lower Bollinger Band and the RSI is below 30; go short when the price is above the upper Bollinger Band and the RSI is above 70. For profit taking, set the middle Bollinger Band or the opposite Bollinger Band as the take profit level. The stop loss is set at a certain percentage from the entry price.
Advantages
The strategy combines Bollinger Bands' trend tracking ability and RSI's overbought/oversold judgement to capture good trend start timing. Also, the profit taking and stop loss strategies provide clear risk management.
Compared to using a single indicator like Bollinger Bands or RSI alone, this strategy utilizes multiple indicators and parameters to improve decision accuracy. With proper parameter tuning, it can achieve relatively stable performance.
Risks
The strategy relies heavily on parameter optimization. Incorrect parameter settings can lead to missing trends or generating false signals. For example, mismatching Bollinger period may cause such issues. Take profit and stop loss levels also need careful assessment.
The strategy also depends on the trading instrument. For highly volatile assets, Bollinger Band parameters need to be adjusted accordingly. For instruments with unclear trends, the performance may suffer as well. Also affected by transaction costs, slippage and extreme market events.
Parameter optimization testing is recommended to evaluate profit taking/stop loss levels and performance across different assets and market regimes. Maintain risk management buffers.
Optimization Directions
Several aspects can be improved:
Evaluate and optimize parameters for Bollinger Bands and RSI to better match the trading instrument characteristics
Incorporate additional indicators like KDJ, MACD to build a multifactor model
Assess profit taking/stop loss strategies, such as trailing stop loss or scaled exit
Conduct dynamic parameter tuning based on specific assets and market conditions
Add machine learning models to judge signal quality and risk levels
Summary
This strategy integrates Bollinger Bands and RSI for a comprehensive trend following system. There is further room for improving effectiveness and stability through parameter tuning and risk management. Custom adjustments and optimizations are recommended based on individual needs and risk preference for better performance.
Parameters
| Name | Default | What it controls |
|---|---|---|
| v_input_1 | 20 | Longitud BB |
| v_input_2 | 2 | Multiplicador BB |
| v_input_3 | D | Marco de Tiempo BB |
| v_input_4 | 14 | Longitud RSI |
| v_input_5 | 70 | Nivel de sobrecompra RSI |
| v_input_6 | 30 | Nivel de sobreventa RSI |
| v_input_7 | 0 | Take Profit (banda): Central | Opuesta |
| v_input_8 | 2 | Stop Loss |
Source Pine Script
/*backtest
start: 2023-11-01 00:00:00
end: 2023-11-30 23:59:59
period: 1h
basePeriod: 15m
exchanges: [{"eid":"Futures_Binance","currency":"BTC_USDT"}]
*/

//@version=4
strategy("BB + RSI Estrategia", overlay=true)

longitud = input(20, title="Longitud BB", minval=5, maxval=50, step=1)
multiplicador = input(2.0, title="Multiplicador BB", type=input.float, step=0.1)
timeframe_bb = input("D", title="Marco de Tiempo BB", type=input.resolution)
rsi_length = input(14, title="Longitud RSI", minval=5, maxval=50, step=1)
rsi_overbought = input(70, title="Nivel de sobrecompra RSI", minval=50, maxval=80, step=1)
rsi_oversold = input(30, title="Nivel de sobreventa RSI", minval=20, maxval=50, step=1)
take_profit = input("Central", title="Take Profit (banda)", options=["Central", "Opuesta"])
stop_loss = input(2.00, title="Stop Loss", type=input.float, step=0.10)

var SL = 0.0

[banda_central, banda_superior, banda_inferior] = security(syminfo.tickerid, timeframe_bb, bb(close, longitud, multiplicador))
rsi_value = rsi(close, rsi_length)

comprado = strategy.position_size > 0
vendido = strategy.position_size < 0

if not comprado and not vendido
    if close < banda_inferior and rsi_value < rsi_oversold
        // Realizar la compra
        cantidad = round(strategy.equity / close)
        strategy.entry("Compra", strategy.long, qty=cantidad, when=cantidad > 0)
        SL := close * (1 - (stop_loss / 100))

    if close > banda_superior and rsi_value > rsi_overbought
        // Realizar la Venta
        cantidad = round(strategy.equity / close)
        strategy.entry("Venta", strategy.short, qty=cantidad, when=cantidad > 0)
        SL := close * (1 + (stop_loss / 100))

if comprado
    // Verificar el take profit
    if take_profit == "Central" and close >= banda_central
        strategy.close("Compra", comment="TP")
        SL := 0

    if take_profit == "Opuesta" and close >= banda_superior
        strategy.close("Compra", comment="TP")
        SL := 0
    // Verificar el stop loss
    if close <= SL
        strategy.close("Compra", comment="SL")
        SL := 0

if vendido
    // Verificar el take profit
    if take_profit == "Central" and close <= banda_central
        strategy.close("Venta", comment="TP")
        SL := 0

    if take_profit == "Opuesta" and close <= banda_inferior
        strategy.close("Venta", comment="TP")
        SL := 0
    // Verificar el Stop loss
    if close >= SL
        strategy.close("Venta", comment="SL")
        SL := 0

// Salida
plot(SL > 0 ? SL : na, style=plot.style_circles, color=color.red)
g1 = plot(banda_superior, color=color.aqua)
plot(banda_central, color=color.red)
g2 = plot(banda_inferior, color=color.aqua)
fill(g1, g2, color=color.aqua, transp=97)

// Dibujar niveles de sobrecompra/sobreventa del RSI
hline(rsi_overbought, "RSI Overbought", color=color.red)
hline(rsi_oversold, "RSI Oversold", color=color.green)Published by ChaoZhang on the FMZ strategy square · last modified 2023-12-20. Collected in the Quant Trading Vault. Unvalidated research: re-test with your own data and costs before trusting it.
Build this with AgenKit
A spec is not a trading system. Paste this into your coding agent and AgenKit runs a specialist team — architecture, test-first build, risk gates, review — with paper trading on by default.
/agenkit build a production-grade trading bot with a backtest engine, risk controls and paper trading by default from strategies/Quantitative-Trading-Strategy-Based-on-Bollinger-Bands-and-RSI.md- npx agenkit install engineering-kit in your project
- Paste the command into your agent and approve each phase
- Get tests, backtest, risk controls and a paper-trading switch
Understand it first
Before you run this, read the lesson behind the idea and how to backtest it honestly. Specs like this one are the survivors of an unknown number of trials; deflate their results accordingly.
Related specs
- Multi Timeframe Gold Reversal Tracking StrategyPine Script · Mean reversion · 2h
- MACD RSI and EMA StrategyPine Script · Mean reversion · 1d
- Fibonacci Golden Ratio and Relative Strength RSI StrategyPine Script · Mean reversion · 1m
- Advanced 15 Minute Chart Trading Signal StrategyPine Script · Mean reversion · 3h
- Advanced Quantitative Trading Strategy Combining RSI Divergence and Moving AveragesPine Script · Mean reversion · 1h
- Dynamic MACD and Ichimoku Cloud Trading StrategyPine Script · Mean reversion · 1h