Strategy vault / Trend following
Quantitative Trading Strategy Based on Double Moving Average Crossover
This strategy is named "Quantitative Trading Strategy Based on Double Moving Average Crossover". The main idea of this strategy is to use the cross signals between fast and slow moving average lines to determine…
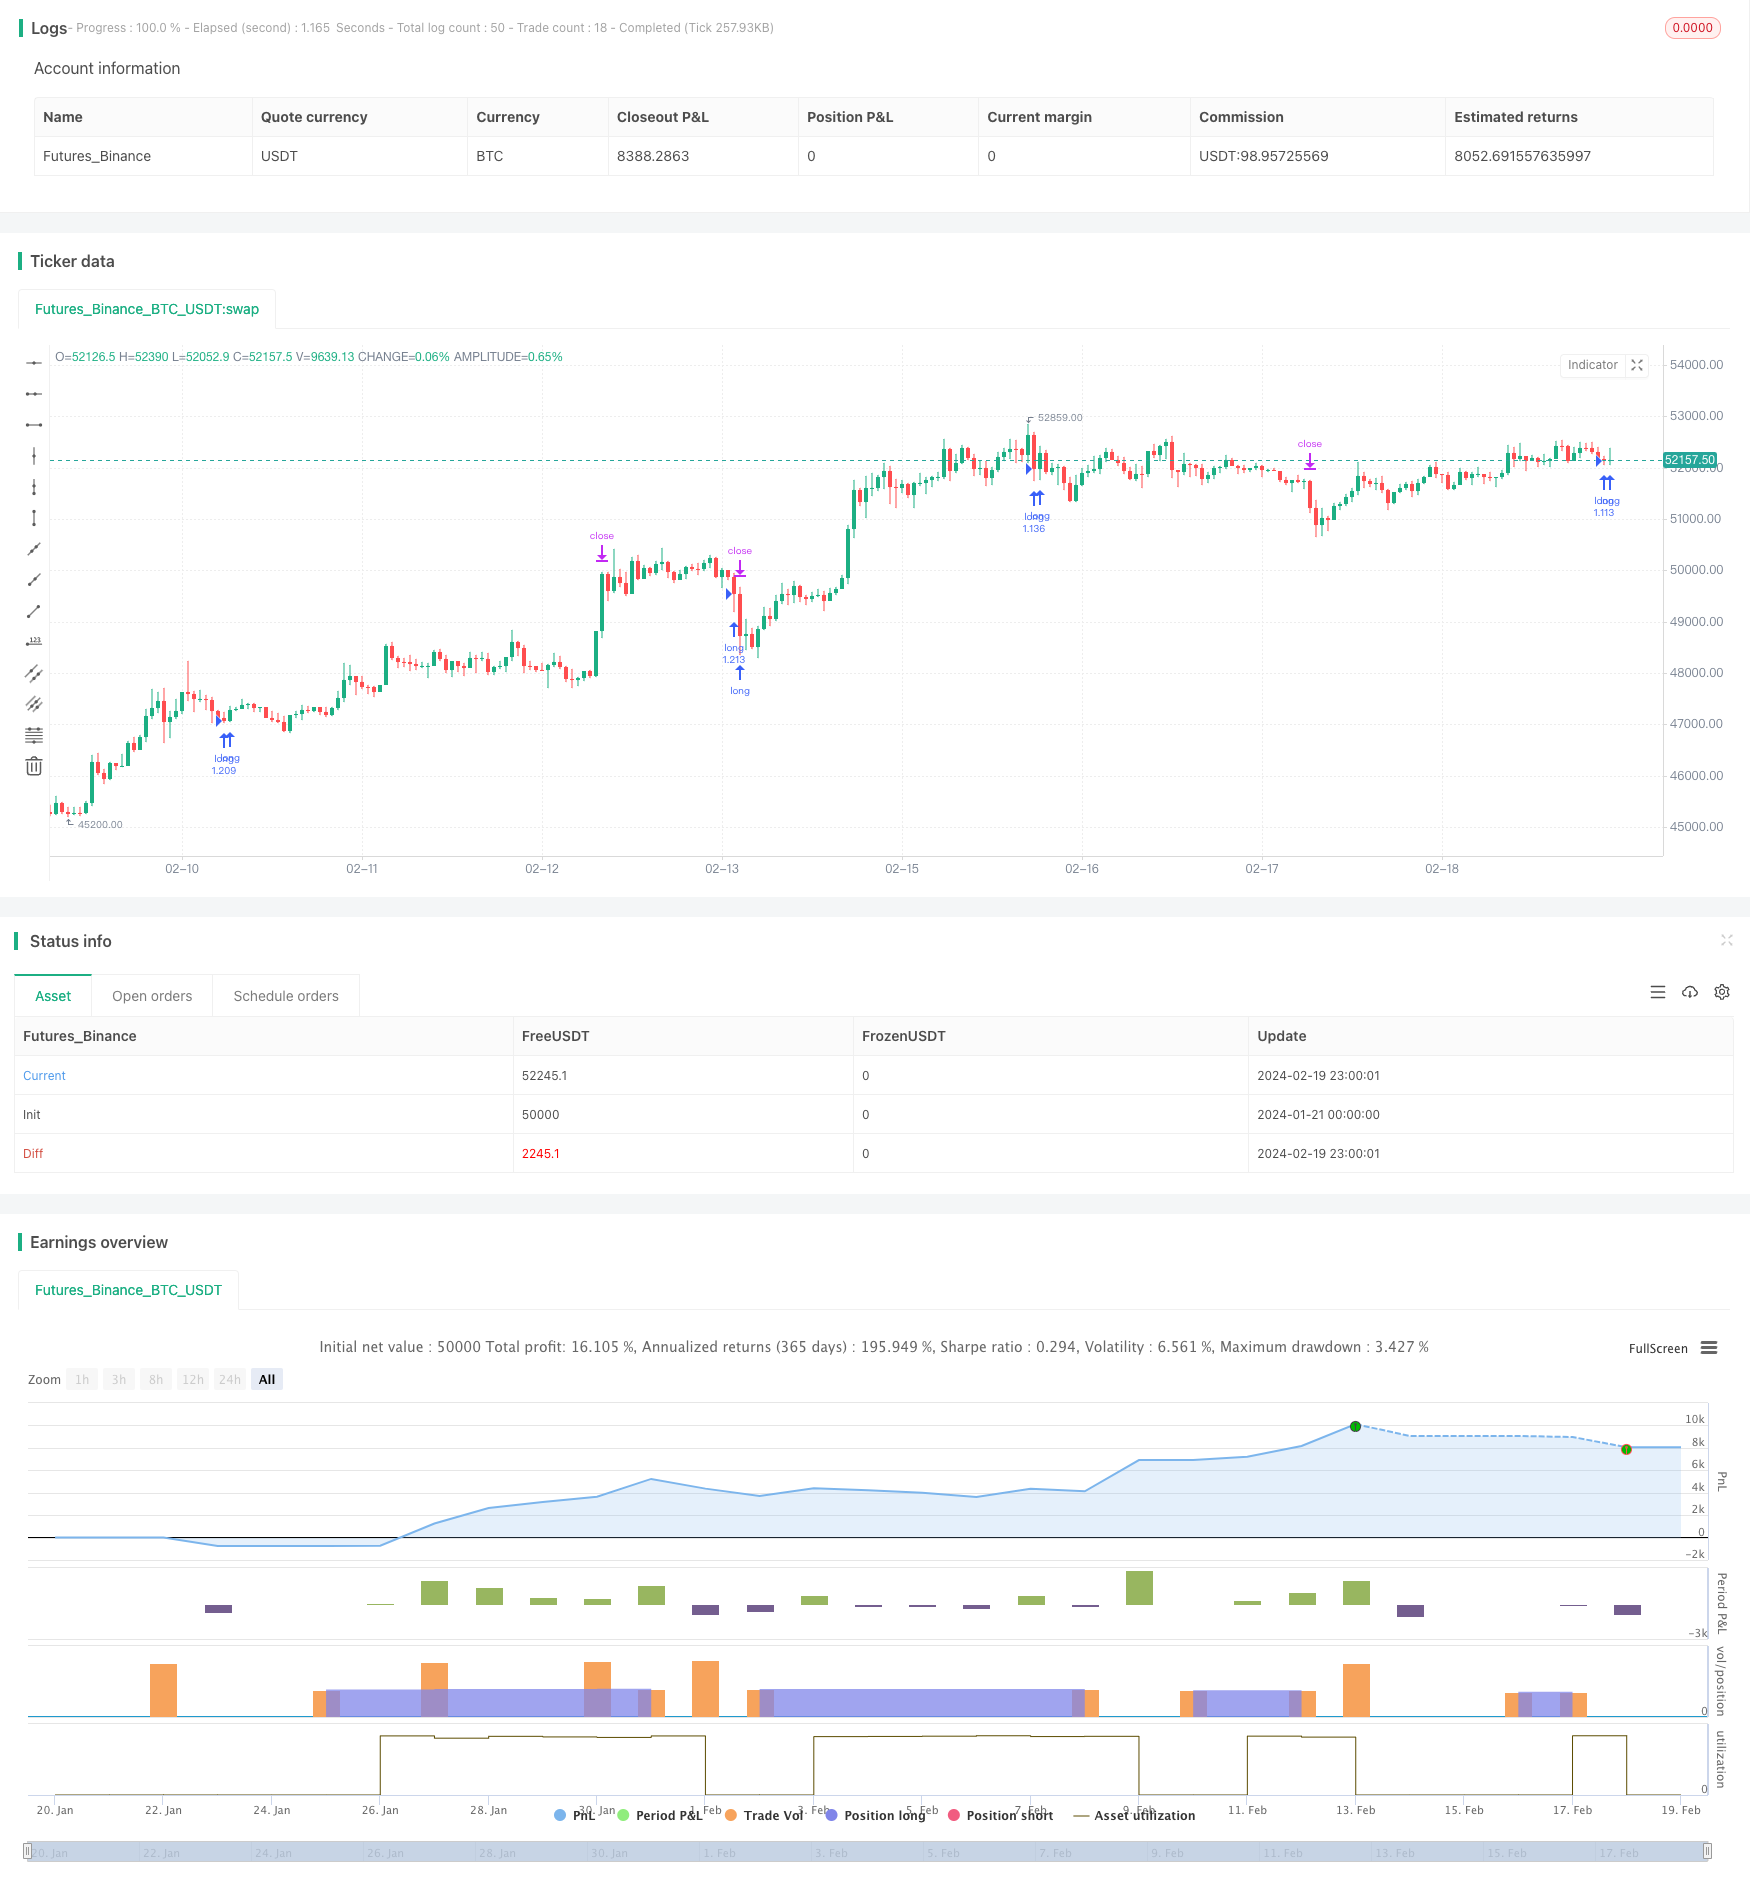
Overview
This strategy is named "Quantitative Trading Strategy Based on Double Moving Average Crossover". The main idea of this strategy is to use the cross signals between fast and slow moving average lines to determine price trends and make buying and selling decisions accordingly.
Strategy Principle
The core indicators of this strategy are the fast and slow moving average lines. The strategy uses the crossover relationship between the fast and slow moving average lines to determine price trends and make trading decisions based on this.
Specifically, the fast moving average line parameter is set to 24 periods, and the slow moving average line parameter is set to 100 periods. When the fast moving average line crosses above the slow moving average line from below, it indicates that prices are entering an upward trend, and the strategy will issue a buy signal at this time. When the fast moving average line crosses below the slow moving average line from above, it indicates that prices are entering a downward trend, and the strategy will issue a sell signal at this time.
By judging the crossover direction of the fast and slow moving average lines, price trend changes can be effectively captured to aid in making buy and sell decisions.
Advantages of the Strategy
This strategy has the following advantages:
The principle is simple and easy to understand, easy to implement. Double moving average crossover is one of the most basic technical indicators and is easy to understand and apply.
Adjustable parameters, high adaptability. The parameters of the fast and slow moving averages can be adjusted according to actual conditions, making the strategy more flexible.
Strong ability to capture trend changes. Double moving average crossovers are often used to capture turning points when prices move from consolidation to trend.
Can effectively filter out consolidations and reduce invalid trades. Double moving averages can be used to identify consolidation ranges and avoid repeated opening of positions during consolidations.
Risks of the Strategy
There are also some risks with this strategy:
Double moving average crossover signals may lag. As trend tracking indicators, crossover signals of double moving averages often lag by a certain period, which can lead to a certain degree of opportunity cost.
Easy to produce false signals in oscillating markets. Double moving averages perform best when prices show a clear trend. But in oscillating markets, they tend to produce frequent fake signals.
Improper parameter settings may affect strategy performance. If the fast and slow moving average parameters are set improperly, it will affect the sensitivity to capturing trend crossovers.
Corresponding solutions:
Appropriately shorten the moving average period to increase the sensitivity of crossover signals.
Add volatility or volume indicators for filtration to reduce invalid trades in oscillating markets.
Parameter optimization to find the best parameter combinations. Add machine learning and other methods to automatically optimize.
Directions for Strategy Optimization
The strategy can be optimized in the following aspects:
Use more advanced moving average technical indicators such as Linear Weighted Moving Average to replace Simple Moving Average to improve the tracking and predictive capability of the indicators.
Add more auxiliary indicators such as volume and volatility indicators for joint filtering to reduce invalid signals.
Optimize fast and slow moving average parameters to improve parameter adaptability. Methods such as machine learning and random optimization can be used to find the optimal parameters.
After the strategy enters the market, stop loss points and trailing stop loss can be designed to control single loss. At the same time, add profit optimization techniques to ensure sufficient profits.
New technologies such as deep learning can be used to identify more complex price patterns to aid moving average crossovers in making buy and sell decisions, in order to obtain better results.
Summary
In general, this strategy is relatively classic and simple. It determines price trends based on double moving average indicators to uncover opportunities when prices move from consolidation to trend. The advantages are clear logic and simplicity, suitable for tracking trending markets. But there are also some flaws like signal lag that need to be improved through parameter tuning and optimization to increase the stability and efficiency of the strategy. Overall, as a basic strategy, this is quite suitable, but needs continuous optimization to adapt to more complex market environments.
Parameters
| Name | Default | What it controls |
|---|---|---|
| v_input_string_1 | 0 | (?Smoothing)Method: SMA | EMA | SMMA (RMA) | WMA | VWMA |
| v_input_int_1 | 20 | Length |
| v_input_float_1 | true | Limit |
Source Pine Script
/*backtest
start: 2024-01-21 00:00:00
end: 2024-02-20 00:00:00
period: 1h
basePeriod: 15m
exchanges: [{"eid":"Futures_Binance","currency":"BTC_USDT"}]
*/

//@version=5
strategy('Pine Script Tutorial Example Strategy 1', overlay=true, initial_capital=100000, default_qty_value=100, default_qty_type=strategy.percent_of_equity)

//OBV
src = close
obv = ta.cum(math.sign(ta.change(src)) * volume)
ma(source, length, type) =>
    switch type
        "SMA" => ta.sma(source, length)
        "EMA" => ta.ema(source, length)
        "SMMA (RMA)" => ta.rma(source, length)
        "WMA" => ta.wma(source, length)
        "VWMA" => ta.vwma(source, length)
typeMA = input.string(title = "Method", defval = "SMA", options=["SMA", "EMA", "SMMA (RMA)", "WMA", "VWMA"], group="Smoothing")
smoothingLength = input.int(title = "Length", defval = 20, minval = 1, maxval = 100, group="Smoothing")
Limit = input.float(title = "Limit", defval = 1, minval = 0.1, maxval = 10, group="Smoothing")
smoothingLine_ma = ma(obv,smoothingLength, typeMA)
obv_diff = (obv-smoothingLine_ma)*100/obv

//PVT
var cumVolp = 0.
cumVolp += nz(volume)
if barstate.islast and cumVolp == 0
    runtime.error("No volume is provided by the data vendor.")
srcp = close
vt = ta.cum(ta.change(srcp)/srcp[1]*volume)
smoothingLine_map = ma(vt,smoothingLength, typeMA)
pvt_diff = (vt-smoothingLine_map)*100/vt

// plot(obv_diff+close+100 ,title="OBV_DIFF", color = color.rgb(255, 118, 54))
// plot(pvt_diff+close+80 ,title="PVT_DIFF", color = color.rgb(223, 61, 255))

indicator = (pvt_diff+obv_diff)/2
goLongCondition1 = ta.crossover(indicator,Limit)
timePeriod = time >= timestamp(syminfo.timezone, 2023,1, 1, 0, 0)  // Backtesting Time
notInTrade = strategy.position_size <= 0
if goLongCondition1 and timePeriod and notInTrade
    stopLoss = low * 0.99 // -2%
    takeProfit = high * 1.05 // +5%
    strategy.entry('long', strategy.long )
    strategy.exit('exit', 'long', stop=stopLoss, limit=takeProfit)


// fastEMA = ta.ema(close, 24)
// slowEMA = ta.ema(close, 100)
// goLongCondition1 = ta.crossover(fastEMA, slowEMA)
// timePeriod = time >= timestamp(syminfo.timezone, 2018, 12, 15, 0, 0)
// notInTrade = strategy.position_size <= 0
// if goLongCondition1 and timePeriod and notInTrade
//     stopLoss = low * 0.97
//     takeProfit = high * 1.12
//     strategy.entry('long', strategy.long)
//     strategy.exit('exit', 'long', stop=stopLoss, limit=takeProfit)
// plot(fastEMA, color=color.new(color.blue, 0))
// plot(slowEMA, color=color.new(color.yellow, 0))Published by ChaoZhang on the FMZ strategy square · last modified 2024-02-21. Collected in the Quant Trading Vault. Unvalidated research: re-test with your own data and costs before trusting it.
Build this with AgenKit
A spec is not a trading system. Paste this into your coding agent and AgenKit runs a specialist team — architecture, test-first build, risk gates, review — with paper trading on by default.
/agenkit build a production-grade trading bot with a backtest engine, risk controls and paper trading by default from strategies/Quantitative-Trading-Strategy-Based-on-Double-Moving-Average-Crossover.md- npx agenkit install engineering-kit in your project
- Paste the command into your agent and approve each phase
- Get tests, backtest, risk controls and a paper-trading switch
Understand it first
Before you run this, read the lesson behind the idea and how to backtest it honestly. Specs like this one are the survivors of an unknown number of trials; deflate their results accordingly.
Related specs
- Trend Following Strategy Based on OBV and MA Crossover SignalsPine Script · Trend following · 1d
- Five Minute Triple Confirmation Trend Trading Strategy with Risk Management SystemPine Script · Trend following · 1m
- Advanced Multi Indicator Trend Confirmation Trading StrategyPine Script · Trend following · 1d
- Trend Following Strategy Based on Time Series Decomposition and Volume Weighted Bollinger BandsPine Script · Trend following · 1h
- Kifiers Hidden MFI STOCH Divergence Trend Breaker Trading StrategyPine Script · Trend following · 1h
- Multi Indicator Integrated Trend Following Trading StrategyPine Script · Trend following · 2m