Strategy vault / Mean reversion
Quantitative Trading Strategy Based on RSI and Bollinger Bands
This article analyzes in depth a quantitative trading strategy based on the RSI and Bollinger Band technical indicators. By fully utilizing the advantages of RSI in identifying overbought and oversold conditions and…
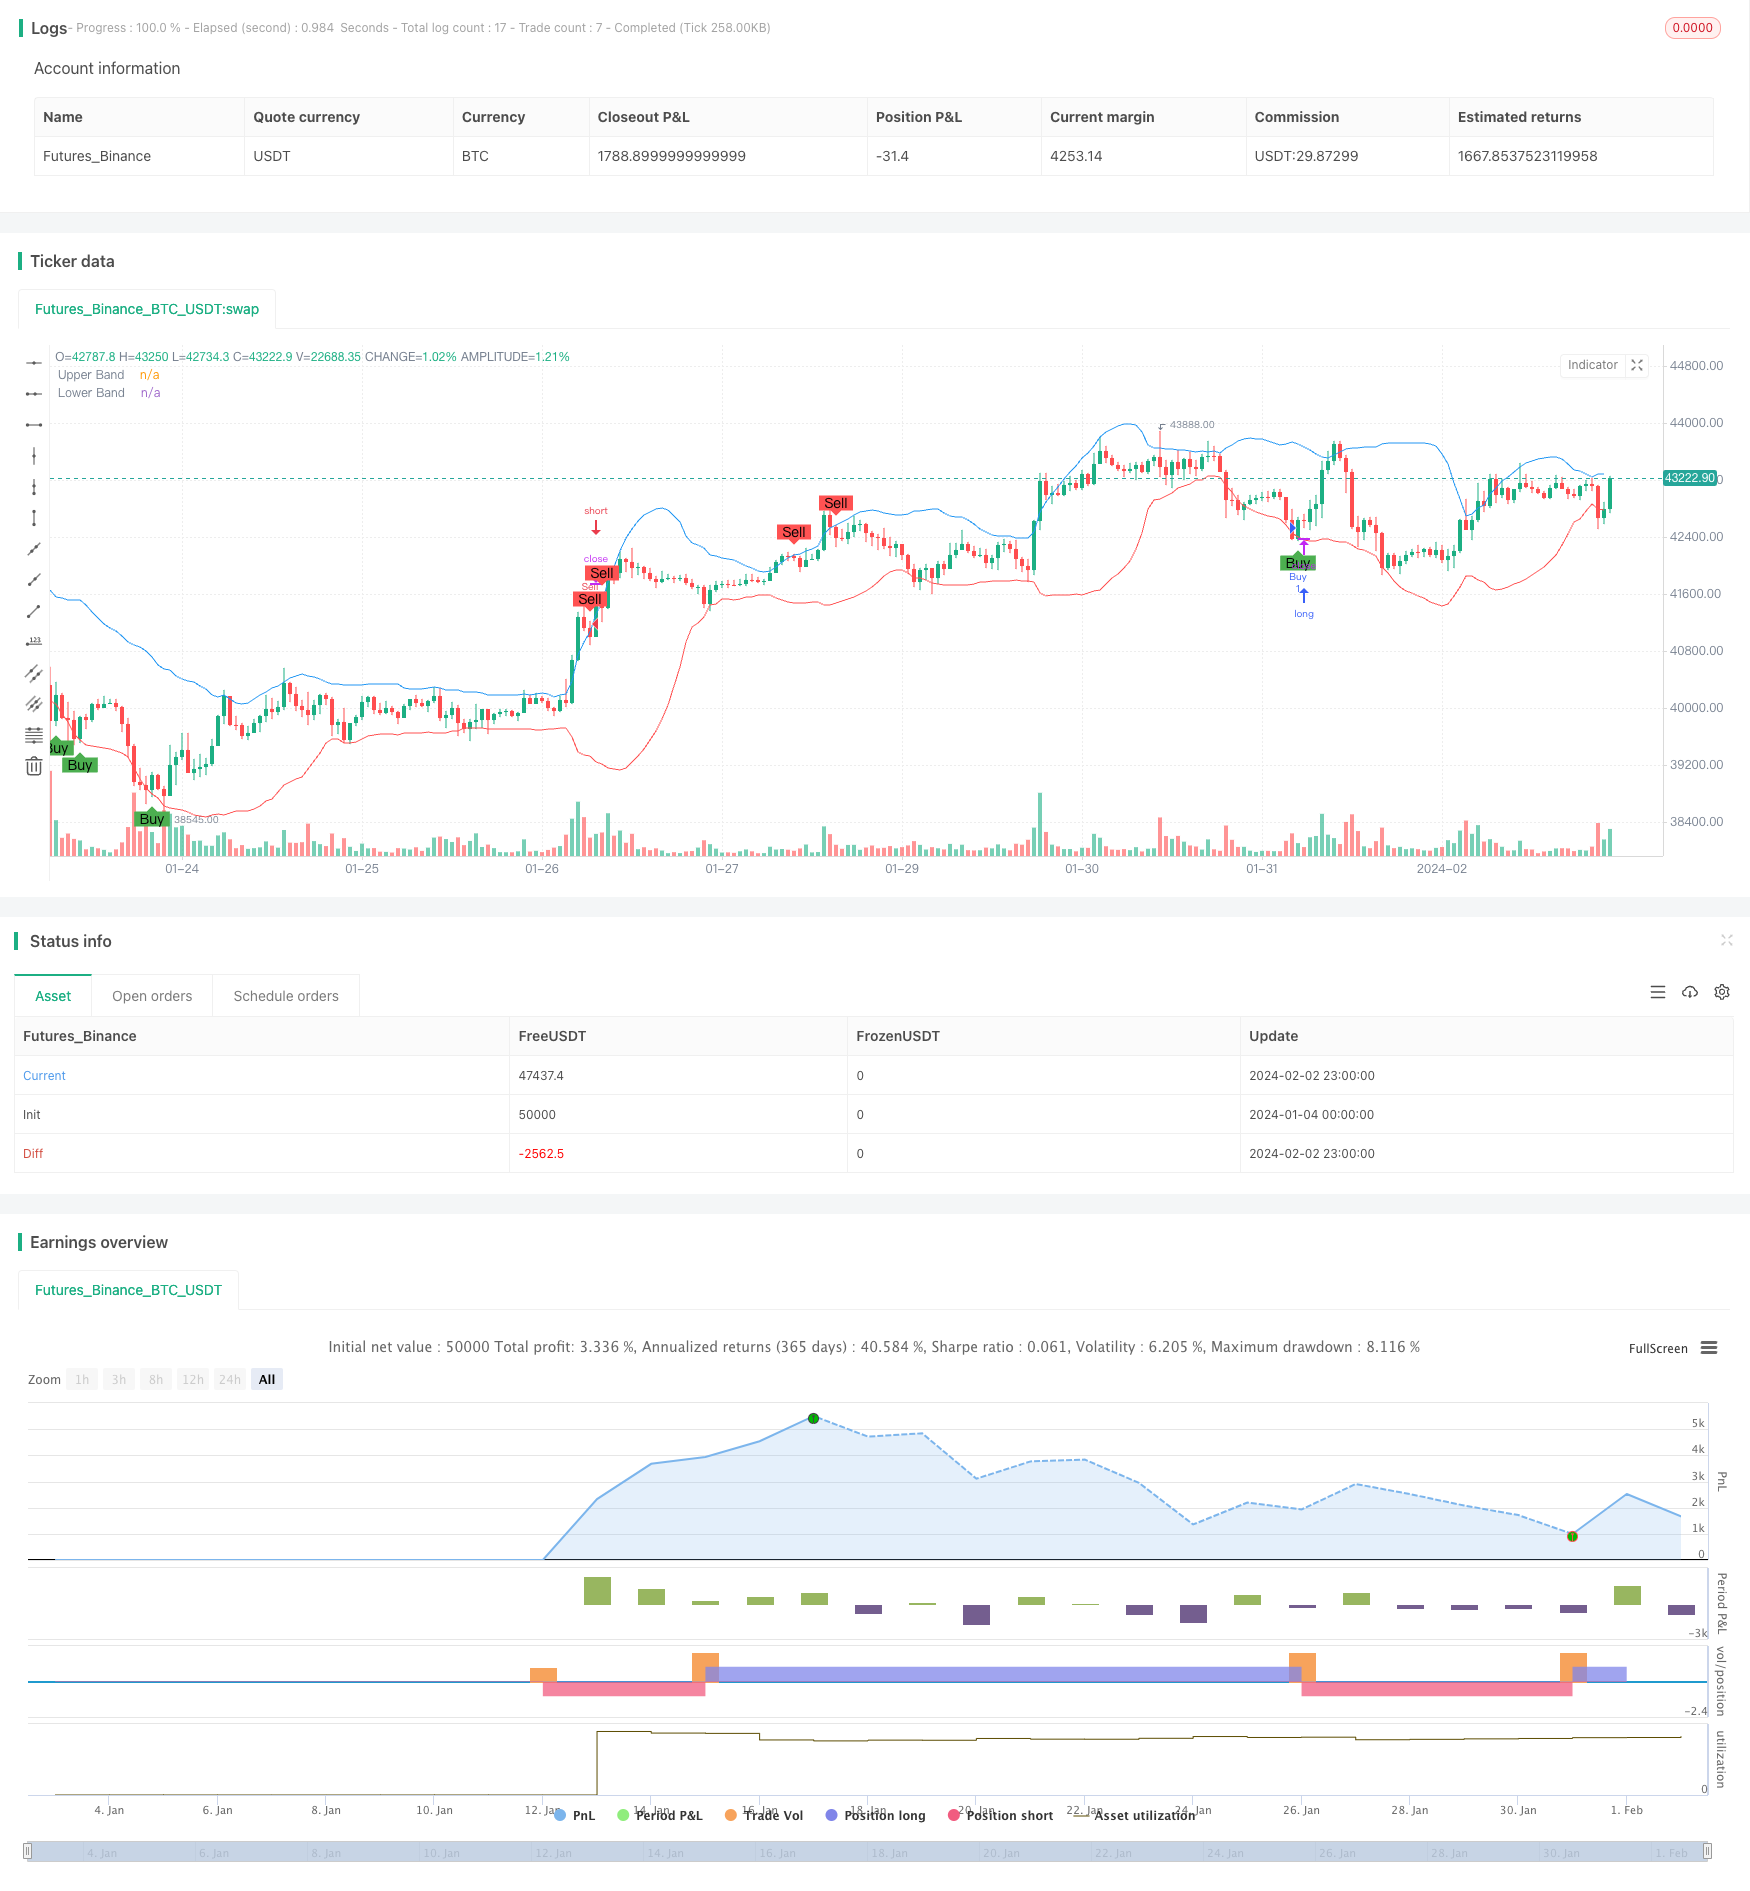
Overview
This article analyzes in depth a quantitative trading strategy based on the RSI and Bollinger Band technical indicators. By fully utilizing the advantages of RSI in identifying overbought and oversold conditions and Bollinger Bands in judging price volatility, this strategy enables more accurate identification of inflection points in market trends.
Strategy Principle
RSI Principle
RSI stands for Relative Strength Index. It is a technical indicator that measures the magnitude of recent price changes to evaluate overbought or oversold conditions. RSI ranges from 0 to 100. Values over 70 indicate an overbought state and values below 30 indicate an oversold state. The emergence of overbought and oversold conditions often implies a potential price reversal.
Bollinger Bands Principle
Bollinger Bands consist of a middle band, an upper band and a lower band. The middle band is a n-day moving average, while the upper band is set two standard deviations above the middle band and the lower band is set two standard deviations below. Touching or crossing these bands indicates increased volatility and an upcoming reversal.
Strategy Construction
This strategy combines RSI to determine overbought and oversold entry signals and Bollinger Bands to ascertain price volatility, generating trading signals when RSI enters overbought/oversold territory concurrently with prices touching the Bollinger bands. This allows it to capture trend turning points and achieve buying low and selling high.
Advantage Analysis
Fully utilizes RSI's strength in identifying overbought and oversold conditions by setting reasonable thresholds to avoid false signals.
Leverages Bollinger Bands to judge price fluctuation and volatility then formulates trading decisions together with RSI, enhancing decision accuracy.
RSI verifies signals generated by Bollinger Bands and vice versa to reduce trading mistakes.
Capably detects price uptrend and downtrend reversals to seize price reversal opportunities.
Risk Analysis
False signals generated by technical indicators cannot be fully avoided.
Improper RSI parameter or Bollinger Band parameter settings may lead to missing trading chances or unnecessary trades.
Potential stop loss risks still exist under sharp market fluctuations.
Parameters need reasonable adjustments to suit different products and market environments.
Optimization Directions
Test and optimize RSI and Bollinger Band parameters to find optimum parameter sets.
Add stop loss strategies to strictly control losses per trade.
Incorporate other indicators like KDJ and MACD to enhance robustness.
Build auto parameter tuning module to dynamically adapt strategy parameters to current market conditions.
Conclusion
The quantitative trading strategy based on RSI and Bollinger Bands, through double indicator verification and combination, can effectively determine price trend inflection points. This strategy is simple, practical, and easy to implement, with the advantages of high accuracy, frequent trading, and easy optimization. However risk control remains vital alongside parameter testing, stop loss tactics, and indicator optimization to improve strategy stability and profitability.
Parameters
| Name | Default | What it controls |
|---|---|---|
| v_input_int_1 | 14 | RSI Length |
| v_input_int_2 | 70 | Overbought Level |
| v_input_int_3 | 30 | Oversold Level |
| v_input_int_4 | 20 | BB Length |
| v_input_float_1 | 2 | BB Deviation |
Source Pine Script
/*backtest
start: 2024-01-04 00:00:00
end: 2024-02-03 00:00:00
period: 1h
basePeriod: 15m
exchanges: [{"eid":"Futures_Binance","currency":"BTC_USDT"}]
*/

//@version=5
strategy("RSI & Bollinger Bands Strategy", overlay=true)

// RSI ayarları
rsi_length = input.int(14, title="RSI Length")
overbought = input.int(70, title="Overbought Level")
oversold = input.int(30, title="Oversold Level")
rsi = ta.rsi(close, rsi_length)

// Bollinger Bands ayarları
length = input.int(20, title="BB Length")
mult = input.float(2.0, title="BB Deviation")
basis = ta.sma(close, length)
dev = mult * ta.stdev(close, length)
upper = basis + dev
lower = basis - dev

// Alım-satım sinyalleri
longCondition = ta.crossover(rsi, oversold) and ta.crossover(close, lower)
shortCondition = ta.crossunder(rsi, overbought) and ta.crossunder(close, upper)

// Alım ve satım koşullarına göre işlem yapma
if (longCondition)
    strategy.entry("Buy", strategy.long)
if (shortCondition)
    strategy.entry("Sell", strategy.short)

// Alım ve satım sinyallerini görselleştirme
plotshape(series=longCondition, title="Buy Signal", location=location.belowbar, color=color.green, style=shape.labelup, text="Buy")
plotshape(series=shortCondition, title="Sell Signal", location=location.abovebar, color=color.red, style=shape.labeldown, text="Sell")

// Bollinger Bantları'nı grafik üzerine çizme
plot(upper, title="Upper Band", color=color.blue)
plot(lower, title="Lower Band", color=color.red)
Published by ChaoZhang on the FMZ strategy square · last modified 2024-02-04. Collected in the Quant Trading Vault. Unvalidated research: re-test with your own data and costs before trusting it.
Build this with AgenKit
A spec is not a trading system. Paste this into your coding agent and AgenKit runs a specialist team — architecture, test-first build, risk gates, review — with paper trading on by default.
/agenkit build a production-grade trading bot with a backtest engine, risk controls and paper trading by default from strategies/Quantitative-Trading-Strategy-Based-on-RSI-and-Bollinger-Bands.md- npx agenkit install engineering-kit in your project
- Paste the command into your agent and approve each phase
- Get tests, backtest, risk controls and a paper-trading switch
Understand it first
Before you run this, read the lesson behind the idea and how to backtest it honestly. Specs like this one are the survivors of an unknown number of trials; deflate their results accordingly.
Related specs
- Advanced 15 Minute Chart Trading Signal StrategyPine Script · Mean reversion · 3h
- Advanced Quantitative Trading Strategy Combining RSI Divergence and Moving AveragesPine Script · Mean reversion · 1h
- Bollinger Bands Stochastic RSI Extreme Strategy BBSR Extreme StrategyPine Script · Mean reversion · 1h
- Dual Moving Average RSI Synergy Options Quantitative Trading StrategyPine Script · Mean reversion · 1h
- Gods Bollinger Bands RSI Trading StrategyPine Script · Mean reversion · 1d
- Multi Indicator Reversal Point Capture Trading StrategyPine Script · Mean reversion · 1d