Strategy vault / Mean reversion
Quantitative Trading Strategy Based on RSI Indicator and Moving Average
The strategy is named "Quantitative Trading Strategy Based on RSI Indicator and Moving Average". It utilizes RSI indicator and moving averages as trading signals to implement a quantitative trading strategy that…
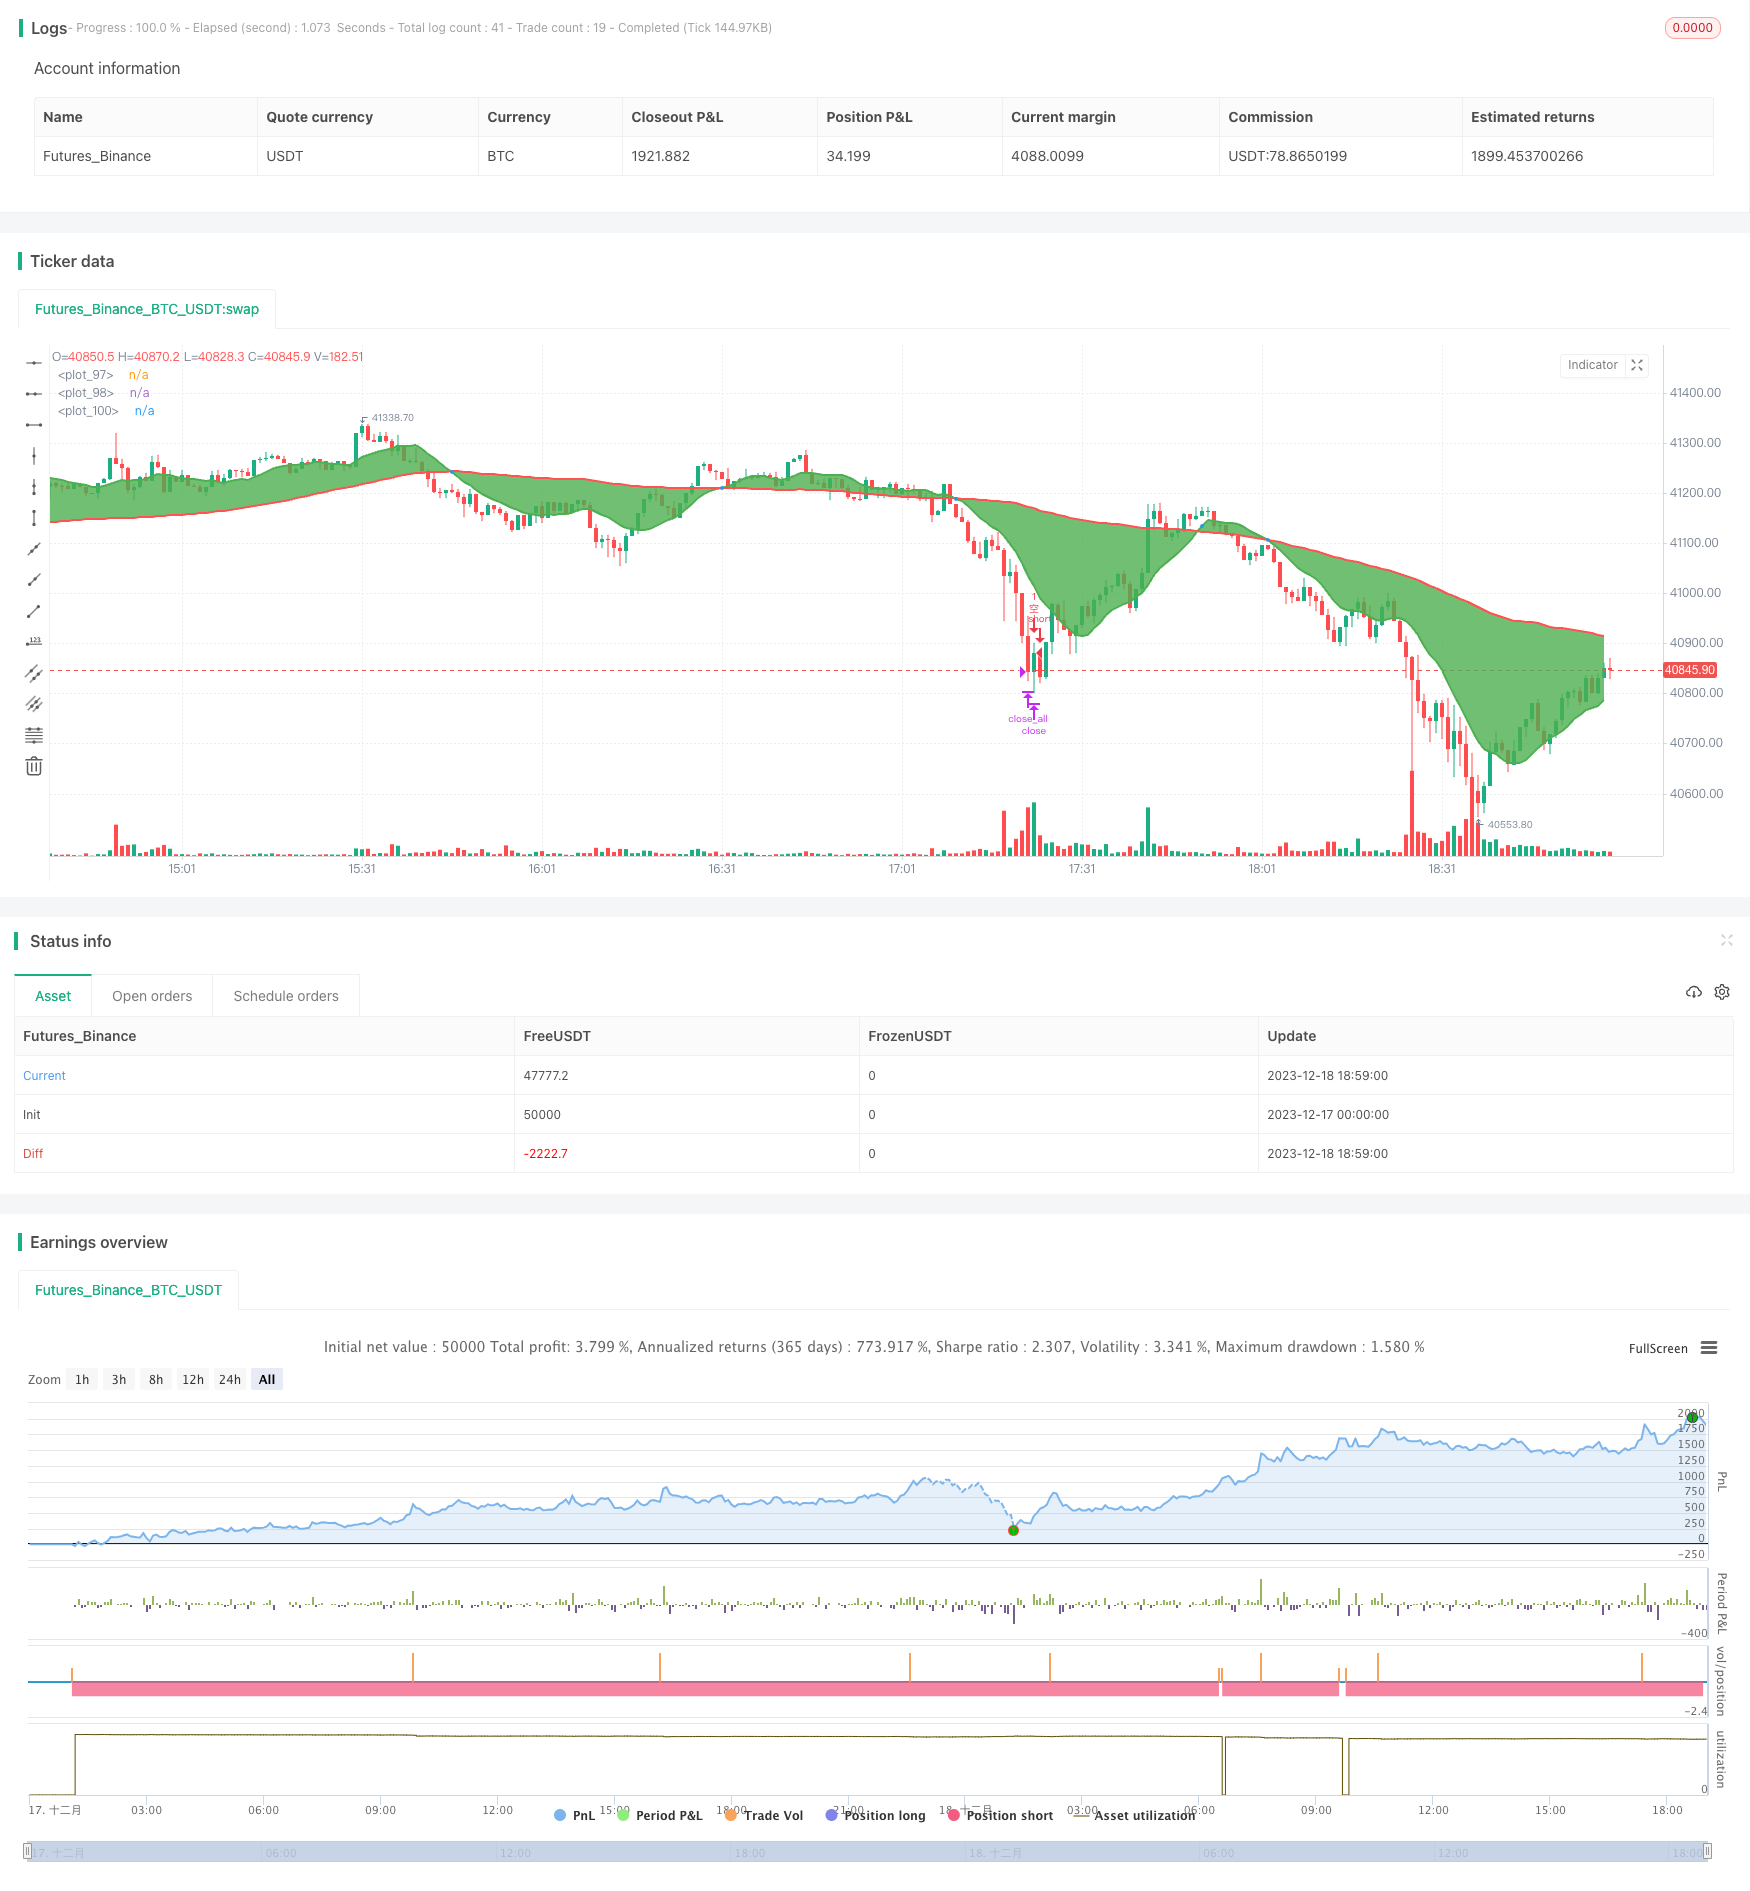
Overview
The strategy is named "Quantitative Trading Strategy Based on RSI Indicator and Moving Average". It utilizes RSI indicator and moving averages as trading signals to implement a quantitative trading strategy that makes reversal operations under trend background. Its core idea is to open positions when price reversal signals occur and take profit when overbought or oversold.
Strategy Principle
The strategy mainly uses RSI indicator and fast/slow moving averages to determine price trends and reversal timing. Specifically, it firstly calculates the fast moving average (SMA) and slow moving average. When the fast SMA crosses over the slow SMA, a buy signal is generated. When the fast SMA crosses below the slow SMA, a sell signal is generated. This indicates the trend of the price is changing.
At the same time, this strategy calculates the RSI indicator to determine whether the price is in an overbought or oversold state. Before opening positions, it will judge whether the RSI indicator is normal. If the RSI exceeds the set threshold, it will suspend opening positions and wait for the RSI to fall back before opening positions. This can avoid establishing positions at unfavorable overbought and oversold timing. On the other hand, after taking positions, if the RSI exceeds the set take profit threshold, it will close positions to take profits. This can lock trading gains.
By collaborating RSI indicator with moving averages, positions can be opened when price reversal signals occur. And by taking profit when overbought or oversold, a quantitative trading strategy that makes reversal operations for profits under price trend background can be implemented.
Advantages
The strategy has the following advantages:
Accurately open positions when price reversal occurs. Using moving average golden cross as buy signal and death cross as sell signal can accurately capture price trend reversal opportunities.
Avoid unfavorable opening positions timing. By judging overbought and oversold conditions through RSI indicator, it can effectively prevent establishing positions when price fluctuates excessively in the short term, avoiding unnecessary floating losses.
Risks can be well controlled. RSI take profit can keep positions within reasonable profit range and effectively control trading risks.
Easy to optimize parameters. SMA periods, RSI parameters etc. can be flexibly adjusted to adapt to different market environments.
High capital utilization efficiency. Frequent trading can be carried out during trend consolidation and shock stages, making efficient use of capital.
Risk Analysis
The strategy also has the following risks:
Tracking error risk. Moving averages as trend judgment indicators have certain lags, which may lead to inaccurate timing of opening positions.
Frequent trading risk. In oscillating markets, it may lead to excessively frequent openings and closings of positions.
Parameter tuning risk. SMA periods and RSI parameters need repeated testing and adjustment to adapt to markets. Improper settings may affect strategy performance.
Take profit risk. Improper RSI take profit settings may also lead to premature exit of positions or continued rise after take profit exit.
Optimization Directions
The optimization directions are as follows:
Try using MACD, Bollinger Bands and other indicators combined with RSI to make signals more accurate and reliable.
Increase machine learning algorithms to automatically adjust parameters based on historical data, reducing parameter tuning risks.
Increase optimization mechanisms for take profit strategies to make take profit more intelligent and adaptable to market changes.
Optimize position management strategies by dynamically adjusting position sizes to reduce risks of single trades.
Combine high-frequency data and use tick-level real-time data for high-frequency trading to improve strategy frequency.
Conclusion
In summary, this strategy uses trading signals generated by RSI indicator and moving averages to implement a quantitative strategy that makes reversal operations during trend runs. Compared to using moving averages alone, by adding RSI indicator judgments, this strategy can effectively prevent unfavorable opening positions timing and control trading risks through RSI take profit. To some extent, it improves the stability of the strategy. Of course, there are still room for improvements for this strategy. In the future, it can be optimized in aspects like more indicator combinations, automatic parameter optimization, position management, etc. to make strategy performance even better.
Parameters
| Name | Default | What it controls |
|---|---|---|
| v_input_1 | 11 | fastLength |
| v_input_2 | 82 | slowLength |
| v_input_3 | 14 | Length |
| v_input_4 | 80 | rsiClose long for profit when exceeding the upper band |
| v_input_5 | 20 | rsiClose short for profit when exceeding the lower band |
| v_input_6 | 75 | rsiOnly Open Long When Below This Threshold |
| v_input_7 | 25 | rsiOnly open short positions when above this threshold |
Source Pine Script
/*backtest
start: 2023-12-17 00:00:00
end: 2023-12-18 19:00:00
period: 1m
basePeriod: 1m
exchanges: [{"eid":"Futures_Binance","currency":"BTC_USDT"}]
*/

//1. go long
//    a. RSIDo not open orders in the overbought zone untilRSIRe-enter order after a slight pullback
//    b. Already have a long position, ifRSIOverbought, then close long for profit, whenRSIAfter falling back a little, go long again until there is a cross signal to reverse the short position.

//2. go short
//    a. RSIDo not open orders in the oversold zone untilRSIOpen long positions after a slight pullback
//    b. Already have a short position, ifRSIOversold, then close short for profit, whenRSIAfter falling back a little, open a short order again until there is a cross signal to reverse and go long.

//@version=4
strategy("Strategy_RSI + Moving Rubbing Line_", overlay=true)

// Input
fastLength = input(11, minval=1)
slowLength = input(82,minval=1)
length = input(title="Length", type=input.integer, defval=14, minval=1, maxval=100)
hight_rsi = input(title="rsiClose long for profit when exceeding the upper band", type=input.integer, defval=80, minval=1, maxval=100)
low_rsi = input(title="rsiClose short for profit when exceeding the lower band", type=input.integer, defval=20, minval=1, maxval=100)

open_long_rsi_threshold = input(title="rsiOnly Open Long When Below This Threshold", type=input.integer, defval=75, minval=1, maxval=100)
open_short_rsi_threshold = input(title="rsiOnly open short positions when above this threshold", type=input.integer, defval=25, minval=1, maxval=100)

// moving average
sma_fast = sma(close, fastLength)
sma_slow = sma(close, slowLength)
// RSI
rsi = rsi(close, length)

//**********Variables*start*******//
var long_f = false // Mark whether it is a long moving average crossover
var short_f = false // Mark whether it is a moving average cross short position
var long_open_pending = false // Mark opening positionrsiWhether in overbought condition
var short_open_pending = false // Mark opening positionrsiIs it oversold?
var long_rsi_over_buy = false // Mark whether a long position triggers overbought profit-taking
var short_rsi_over_sell = false // Mark whether a short position triggers oversold profit-taking

//**********Logic*start*******//

// buy
longCondition = crossover(sma_fast, sma_slow)
if (longCondition)
    short_rsi_over_sell := false // Clear this marker to prevent opening a short position again
    long_f := true
	short_f := false
	if (rsi < hight_rsi)
	    // and not overbought
	    strategy.entry("Many", long=strategy.long)
    if (rsi > hight_rsi)
        // Overbought occurs at the time of opening a position, waitrsiLess Thanhight_rsi
	    long_open_pending := true

// sell
shortCondition = crossunder(sma_fast, sma_slow)
if (shortCondition)
    long_rsi_over_buy := false //Clear this marker to prevent opening a long position again
    long_f := false
    short_f := true
    if (rsi > low_rsi)
        strategy.entry("Empty", long=strategy.short)
	if (rsi < low_rsi)
	    // Oversold occurs at the time of opening a position, waitrsiGreater thanlow_rsi
	    short_open_pending := true


// WaitRSIReasonable, buy to open position
if (long_f and long_open_pending and strategy.position_size == 0 and rsi < open_long_rsi_threshold)
    strategy.entry("Many", long=strategy.long)
	long_open_pending := false
// WaitRSIReasonable, sell to open position
if (short_f and short_open_pending and strategy.position_size == 0 and rsi > open_short_rsi_threshold)
    strategy.entry("Empty", long=strategy.short)
	short_open_pending := false


//RSItake profit(RSIOverbought and long)
if (strategy.position_size > 0 and long_f and rsi > hight_rsi)
	strategy.close_all()
	long_rsi_over_buy := true
//RSItake profit(RSIOversold Short Position)
if (strategy.position_size < 0 and short_f and rsi < low_rsi)
	strategy.close_all()
	short_rsi_over_sell := true


//RSIOpen Long Again After Taking Profit
if (long_f and long_rsi_over_buy and strategy.position_size == 0 and rsi < hight_rsi)
    long_rsi_over_buy := false
    strategy.entry("Many", long=strategy.long)
//RSIOpen Short Again After Taking Profit
if (short_f and short_rsi_over_sell and strategy.position_size == 0 and rsi > low_rsi)
    short_rsi_over_sell := false
    strategy.entry("Empty", long=strategy.short)


//**********Drawing*start*******//

p1 = plot(sma_fast, linewidth=2, color=color.green)
p2 = plot(sma_slow, linewidth=2, color=color.red)
fill(p1, p2, color=color.green)
plot(cross(sma_fast, sma_slow) ? sma_fast : na, style = plot.style_circles, linewidth = 4)

// DrawrsiLine
//plot(rsi, color=color.green, editable=true, style=plot.style_circles, linewidth=2)

// Draw upper and lower bands
//high_ = hline(80, title="Upper rail")
//low_ = hline(20, title="Lower Band")
//fill(high_, low_, transp=80, editable=true, title="Background")
Published by ChaoZhang on the FMZ strategy square · last modified 2023-12-25. Collected in the Quant Trading Vault. Unvalidated research: re-test with your own data and costs before trusting it.
Build this with AgenKit
A spec is not a trading system. Paste this into your coding agent and AgenKit runs a specialist team — architecture, test-first build, risk gates, review — with paper trading on by default.
/agenkit build a production-grade trading bot with a backtest engine, risk controls and paper trading by default from strategies/Quantitative-Trading-Strategy-Based-on-RSI-Indicator-and-Moving-Average.md- npx agenkit install engineering-kit in your project
- Paste the command into your agent and approve each phase
- Get tests, backtest, risk controls and a paper-trading switch
Understand it first
Before you run this, read the lesson behind the idea and how to backtest it honestly. Specs like this one are the survivors of an unknown number of trials; deflate their results accordingly.
Related specs
- Adaptive Mean Reversion Trading Strategy Based on Chande Momentum OscillatorPine Script · Mean reversion · 1d
- Advanced 15 Minute Chart Trading Signal StrategyPine Script · Mean reversion · 3h
- Advanced Momentum EMA Trend Following with RSI Overbought Oversold Trading StrategyPine Script · Mean reversion · 1d
- Advanced Quantitative Trading Strategy Combining RSI Divergence and Moving AveragesPine Script · Mean reversion · 1h
- Advanced Strategy with Volume and Price Pullback Multiple Take ProfitPine Script · Mean reversion · 1h
- BONK Multi Factor Trading StrategyPine Script · Mean reversion · 1d