Strategy vault / Mean reversion
Quantitative Trading Strategy Based on Three Consecutive Bullish Bearish Candles and Dual Moving Averages
This strategy is based on the pattern of three consecutive bullish/bearish candles and a dual moving average system. By judging the change in body size of three consecutive candles and the crossover signals of the…
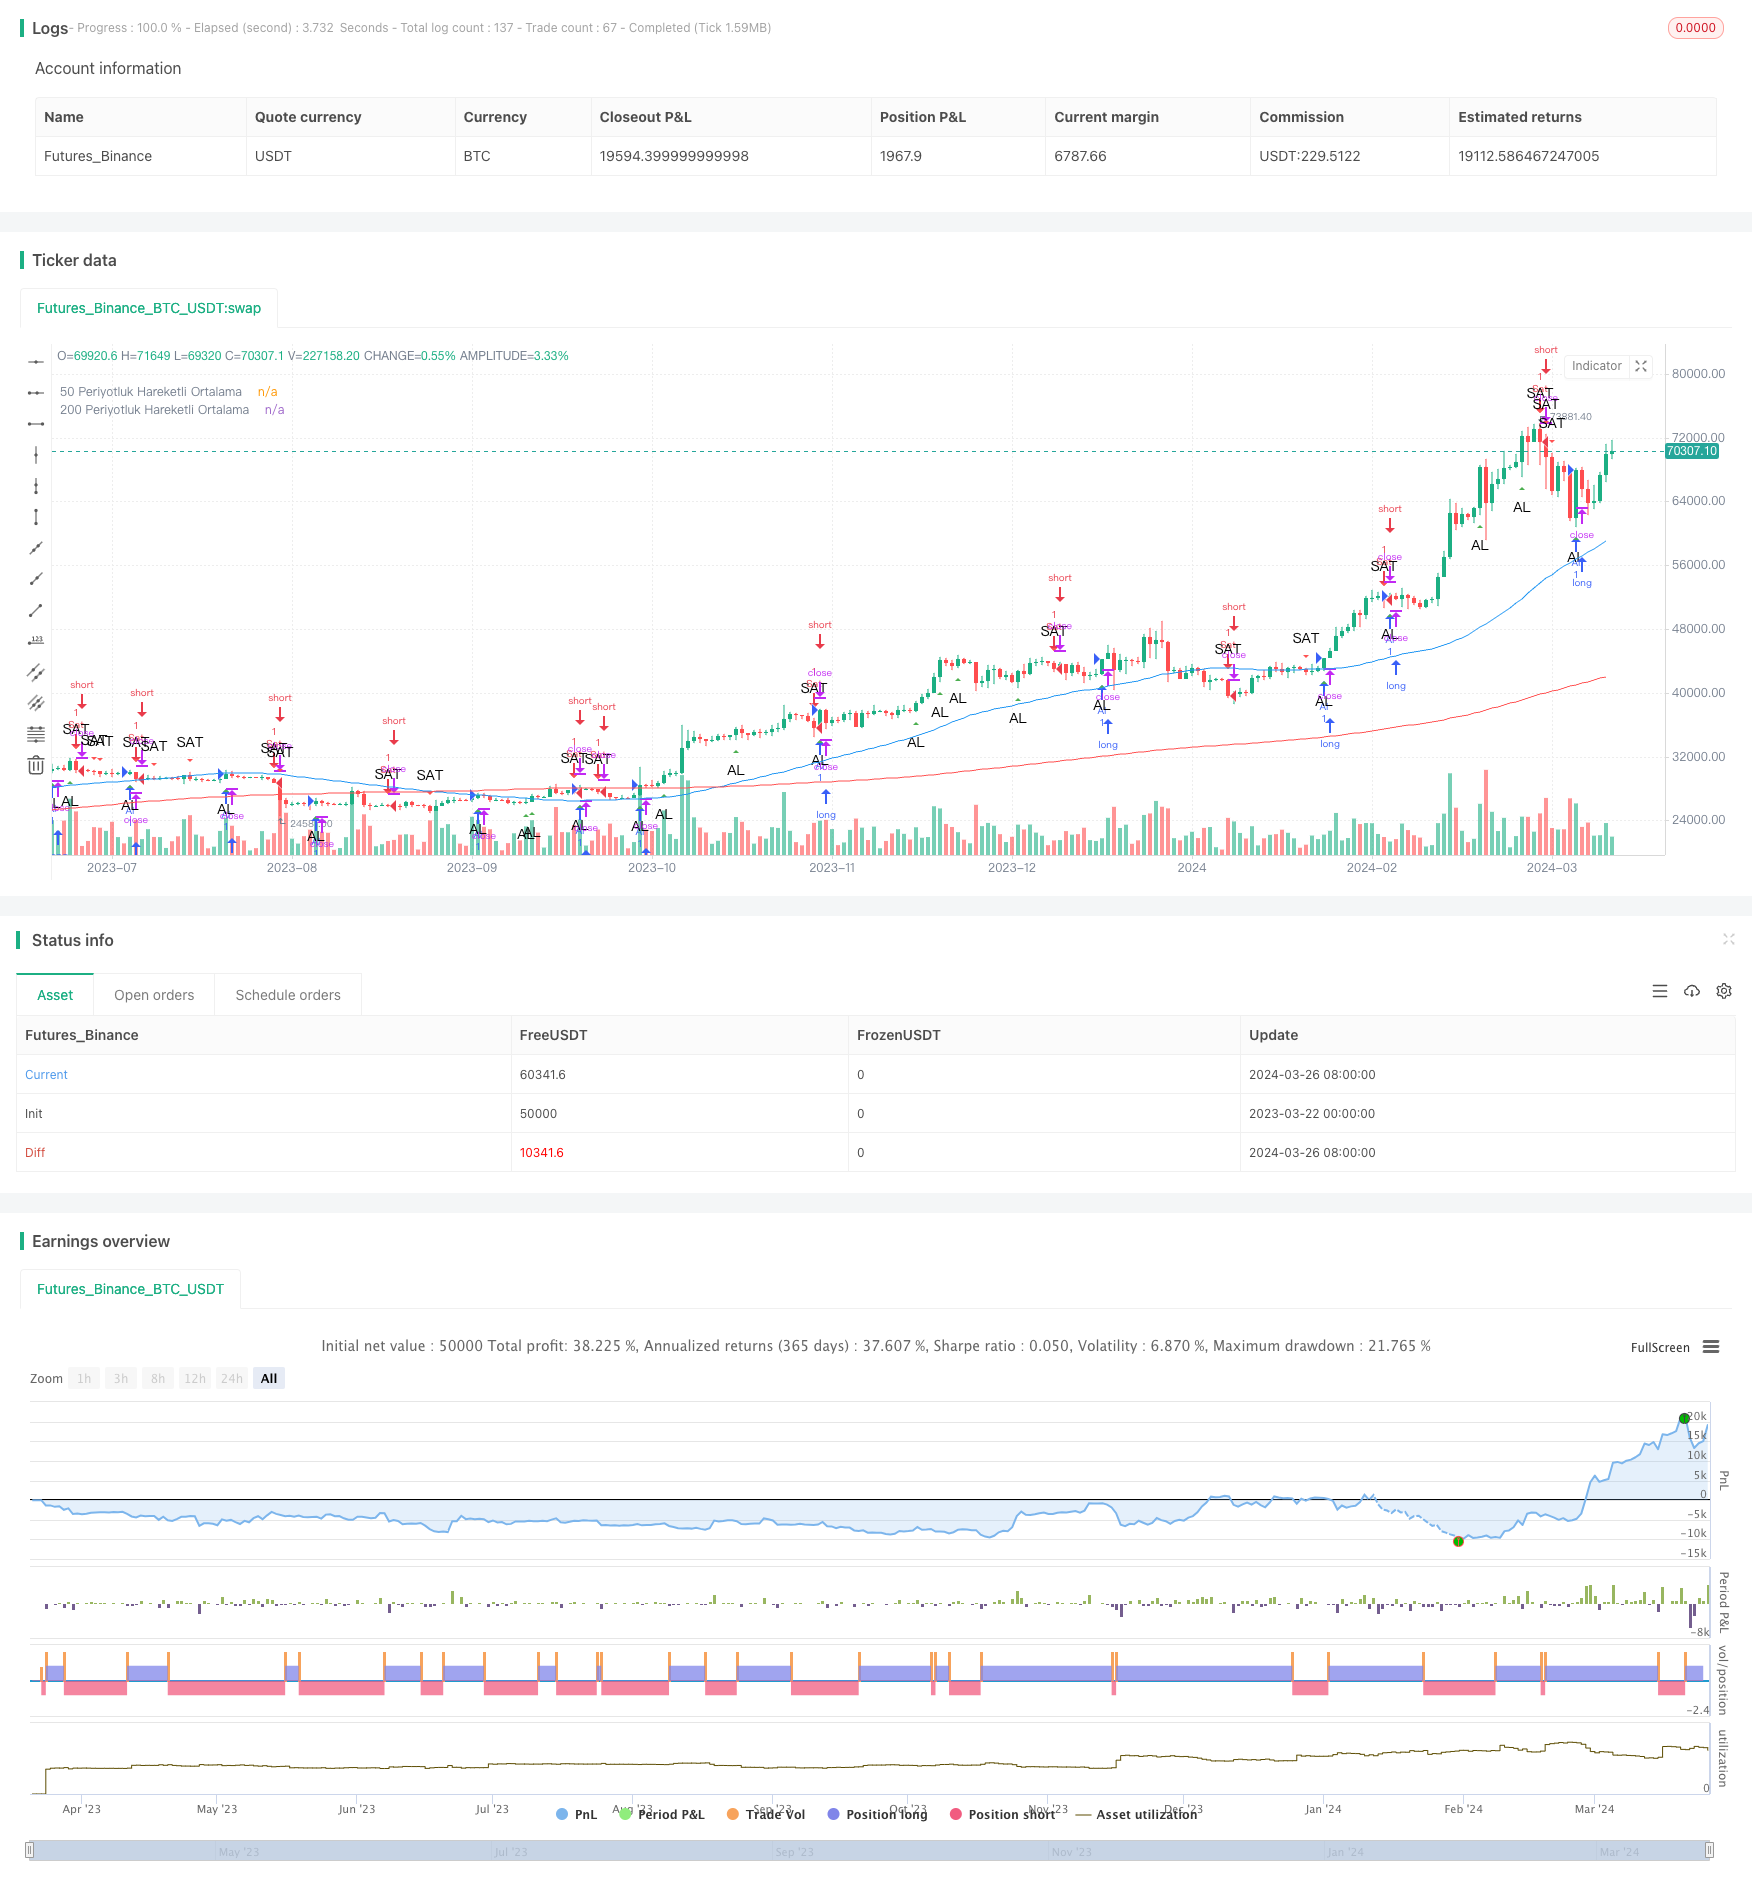
Strategy Overview
This strategy is based on the pattern of three consecutive bullish/bearish candles and a dual moving average system. By judging the change in body size of three consecutive candles and the crossover signals of the moving average system, it generates buy or sell signals at the close of the third candle to capture potential trend turning points and price reversal opportunities.
Strategy Principle
- Calculate the body size of three consecutive candles and determine if they show an increasing trend.
- If the bodies of three consecutive candles increase in size and the third candle closes bullish, a buy signal is generated; if the bodies of three consecutive candles increase in size and the third candle closes bearish, a sell signal is generated.
- Introduce two moving averages of 50-day and 200-day periods, representing medium-short term and long-term trends respectively.
- Plot buy/sell signals and the two moving averages on the chart to visually demonstrate the strategy logic and trend status.
- Execute corresponding entry operations based on the buy/sell signals.
The core of this strategy lies in capturing the starting point of a trend through the three consecutive bullish/bearish candle pattern, while using the dual moving average system to verify trend strength and direction. The combination of these two dimensions aims to effectively enter positions at the beginning of a trend and reduce the risk of counter-trend trading.
Strategy Advantages
- The three consecutive bullish/bearish candle pattern is a strong bullish/bearish signal, representing the continuous strengthening of long/short forces and providing momentum for trend continuation.
- The dual moving average system can effectively verify the direction and strength of the trend. When the short-term moving average crosses above/below the long-term moving average, it indicates that the trend is starting to strengthen/weaken.
- The two dimensions corroborate each other, forming a relatively reliable entry signal that helps improve the strategy's win rate and profit/loss ratio.
- The chart annotations are intuitive and clear, making it easy to track the strategy's execution and trend evolution.
Strategy Risks
- Market noise and fluctuations may lead to frequent false signals, resulting in unstable strategy performance.
- Sudden trend reversals or accelerations may cause the strategy's entry timing to be less than ideal, exposing it to additional risk.
- Lack of explicit take-profit, stop-loss, and position management rules may cause the strategy's drawdown and maximum loss to exceed expectations.
Optimization Directions
- Fine-tune the definition of the three consecutive bullish/bearish candle pattern, such as considering additional conditions like the amplitude, length, and color of consecutive candles, to improve signal accuracy.
- Introduce more moving average period parameters, such as 5-day, 10-day, 20-day, etc., to construct a multi-moving average system and enrich the dimensions of trend judgment.
- Based on the entry signals, set reasonable take-profit and stop-loss levels and position management rules, such as fixed ratio take-profit/stop-loss, percentage take-profit/stop-loss, trailing stop-loss, etc., to control the risk exposure of a single trade.
- Consider adding volume indicators, such as volume-price divergence, volume breakouts, etc., to further validate trend turning points and improve the reliability of entry signals.
Strategy Summary
By combining the classic three consecutive bullish/bearish candle pattern with a dual moving average system, this strategy aims to capture the starting point of a trend and profit from potential price spreads at the beginning of the trend. Its advantages lie in clear signals, simple logic, and ease of implementation and optimization; at the same time, it also has potential risks and room for improvement, such as frequent trading, unstable signals, and insufficient risk control. In the future, we can start from aspects like signal filtering, position management, take-profit/stop-loss, etc., to continuously enrich and strengthen the overall performance of this strategy and provide more references for quantitative trading practice.
Source Pine Script
/*backtest
start: 2023-03-22 00:00:00
end: 2024-03-27 00:00:00
period: 1d
basePeriod: 1h
exchanges: [{"eid":"Futures_Binance","currency":"BTC_USDT"}]
*/

//@version=4
strategy("Consecutive Candles with MAs", shorttitle="CCMAs", overlay=true)

// Üç ardışık mumun büyüklüklerinin arttığını kontrol eden fonksiyon
isThreeConsecutiveCandlesIncreasing() =>
    firstCandleBody = abs(close[2] - open[2])
    secondCandleBody = abs(close[1] - open[1])
    thirdCandleBody = abs(close - open)
    firstCandleBody < secondCandleBody and secondCandleBody < thirdCandleBody

// Üçüncü mum kapandığında al veya sat koşulu
longCondition = isThreeConsecutiveCandlesIncreasing() and close > open
shortCondition = isThreeConsecutiveCandlesIncreasing() and close < open

// 50 ve 200 periyotluk hareketli ortalamalar
ma50 = sma(close, 50)
ma200 = sma(close, 200)

// Al veya sat sinyallerini grafiğe ekleme
plotshape(series=longCondition, title="Al Sinyali", location=location.belowbar, color=color.green, style=shape.triangleup, text="AL")
plotshape(series=shortCondition, title="Sat Sinyali", location=location.abovebar, color=color.red, style=shape.triangledown, text="SAT")

// Hareketli ortalamaların grafiğe eklenmesi
plot(ma50, title="50 Periyotluk Hareketli Ortalama", color=color.blue)
plot(ma200, title="200 Periyotluk Hareketli Ortalama", color=color.red)

// Al veya sat komutlarını çalıştırma
if (longCondition)
    strategy.entry("Al", strategy.long)
if (shortCondition)
    strategy.entry("Sat", strategy.short)
Published by ChaoZhang on the FMZ strategy square · last modified 2024-03-28. Collected in the Quant Trading Vault. Unvalidated research: re-test with your own data and costs before trusting it.
Build this with AgenKit
A spec is not a trading system. Paste this into your coding agent and AgenKit runs a specialist team — architecture, test-first build, risk gates, review — with paper trading on by default.
/agenkit build a production-grade trading bot with a backtest engine, risk controls and paper trading by default from strategies/Quantitative-Trading-Strategy-Based-on-Three-Consecutive-Bullish-Bearish-Candles-and-Dual-Moving-Averages.md- npx agenkit install engineering-kit in your project
- Paste the command into your agent and approve each phase
- Get tests, backtest, risk controls and a paper-trading switch
Understand it first
Before you run this, read the lesson behind the idea and how to backtest it honestly. Specs like this one are the survivors of an unknown number of trials; deflate their results accordingly.
Related specs
- 3 10 Oscillator Profile Flagging StrategyPine Script · Mean reversion · 1d
- A Trend Reversal Strategy Based on Moving Averages Price Patterns and VolumePine Script · Mean reversion · 1d
- Adaptive Mean Reversion Trading Strategy Based on Chande Momentum OscillatorPine Script · Mean reversion · 1d
- Adaptive Trading Strategy Combining Dynamic Trend Reversal and Stochastic IndicatorPine Script · Mean reversion · 1d
- Advanced 15 Minute Chart Trading Signal StrategyPine Script · Mean reversion · 3h
- Advanced Momentum EMA Trend Following with RSI Overbought Oversold Trading StrategyPine Script · Mean reversion · 1d